Higher Highs Lower Lows
- Indikatoren
- Version: 1.1
- Aktivierungen: 5

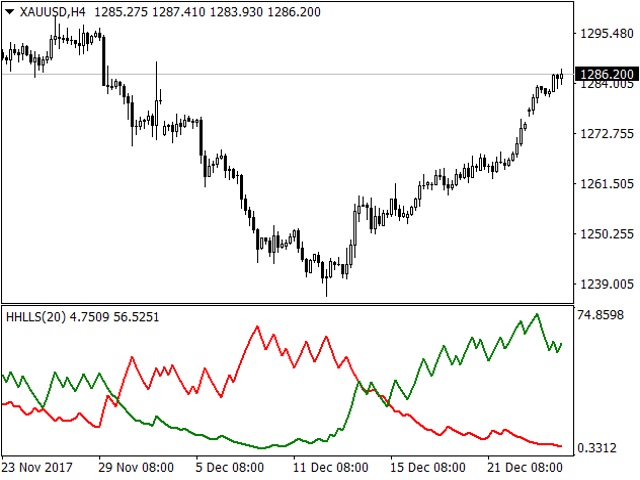
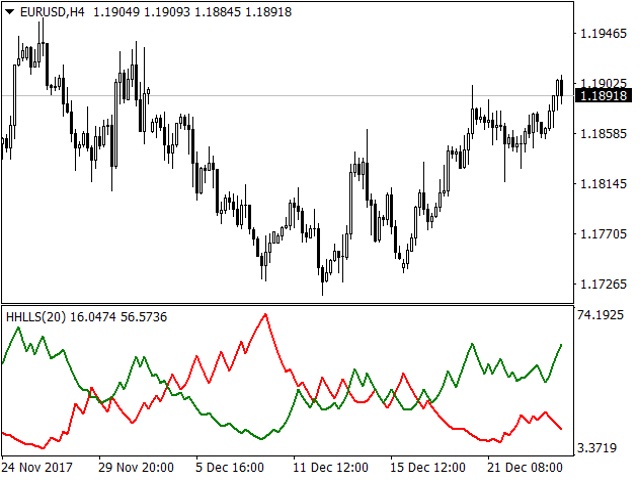
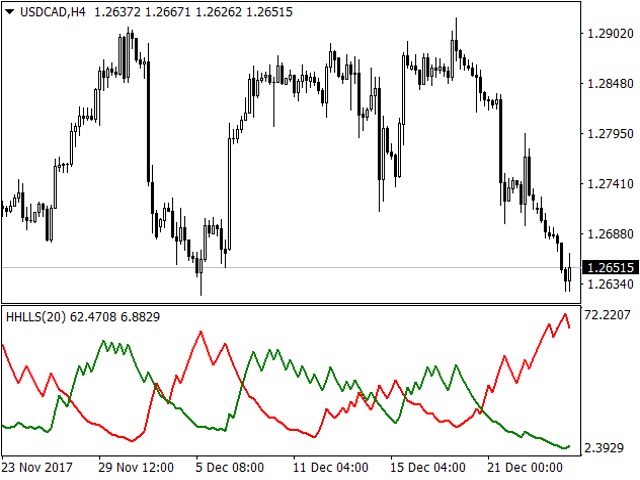
Auf der Grundlage der Idee von Vitali Apirin gibt es einen Momentum-Indikator, den er als ein Instrument beschreibt, das Händlern hilft, die Richtung eines Trends zu bestimmen. Wenn die grüne Linie über der roten Linie liegt, ist der Trend aufwärts gerichtet; wenn die rote Linie über der grünen liegt, ist der Trend abwärts gerichtet.
Der Indikator setzt sich aus zwei separaten Berechnungen zusammen: der HHs oder Higher High Stochastic und der LLs oder Lower Low Stochastic, die zusammen die HHLLs bilden. Vitali Apirin verwendet Ideen, die er beim Studium des stochastischen Oszillators und des Williams %R entdeckt hat, um einen neuen Indikator zu entwickeln, der auf aufeinanderfolgenden Hochs und Tiefs basiert.
HHLLs (higher high, lower low stochastic) können dabei helfen, sich abzeichnende Trends zu erkennen, Korrekturperioden zu definieren und Umkehrungen zu antizipieren. Wie bei vielen anderen Indikatoren können auch bei der HHLLs Signale durch die Suche nach Divergenzen und Überkreuzungen erzeugt werden. Da der HHLLs ein Oszillator ist, kann er auch verwendet werden, um überkaufte und überverkaufte Niveaus zu identifizieren.
Der HHLLs basiert auf exponentiell geglätteten Verhältnissen zwischen hohen Kursen im Verhältnis zu ihren Höchst- und Tiefstwerten der Vorperiode und exponentiell geglätteten niedrigen Kursen im Verhältnis zu ihren Höchst- und Tiefstwerten der Vorperiode. Es werden zwei stochastische Linien erstellt (HHs und LLs), deren Überkreuzungen und Divergenzen mit den zugrunde liegenden Preisen Umkehrungen und Trendfortsetzungen anzeigen. In der Abbildung unten sind sie als grüne bzw. rote Linien zu sehen.
Parameter
- Indikatorperiode: Anzahl der Balken, die für die Berechnung des Indikators verwendet werden. Geeignete Werte: von 5 bis 50. Typischer Wert: 20.
- Berechnete Balken: Anzahl der Balken, für die der Indikator berechnet wird. Je größer diese Zahl ist, desto länger dauert es, bis der Indikator angezeigt wird. Normalerweise sind die letzten 1000 Balken in Ordnung. Um die Geschwindigkeit zu erhöhen, z.B. beim Wechsel des Zeitrahmens im Diagramm, verringern Sie bitte diese Zahl. Diese Zahl kann nicht kleiner sein als die Zahl, die Sie unter "Indikatorperiode" eingegeben haben.
- Methode des gleitenden Durchschnitts - Methode des gleitenden Durchschnitts für Berechnungen. Werte: Einfach, Exponential, Geglättet, Linear gewichtet.