CME CallPut Option Ratio MT5
- Indikatoren
- Version: 1.20
- Aktualisiert: 15 Juli 2020
- Aktivierungen: 5

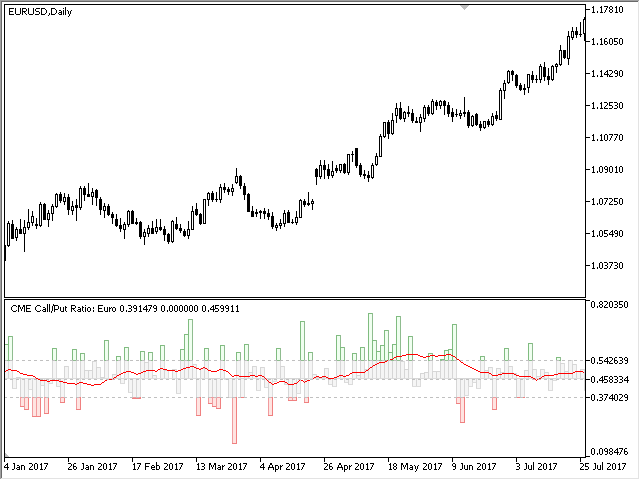
Das Call/Put-Verhältnis ist einer der bekanntesten Indikatoren für die Marktstimmung. Der Indikator wurde von Martin Zweig entwickelt. Er basiert auf den realen Volumina des CBOE-Optionsmarktes. Wie wir wissen, gibt eine Call-Option ihrem Besitzer das Recht, den zugrunde liegenden Vermögenswert zu einem vorher festgelegten Preis zu kaufen. Eine Put-Option gibt das Recht, ihn zu verkaufen. Steigende Volumina bei Call-Optionen deuten also auf eine steigende Nachfrage hin. Das Wachstum des Volumens von Verkaufsoptionen zeigt, dass das Angebot die Nachfrage zu übersteigen beginnt. Wenn wir das Volumen der Call-Optionen durch das gesamte Handelsvolumen teilen, erhalten wir ein Verhältnis, das den Anteil der Käufe im Verhältnis zum gesamten Marktanteil angibt. Er schwankt zwischen 0 und 1 und ist ein Hochfrequenz-Oszillator. Der Indikator ermöglicht es uns, nicht nur die Volumina der Optionsmärkte, sondern auch die Niveaus ihres offenen Interesses als Berechnungsgrundlage zu verwenden, was uns eine tiefere Analyse der Märkte ermöglicht.
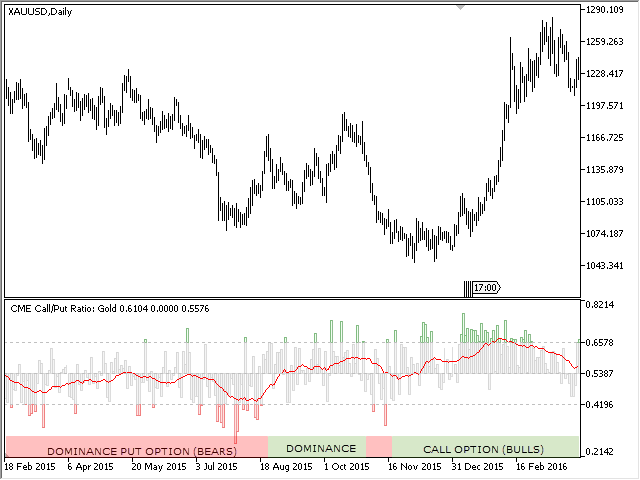
Der Indikator zeigt drei Zonen an:
- Angebot und Nachfrage sind ungefähr gleich groß (grauer Bereich);
- Die Nachfrage übersteigt das Angebot deutlich (grüner Bereich);
- Das Angebot übersteigt die Nachfrage deutlich (roter Bereich).
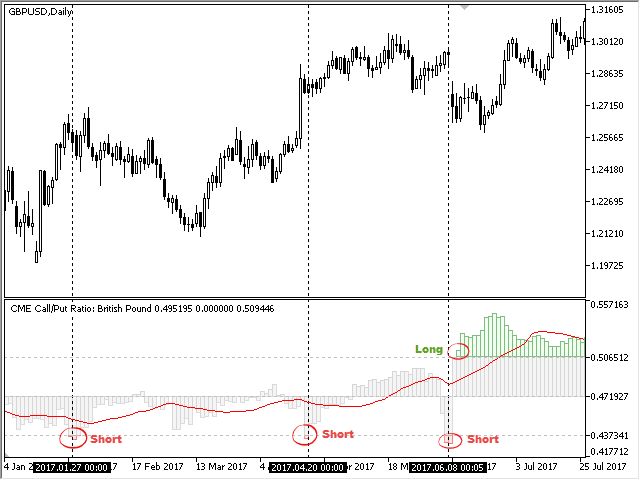
Jeder Markt ist durch einen häufigen Wechsel der Zustände gekennzeichnet: Auf ein schnelles Wachstum folgt eine Periode aktiver Verkäufe, und im Gegenteil, auf einen starken Verkauf kann eine unerklärliche Wachstumsphase folgen. Das Call-Put-Ratio identifiziert den Wechsel dieser Phasen und zeigt Ihnen, wann Sie eine Long- oder Short-Position eröffnen können. Kaufen Sie, wenn das Call-Put-Verhältnis in den grünen Bereich geht, vorausgesetzt, dass es sich vor einigen Balken im roten Bereich befand. Verkaufen Sie hingegen, wenn der Indikator vom grünen in den roten Bereich übergegangen ist. Sie können auch dem Signal der roten Signallinie folgen: Kaufen Sie, wenn ihr Rückgang durch einen Anstieg ersetzt wird, und verkaufen Sie, wenn ihr Anstieg durch einen Rückgang ersetzt wird.
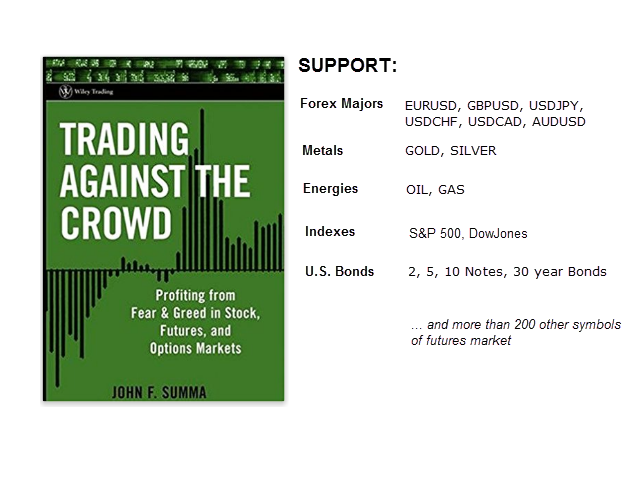
Weitere Einzelheiten zu diesem Indikator finden Sie in dem Buch "Trading Against the Crowd: Profiting from Fear and Greed in Stock, Futures and Options Markets" von John Summa.
Die Daten zum Verhältnis der Optionsvolumina stammen aus einem Abschnitt des "Daily Bulletin" - Berichts der CME, der wöchentlich veröffentlicht wird. Dieser Abschnitt heißt "Daily Volume" und ist als Excel-Datei auf dem offiziellen FTP-Server der Börse verfügbar. Um die Daten zum CallPut Ratio zu aktualisieren, kopieren Sie einfach die entsprechenden Berichte in den Indikatorordner. Detaillierte Anweisungen zur Durchführung der Aktualisierung finden Sie im Blog How to update CME reports on your PC. Im Demonstrationsmodus (während der Testphase) werden die Daten nicht benötigt, der Indikator lädt sie aus seinem internen Speicher. Die Aktualisierung der Berichte ist jedoch in der Demoversion nicht möglich, daher wird das CallPut Ratio in diesem Modus mit einer gewissen Verzögerung angezeigt. Der Indikator funktioniert auf jedem Zeitrahmen, aber die Daten sind nur für den täglichen Zeitrahmen verfügbar; daher ist die vorgeschlagene Chartperiode D1. Die Volumina des aktuellen Handelstages sind jedoch immer verfügbar. Sie werden mehrmals während der Handelssitzung aktualisiert.
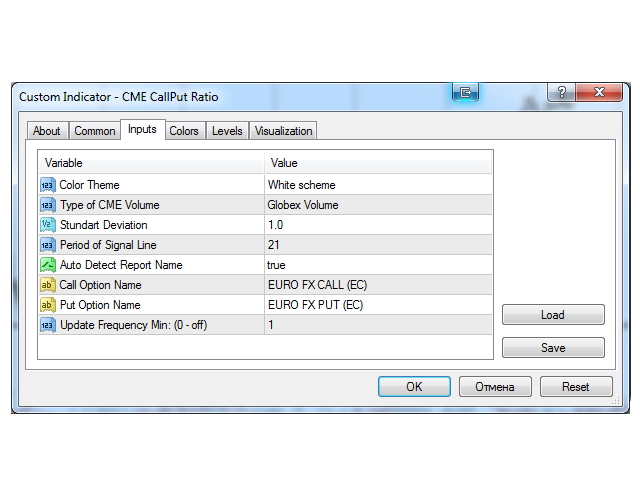
Eingaben:
- Farbthema - wählen Sie eines der drei Farbschemata des Indikators;
- Typ des CME-Volumens - einer der realen Volumentypen der CME, einschließlich des offenen Interesses;
- Stundart Deviation - Standardabweichungsverhältnis, bei dessen Überschreitung das CallPut-Verhältnis in den roten oder grünen Bereich übergeht;
- Periode der Signallinie - Mittelungsperiode des gleitenden Durchschnitts;
- Auto Detect Report Name - true bedeutet, dass die erforderlichen Berichte automatisch heruntergeladen werden. Andernfalls werden stattdessen die in den folgenden beiden Parametern angegebenen Berichte heruntergeladen;
- Call Option Name - Name der Call-Option, die heruntergeladen werden soll;
- Put Option Name - Name der Put-Option, die heruntergeladen werden soll.
- Update Frequency Min - Häufigkeit der Aktualisierung von Daten aus der Dateibasis. 0 - Aktualisierungen deaktiviert, 1 - Aktualisierungen erfolgen einmal pro Minute.


Отличный индикатор для дополнения общей макро-картины!