Time Levels with Alerts
- Indikatoren
- Version: 1.3
- Aktualisiert: 26 November 2021
- Aktivierungen: 20

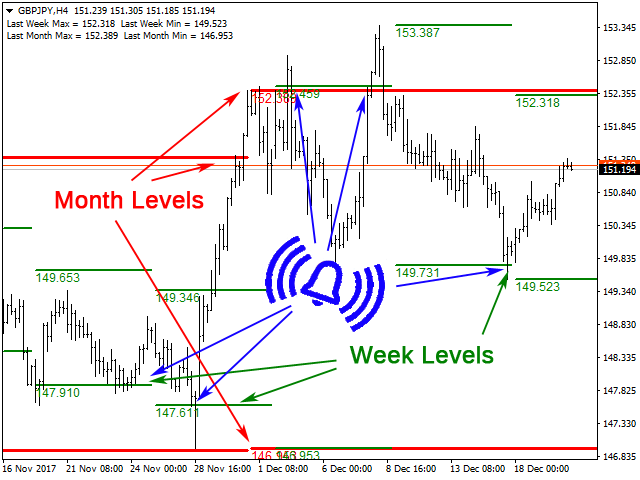
Dies ist eine erweiterte Version des Time Levels-Indikators mit akustischen Alarmen, die auf die Überschneidung der Niveaus hinweisen. Der Indikator ist für die Anzeige der folgenden Kursniveaus auf dem Diagramm vorgesehen:
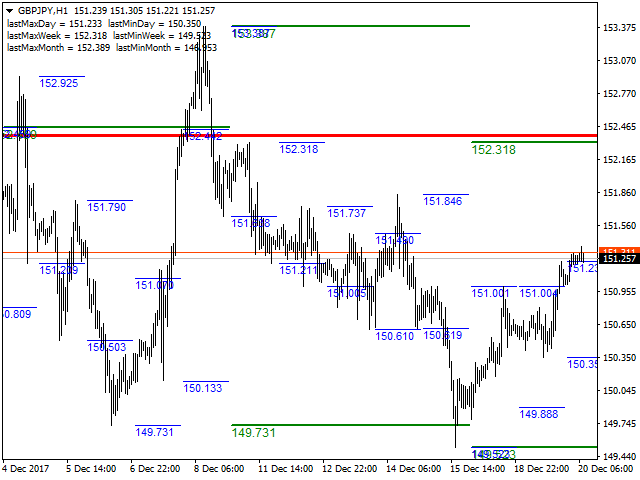
- Hoch und Tief des Vortages.
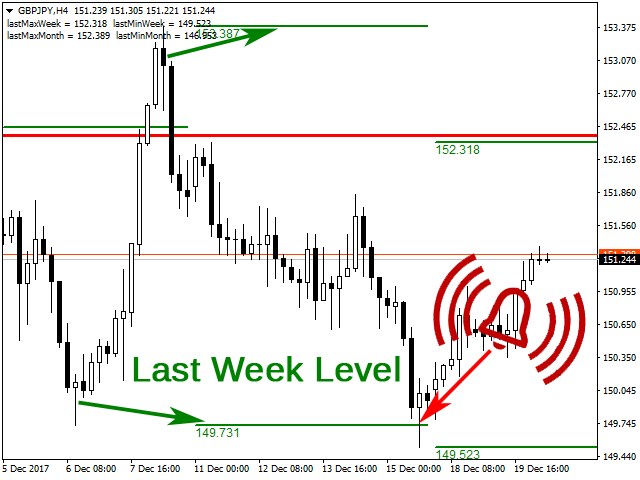
- Höchst- und Tiefststand der Vorwoche.
- Höchst- und Tiefststand des Vormonats.
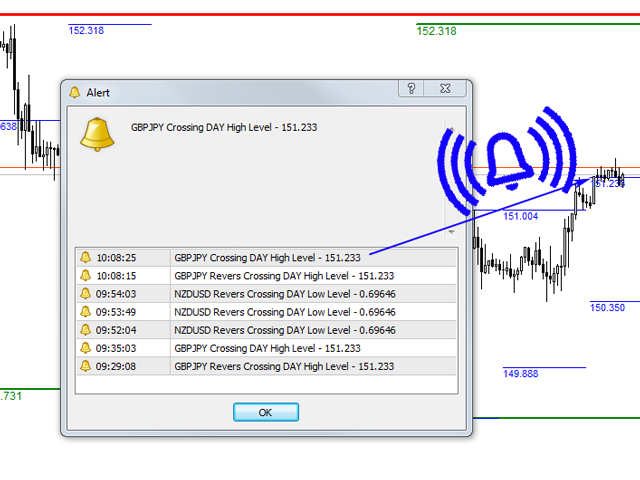
Jeder der Niveautypen ist anpassbar. In den Einstellungen des Indikators können Sie den Linienstil und die Linienfarbe festlegen sowie die einzelnen Levels aktivieren oder deaktivieren. Diese Version verfügt über eine Option zur Alarmierung durch ein Tonsignal und ein Pop-up-Fenster, um den Benutzer über die Überschneidung der Niveaus zu informieren, sowohl wenn der Preis die Linien durchbricht als auch wenn er innerhalb des Kanals zurückkehrt, der aus den ausgewählten Niveaus gebildet wird.
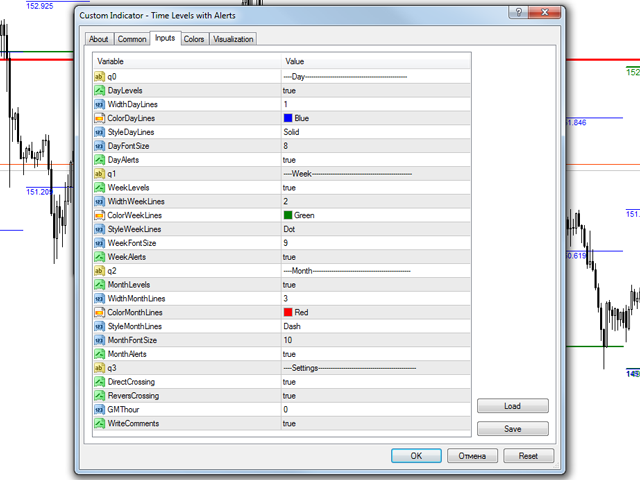
Konfigurationen
- ----Day-------------------------------------------------
- DayLevels - Aktivieren/Deaktivieren der Niveaus des Vortages.
- WidthDayLines - Linienbreite der Tageslevels.
- ColorDayLines - Linienfarbe der Tageslevels.
- StyleDayLines - Linienstil der Tageslevels. Der Parameter funktioniert nur, wenn WidthDayLines =1.
- DayFontSize - Schriftgröße für die Beschriftung der Tagesstufen.
- DayAlerts - aktiviert/deaktiviert Alarme, wenn die Levels überschritten werden.
- ----Week------------------------------------------------
- WeekLevels - Aktiviert/deaktiviert die Pegel der Vorwoche.
- WidthWeekLines - Linienbreite der Wochenpegel.
- ColorWeekLines - Linienfarbe der Wochenlevels.
- StyleWeekLines - Linienstil der wöchentlichen Levels. Der Parameter funktioniert nur, wenn WidthWeekLines =1.
- WeekFontSize - Schriftgröße für die Beschriftung der wöchentlichen Ebenen.
- WeekAlerts - aktiviert/deaktiviert Alarme beim Überschreiten der wöchentlichen Levels.
- ----Month-----------------------------------------------
- MonthLevels - Aktiviert/deaktiviert die Pegel des Vormonats.
- WidthMonthLines - Linienbreite der monatlichen Levels.
- ColorMonthLines - Linienfarbe der monatlichen Levels.
- StyleMonthLines - Linienstil der monatlichen Ebenen. Der Parameter funktioniert nur, wenn WidthMonthLines =1.
- MonthFontSize - Schriftgröße für die Beschriftung der monatlichen Ebenen.
- Month Alerts - aktiviert/deaktiviert Alarme, wenn die monatlichen Levels überschritten werden.
- ----Settings-----------------------------------------------
- DirectCrossing - aktiviert/deaktiviert Alarme, die über Kanalausbrüche benachrichtigen.
- ReversCrossing - aktiviert/deaktiviert Alarme, die über die Rückkehr des Preises innerhalb des Kanals informieren.
- GMThour - Endzeitzone.
- WriteComments - zeigt Textkommentare mit Pegelwerten an.