AIS Fibonacci P Numbers
- Indikatoren
- Version: 1.0
- Aktivierungen: 5

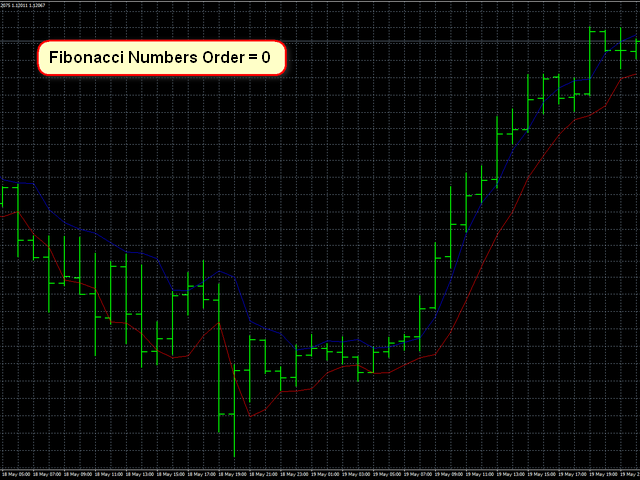
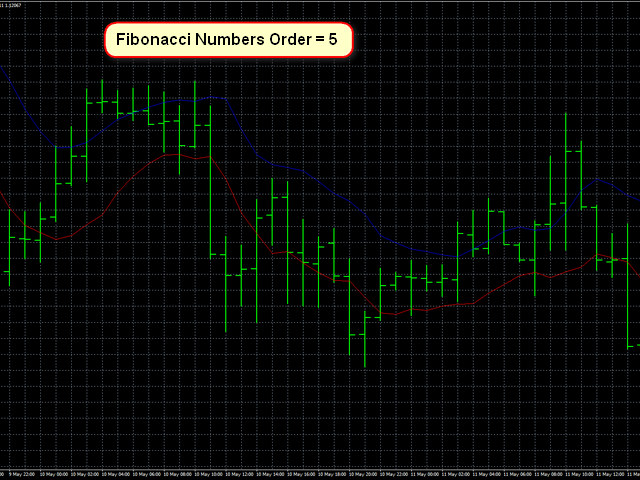
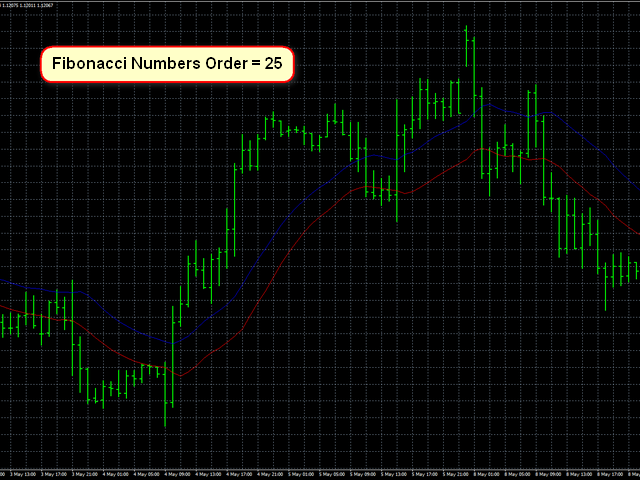
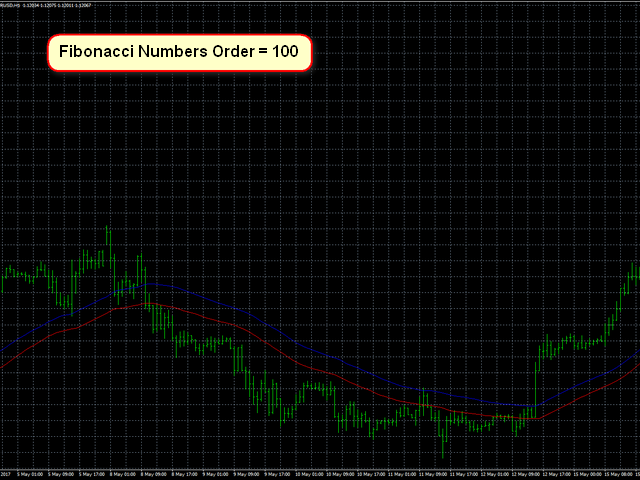
Dieser Indikator verwendet die Fibonacci-P-Zahlen zur Glättung einer Preisreihe. Auf diese Weise lassen sich die Vorteile der einfachen und exponentiellen gleitenden Durchschnitte kombinieren.
Die Glättungskoeffizienten hängen von der Höhe der p-Zahl ab, die in den Indikatorparametern eingestellt wird. Je höher das Niveau ist, desto größer ist der Einfluss des einfachen gleitenden Durchschnitts und desto geringer ist der Einfluss des exponentiellen gleitenden Durchschnitts.
Parameter
- Fibonacci-Zahlen Reihenfolge - Reihenfolge der Fibonacci-P-Zahlen, die vom Händler festgelegt wird. Gültige Werte liegen im Bereich von 0 - 255.
Nach dem Start des Indikators werden in der Registerkarte Experten das "Fibonacci-Zahlenniveau" und die Länge der zur Berechnung der Indikatorwerte verwendeten Reihe ("Länge einer Zahlenreihe") angezeigt. Die Länge der berechneten Reihe hängt von der Anzahl der Dezimalstellen in den Kursen der Währungen ab. Bei 5-stelligen Kursen ist die Genauigkeit der Berechnungen höher, so dass die Länge der Reihe größer ist.