Pivot System
- 指标
- 版本: 1.25
- 更新: 24 七月 2024
- 激活: 7

Description
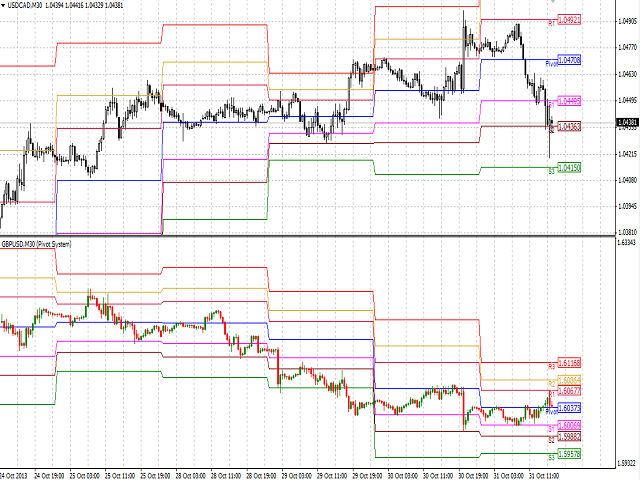
Pivot System is a universal color multicurrency/multisymbol indicator of the Pivot Points levels
systems. You can select one of its three versions: Standard Old, Standard New and Fibo.
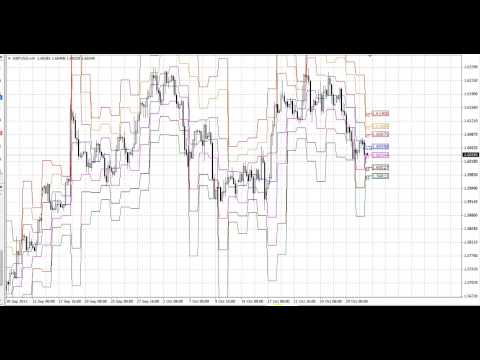
It plots pivot levels in a separate window.
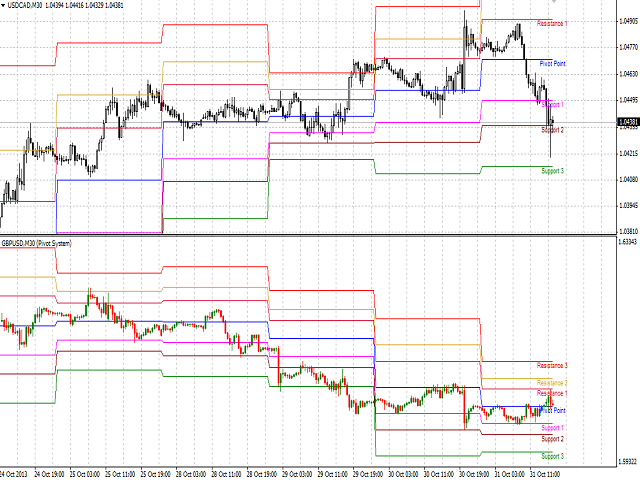
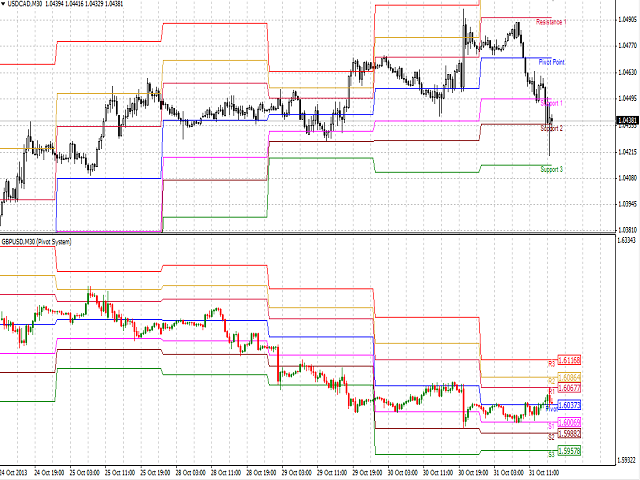
The system will automatically calculate the Pivot Point on the basis of market data for the previous day (PERIOD_D1) and the system of support and resistance levels, three in each. It can also display price tags for each level.
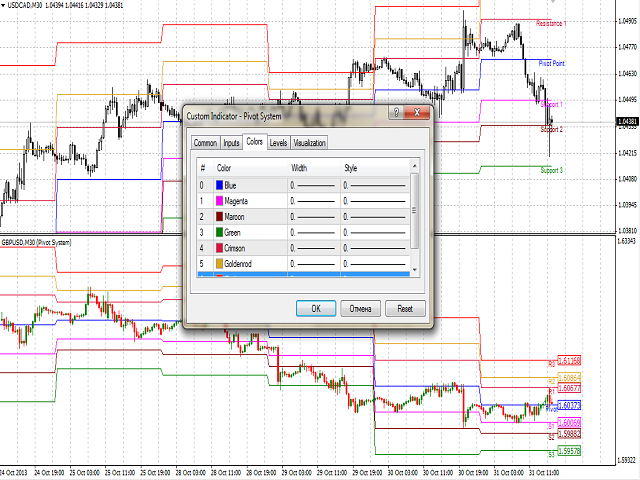
You can color the indicator lines.
The only difference between Standard New and Standard Old version is the method of calculation of the third level of support (S3) and resistance (R3).
Please see attached video to find differences of all three versions (For clearness visualization is made in the main window).
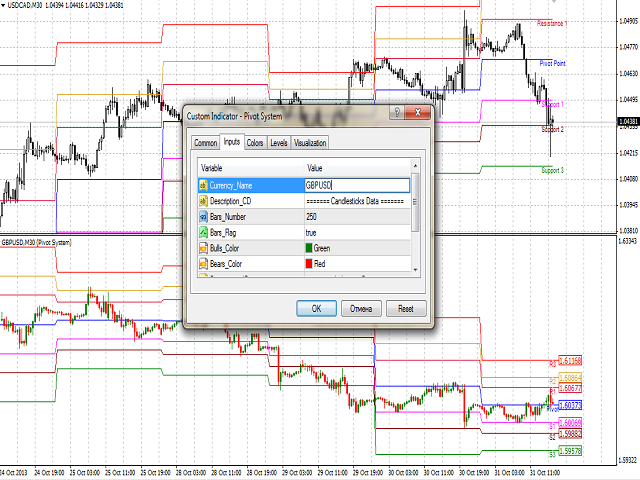
Inputs
- Currency_Name - the name of the financial instrument.
- Bars_Number - the number of bars to be displayed in a separate window.
- Bars_Flag - a flag to allow display of the number of bars specified in the Bars_Number parameter:
- true - according to Bars_Number.
- false - maximum available bars in the history.
- Bulls_Color - the color of the bullish candlestick.
- Bears_Color - the color of the bearish candlestick.
- Bid_Line_Color - color of the Bid line.
- Calc_Method - the Pivot Points calculation method:
- Standard Old.
- Standard New.
- Fibo.
- Price_Flag - permission to display price tags.
By default, the system calculates the levels based on the Standard Old method.
Purpose
The indicator can be used for manual or automated trading in an Expert Advisor. Values of indicator buffers of the double type can be used for automated trading:
- Pivot Point - buffer 0.
- Support level 1 - buffer 1.
- Support level 2 - buffer 2.
- Support level 3 - buffer 3.
- Resistance level 1 - buffer 4.
- Resistance level 2 - buffer 5.
- Resistance level 3 - buffer 6.
Depending on the timeframe of the chart, on which the indicator is used, values of the indicator buffers towards the depth of the history should be requested with a shift relative to the zero bar and the same step on the following principle:
- PERIOD_M1: the shift and the step = 1440.
- PERIOD_M5: the shift and the step = 288.
- PERIOD_M15: the shift and the step = 96.
- PERIOD_M30: the shift and the step = 48.
- PERIOD_H1: the shift and the step = 24.
- PERIOD_H4: the shift and the step = 6.
- PERIOD_D1: the shift and the step = 1.
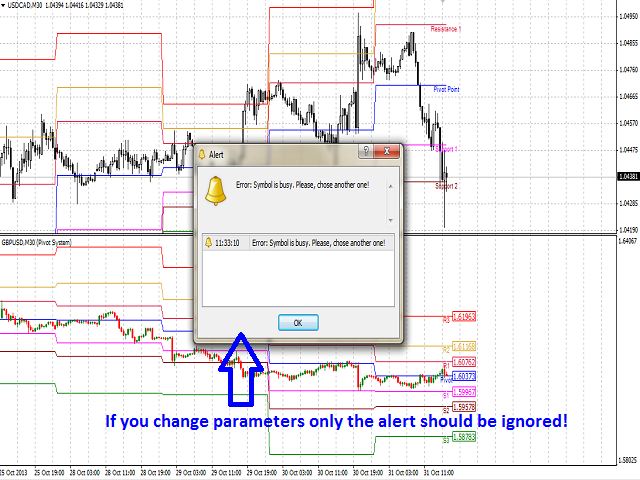
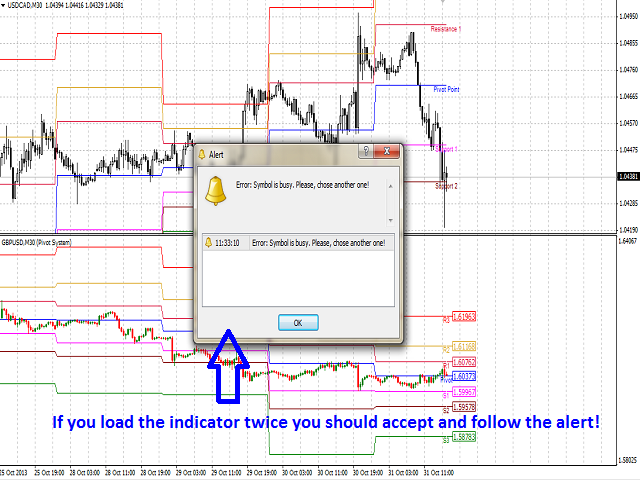
Limitations
Chart for each financial instrument can not be displayed more than once. Otherwise, you receive an error message related to its re-use and will be offered to select another financial instrument.
Recommendations
It is recommended to use the indicator with the parameter Bars_Number not exceeding the number of bars that can be shown in one window (about 250 bars).
Notes
In case of loss of connection with the trading server, when connection is restored and data is downloaded, the chart will be redrawn from the beginning to the number of bars specified by Bars_Number and Bars_Flag.


用户没有留下任何评级信息