Forex Dead Line
- Indikatoren
- Version: 1.1
- Aktualisiert: 17 November 2021
- Aktivierungen: 5

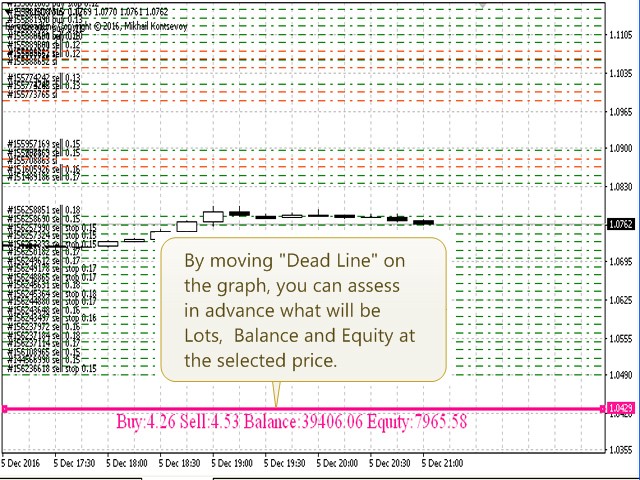
Der Indikator kann Händlern dabei helfen, die Anzahl der Lots, den Saldo und das Eigenkapital im Voraus einzuschätzen, wenn der Preis von den aktuellen Niveaus abweicht. Der Indikator ist nützlich für diejenigen, die mit Grid-Strategien oder Martingale handeln.
Eigenschaften
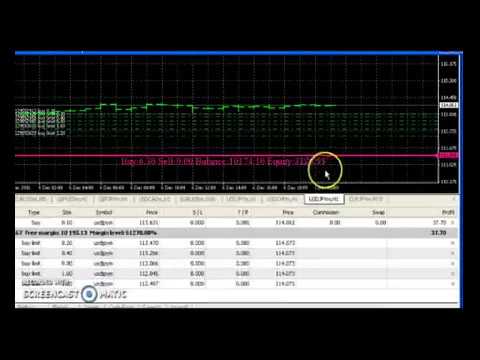
Der Indikator gehört zur Kategorie des Risikomanagements. Er ist nützlich für Händler, die in der Regel viele offene Aufträge für ein Instrument haben. Der Indikator hilft dabei, im Voraus die Kontoveränderung abzuschätzen, die im Falle einer möglichen Preisänderung vom aktuellen Wert bis zu einem Schwellenwert eintreten würde. Er berechnet auch Swap, Lock, Pending Orders, Take Profit und Stop Loss neu. Der Indikator funktioniert auf allen Zeitrahmen und Währungspaaren. Der Indikator berechnet automatisch die Kontoparameter neu, falls neue Aufträge auf einem ausgewählten Niveau erscheinen.
Anmerkung:
- Der Indikator bewertet den Zustand des Kontos nur in Verbindung mit einem ausgewählten Symbol.
- Die Berechnungsergebnisse sind annähernd, wenn die Depotwährung nicht in dem Währungspaar enthalten ist, auf dem der Indikator läuft.
Parameter
- clr - die Farbe des Textes und der "Dead Line".
- style - der Stil der "Dead Line".
- width - die Breite der "Dead Line".
- font_size - Schriftgröße.
- Suffix - zusätzliches Symbol. Einige Broker können Suffixe für Symbolnamen verwenden (z.B. EURUSDm)