ShvedSupDem Pro Zone
- Indikatoren
- Version: 2.0
- Aktualisiert: 22 November 2021
- Aktivierungen: 5

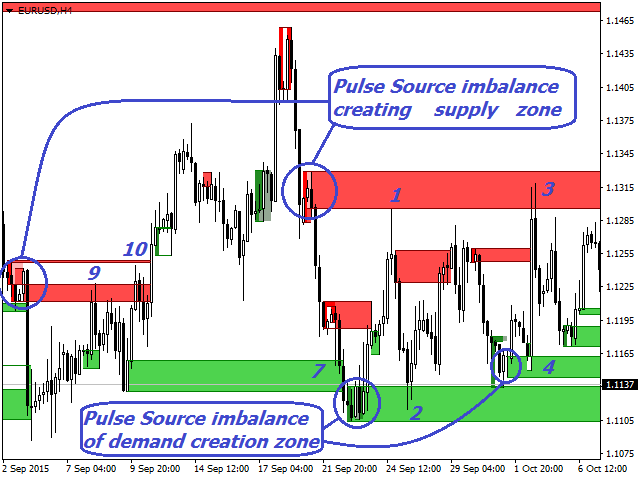
Lassen Sie uns analysieren, was Angebot und Nachfrage sind, und wie relevant der Ausdruck "Marktgedächtnis" ist. Die Screenshots zeigen die Funktionsweise des benutzerdefinierten Indikators SupDem-Pro, der die verbesserte Version meines zuvor erstellten Shved-Indikators für Angebot und Nachfrage ist. Um ihn zu erstellen, habe ich den Handel für fast 3 Jahre aufgegeben und eine Menge Literatur studiert, ich habe während dieser Zeit nicht gehandelt, sondern nur das Verhalten des Preises in verschiedenen Situationen analysiert. Es dauerte ziemlich lange, bis ich die Aufgabe an den Programmierer richtig formuliert hatte. Der Indikator sucht nach Zonen, die ein Ungleichgewicht zwischen Angebot und Nachfrage (Käufern und Verkäufern) aufweisen und zeigt sie auf den Charts für beliebige Instrumente und Zeitrahmen an. Rote Zonen - Angebotszonen, die von Verkäufern dominiert werden. Grüne Zonen - Nachfragezonen, die von Käufern dominiert werden.
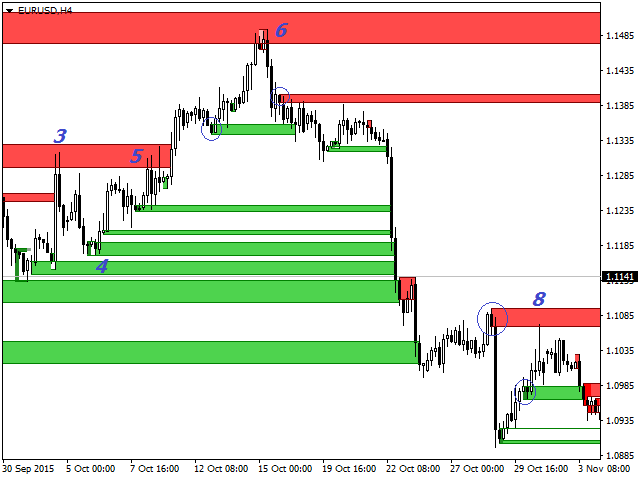
Eur/Usd H4-Chart. Der Kreis zeigt die Bildung der Angebots- und Nachfragezonen. Erfahrene Händler, die verkaufen wollen, befinden sich eher an Punkt 1, da sie wissen, dass die Wahrscheinlichkeit eines Kursrückgangs bei über 50 % liegt. Dies ist der erste Test der Angebotszone, und die Verkäufer siegen über die lästigen Käufer. Aber den Käufern ist es mit genügend Mut gelungen, sie an Punkt 2 zu stoppen.
Bei Punkt 3 sind die Verkäufer immer noch in Führung, aber es wird immer schwieriger, die Käufer zu verdrängen. Dies ist der zweite Zonentest: der Preis bewegt sich noch höher als das vorherige Hoch von Punkt 1. Punkt 4 - Test der Zone. Bei Punkt 5 gab es einen Krieg zwischen Käufern und Verkäufern, der den ganzen Tag andauerte, jede Seite kämpfte bis zum Letzten, aber am Ende des Tages gewannen die Käufer und begannen, den Preis höher und höher zu treiben, ohne dass es einen Rückschlag gab.
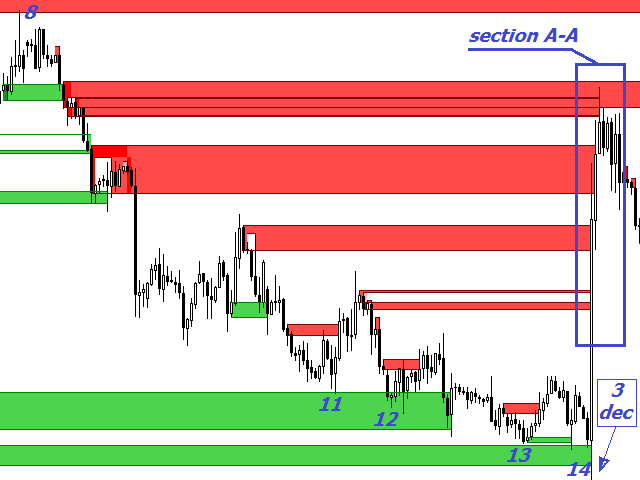
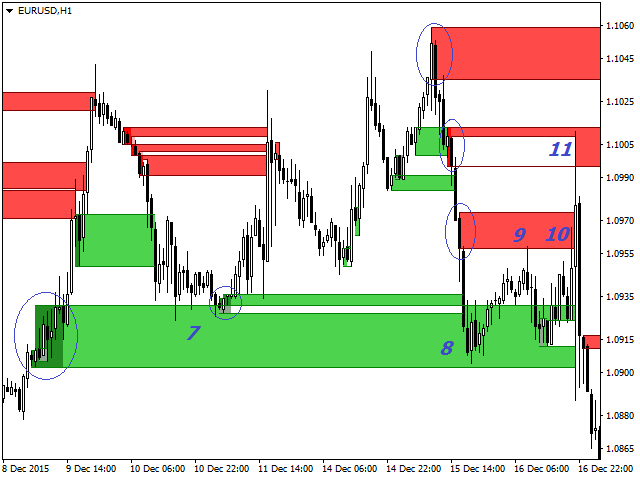
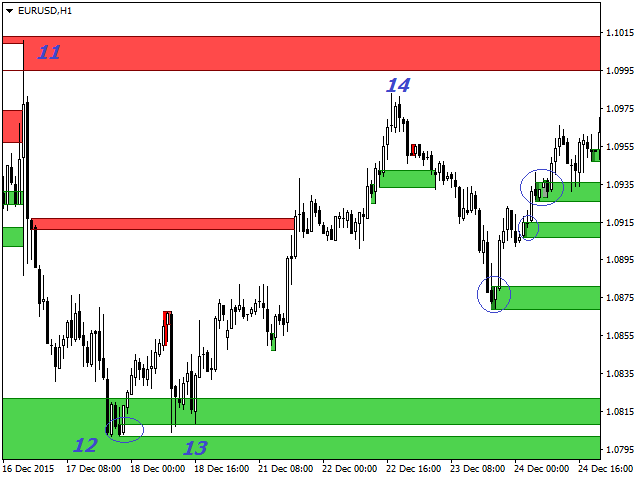
Die Verkäufer bereiteten sich jedoch auf das nächste Treffen bei Punkt 6 vor und waren bereit, die Käufer hatten kaum eine Chance, sie im Sturm zu erobern. An den Punkten 7,8,9,10 wird gezeigt, wie der Preis auf die Angebots- und Nachfragezonen reagiert. Bei den Punkten 11, 12 und 13 nähert sich der Kurs der Nachfragezone auf dem Tages-Chart und verlangsamt sich allmählich. Bei Punkt 14 nähert er sich der Nachfragezone, was auf dem Tages-Chart zu einer Bewegung von 450 Punkten führt.
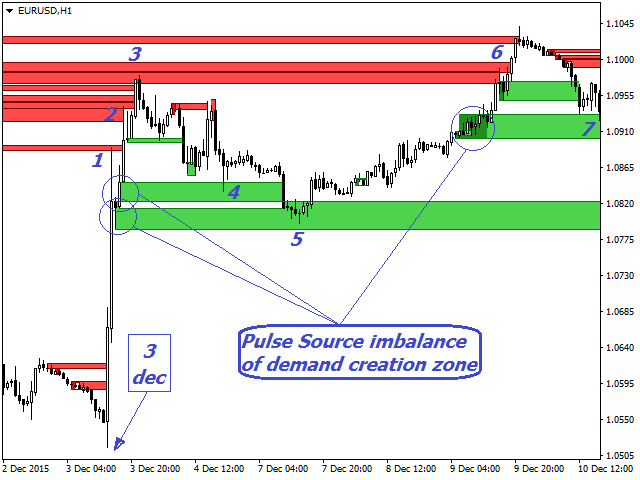
Analysieren wir die Kursbewegung auf dem Eur/Usd-H4-Chart, wie im Abschnitt А-А, aber auf einem kleineren H1-Zeitrahmen, um zu verstehen, wie die Angebots- und Nachfragezonen sozusagen unter dem Mikroskop funktionieren. Unsere Bewegung war am 3. Dezember.
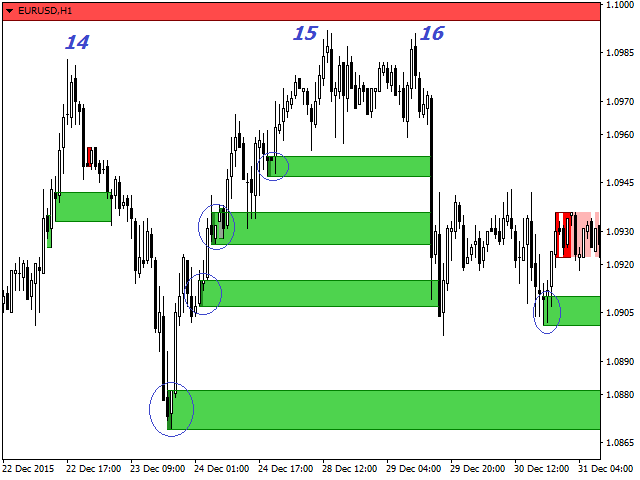
Die Kreise markieren die Bildung von Angebots- und Nachfragezonen. An den Punkten 1,2,3 ist deutlich zu erkennen, wie der Kurs versucht, die zuvor gebildeten Angebotszonen zu überwinden. Nachdem der Kurs die Angebotszone bei Punkt 3 nicht überwinden konnte, zieht er sich auf die nächstgelegene neu gebildete Angebotszone zurück. Die Reaktion auf diese Zonen ist das Kursverhalten an den Punkten 4 und 5. Nach der Korrektur gelingt es dem Kurs, die Angebotszone bei Punkt 6 zu durchbrechen . Er kann jedoch nicht über H4 steigen, da er durch die letzte Angebotszone, die er auf H4 nicht durchbrechen konnte, begrenzt wird. Nach der Konsolidierung sucht der Kurs die nächstgelegene Nachfragezone, die Reaktion der Punkte 7 und 8. Auf dem Weg nach oben gibt es eine weitere neue Angebotszone - die Reaktion der Punkte 9, 10, 11. Nach dem Scheitern beginnt der Kurs, sich zu den nächstgelegenen Zonen zu bewegen, den Punkten 12, 13, 14, 15.
Fazit: Die Angebots- und Nachfragezonen sind immer und überall vorhanden, für jedes Instrument und jeden Zeitrahmen - dies sind die Hauptgesetze des Marktes, die Anfänger sollten damit beginnen.
Wichtig!
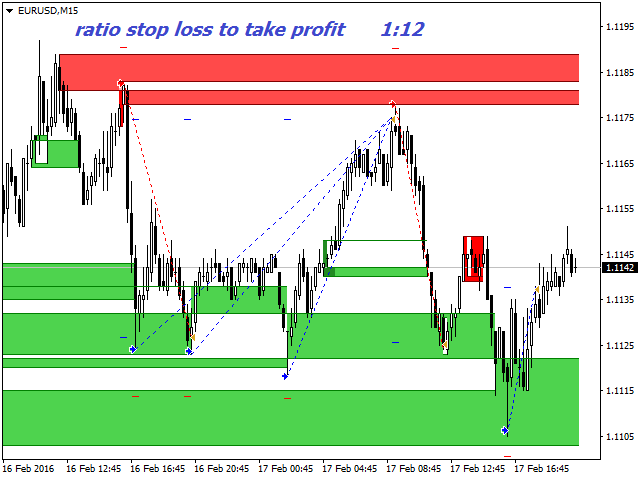
Wenn Sie die Angebots- und Nachfragezonen handeln, müssen Sie die Situation des Instruments auf allen verfügbaren Zeitrahmen analysieren. Denn die Nachfragezone auf einem Zeitrahmen kann sich zum Beispiel innerhalb der Angebotszone des kleineren oder höheren Zeitrahmens befinden. Bedenken Sie also, dass beim Testen im Demomodus (nur 1 Zeitrahmen) die Zonen ausgelöst und durchbrochen werden, dies wird immer passieren, es ist nur so, dass eine Seite (Käufer oder Verkäufer) die Nachfrage- oder Angebotszone nicht für immer kontrollieren kann, irgendjemand gewinnt immer.
Dieser Indikator dient für eine solche Analyse. Er ist in der Lage, die Angebots- und Nachfragezonen für jedes Instrument und jeden Zeitrahmen (M5,M15,M30,H1,H4,D1,W1) anzuzeigen. Sie müssen auch immer daran denken, dass jede, auch die stärkste Bewegung durch eine Zone auf einem kleineren oder höheren Zeitrahmen gestoppt werden kann.
Viel Glück beim Handel.


Отлично