RBCI hist

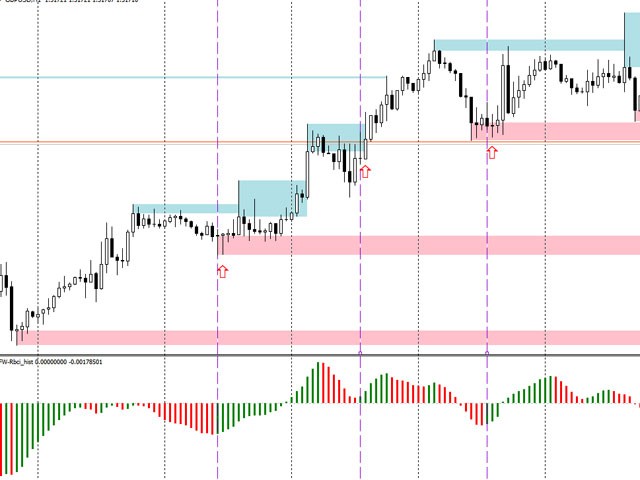
The RBCI hist indicator is an adaptive trend histogram, that eliminates noise using a Low-pass filter, which passes the lower frequencies and cuts off hight frequencies of the price fluctuations.

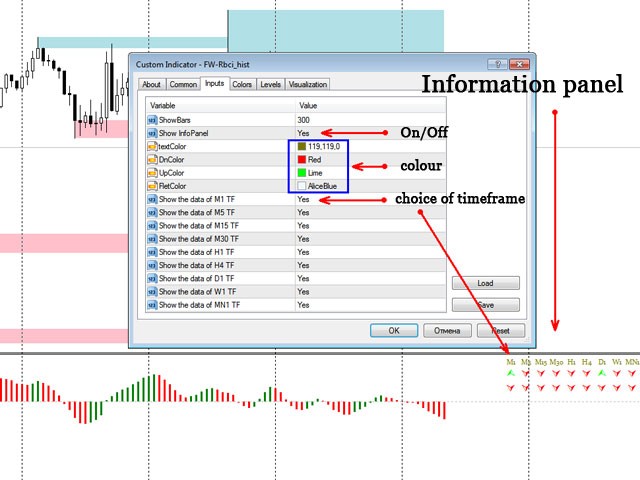
The signal (depending on the strategy chosen by trader) is the intersection of the zero line by the indicator, as well as the change in the histogram color. The change in the histogram color serves as an early signal for opening positions towards the trend. The position of the indicator relative to the zero level shows the strength of the current trend. Availability of an information window, that displays the information on the indicator on other time frames, is a good addition during the option trading or trading by scalping. The first line informs about the current trend, the second - about its strength.


Adjustable Parameters:

  • ShowBars = 300 - Depth of history for the indicator display on the chart;
  • ShowInfoPanel = YES - display the information panel;
  • textColor - period color of the information window;
  • DnColor - color of the downtrend signal of the indicator;
  • UpColor - color of the uptrend signal of the indicator;
  • FletColor - color of the uptrend and downtrend equality signal of the indicator;
  • use_M1-use_MN1 = YES - display information on the current time frame;
Produits recommandés
The Burst MT4
Mhd Amran Bin Lop
The Burst MT4 Hurry and Buy Before Price Doubles Tomorrow! *Non-Repainting Indicator "The Burst" is an indicator that shows precise Buy and Sell Trades. A great arsenal to add to any chart. It's Best to Use The D1,H4 or H1 chart "The Burst" is designed to alert BUY and SELLS. So Of course, For the best take The Arrows In a Uptrend or Downtrend Only For Confirmation *Non-Repainting *For Desktop MT4 Only *Great For Scalping *Great For Intraday *Great For Swing Trading *Arrow Appears at  The "Close
Godfather
Ivan Simonika
The intelligent algorithm of the Godfather indicator accurately determines the trend, filters out market noise and generates entry and exit levels. The indicator will help in finding entry points when analyzing the price chart. The program first receives a "snapshot" of the graph, then analyzes it. The results are reported to the trader in the form of signals. The main purpose of this indicator is to determine the moments of entries and exits from transactions, so the indicator displays only th
BinaryMartini
Abdulkarim Karazon
un indicateur de trading binaire basé sur le croisement 3ma avec macd, il donne des signaux d'achat et de vente à l'ouverture de la barre et il ne repeint ni ne peint en arrière l'indicateur ne se concentre pas sur un taux de victoire élevé car il est conçu pour le trading de martingale, l'indicateur se concentre sur le nombre de signaux perdants le plus bas d'affilée. Stratégie : Le dépôt minimum est de 1 000 unités, nous commençons le trading avec 1 unité (la taille de la transaction est de 1
Fibonacci Currency Strength Meter (FCSM) Early Access Sale!! This new product is still in the process of adding new features and settings. For early bird buyers. The Price will be 50% Sale. In a few weeks, the product will be done. Go Grab your copy while it's still cheap. More details will be added soon. Things to be added. Alert Levels Mobile and Email Alert From it's name, Fibonacci Currency Strength Meter is a combination of Fibonacci levels and Currency Strength Meter. The plot of Fibona
Ultimate Price Predictor (Trade like a pro) Message Me Immediately After Purchase For Installation Help and Strategy This is an arrow indicator that shows precise price reversals. A great arsenal to add to any chart. Ultimate Price Predictor points price reversals with high degree of accuracy and it is great for scalping on the 5min time frame, Or swing trading on the 1hr time frame. Buy and sell arrows are shown on the chart as for entry signals. They do not repaint. *Great For Scalping *Grea
Indicateur Crypto_Forex « Histogramme d'entrée de tendance » pour MT4, sans refonte. - L'indicateur Histogramme d'entrée de tendance permet de rechercher des signaux d'entrée dans la direction de la tendance une fois la barre d'entrée affichée. - Cet indicateur possède une fonctionnalité unique : il prend en compte le prix et le volume pour ses calculs. - L'histogramme d'entrée de tendance peut être de deux couleurs : rouge pour une tendance baissière et bleu pour une tendance haussière. - Dès
The Magic SMMA indicator is of great help in determining trend direction. It can be an excellent addition to your existing strategy or the basis of a new one. We humans can make better decisions when we see better visually. So we designed it to show a different color for rising and falling trends. Everyone can customize this in the way that suits them best. By setting the Trend Period, we can optimize it for longer or shorter trends for our strategy. It is great for all time frames. IF YOU NEE
FREE
Please contact me at telegram  https://t.me/smartforex7 After purchasing SmartForex Indicator then Use This Indicator...................... SMART EXIT PROFIT LINE Indicator is very Helpful with SmartForex Indicator ........................................ SMART EXIT PROFIT LINE Indicator Attach with SmartForex Indicator after then Red Line Show Exit buy Profit , Green Line show Exit Sell Profit................
FREE
Snake NW
Sergei Shishaev
5 (1)
Канальный индикатор "Snake" . Отлично показывает точки входа и выхода. Не перерисовывает! Хорошо подойдет для стратегий с сетками (усреднения), стратегий с пирамидами (стратегий добора), обычной торговли по тренду, торговли на коррекции. Для любых типов инструментов:   валюты, нефть, металлы, криптовалюты. Для любых таймфреймов:   от M1 до D1 . Для любых стилей торговли:   скальпинг, интрадэй, свинг, долгосрок . Используйте в сочетании с трендовым индикатором, чтобы исключить риски входа про
Fibo ichimoku
Mina Edward Habbib Ayoub
5 (1)
I have developed an indicator based on both the fibo musang strategy and the price breaking of the ichimoku cloud and it has amazing results the features are: 1- Once activated it give you the trend where you are from the chart 2- After a trend change it gives you an alert on PC or notification on your phone if you are away. 3- It sends you the exact prices to take an order and 3 take profit levels and your stoploss. 4- It works on every timeframes from 1m to MN. 5- It works on pairs and C
Daily Volatility Tracker is a practical and lightweight indicator designed to help traders monitor and analyze market volatility based on historical daily price movements. Whether you're a day trader, swing trader, or scalper, understanding how much a market moves per day is critical for: Choosing the right pairs to trade Setting accurate stop-loss and take-profit levels Adapting to changing market conditions MT5 Version -  https://www.mql5.com/en/market/product/134960/ Join To Learn Market Dept
FREE
Niubility Trend  Niubility Trend displays the trend direction for all time frames in real time. You'll see at a glance at which direction the trends are running, how long they last and how powerful they are. All this makes it an easy-to-use trend trading system for beginners, advanced and professional traders. Features Easy to trade Customizable colors and sizes It is non-repainting and non-backpainting It is fantastic as a trailing stop method It implements alerts of all kinds
L'indicateur de moyenne mobile R Var est un indicateur de suivi de tendance conçu pour les suiveurs de tendance inconditionnels. Il s'agit d'un indicateur de trading forex très populaire parmi les négociants en actions, ainsi que les négociants en matières premières, et sa popularité découle de sa capacité à fournir de véritables signaux de création d'argent à ses utilisateurs. L'indicateur est composé de points verts et rouges placés sur une ligne de terre de sienne. Le point vert pointe ver
FREE
MQLTA Candle Timer
MQL4 Trading Automation
5 (1)
MQLTA Candle Timer is an indicator that can show you the details about a symbol/pair and alert you before the close of a candle. Used in swing trading and not only, it can help your strategies knowing and be ready before the close of a candle. How does it work Simply add the indicator to the chart and set the notifications options. You can load a minimalistic interface or a full interface. The alert will be sent once per candle. Parameters All the parameters, that you can see in the picture, a
FREE
L'indicateur de flèche R Scalper fournit des flèches de signal d'achat et de vente faciles à lire pour les paires de devises. Bon pour prédire les tendances à court terme. Une flèche vers le haut indique que la paire est dans une tendance haussière à court terme. Une flèche vers le bas indique que la paire est dans une tendance baissière à court terme. Pour les transactions à long terme, placez votre stop loss sous les pips. Pour les transactions courtes, définissez un stop loss via des pips.
PTW NON REPAINT TRADING SYSTEM + HISTOGRAM Non-Repainting ,   Non-Redrawing   and   Non-Lagging  Trading System. Does the following: - Gives Accurate Entry and Exit Points - Scalping, Day and Swing Trading  - 95% Accuracy  - Targets, where to take profits. - Shows Trends, Support and resistance levels - Works on All Brokers - Works on All Currencies, CFDs and Stocks - It does not place trades for you, it only shows you what trades to place. - It works on All Timeframes - It is for Trend or ran
Calculated
Vitalii Zakharuk
Calculated trend indicator, can be used with an optimal risk to profit ratio, shows successful signals. Uses two options for settings. Shows favorable moments for entering the market with arrows. The probability of a successful trend is not very bad! The indicator can be used both for pipsing on small periods, and for long-term trading. The indicator does not redraw and does not lag. It works on all currency pairs and on all timeframes.
The CCI Dashboard is an information panel which allows you to have a global market vision through a Commodity Channel Index. CCI Dashboard analyzes and tracks all the actives you want to invest in. Take advantage of this useful dashboard where you can open in a few seconds the chart and quickly invest on it. Main Features of CCI Dashboard Graphic panel that allows you to know the situation of many assets. 7 Different Commodity Channel Index situations to discover when an asset is overbought or
The Icarus Reversals(TM) Indicator is a powerful tool to identify high-probability reversal points, across all instruments.  The Reversals Indicator provides traders and investors with a simple-to-use and highly dynamic insight into points of likely price-action reversals.  Generated by a unique proprietary code-set, the Reversals Indicator generates long and short trade signals, which can be customised for all inputs, allowing for the complete optimisation fitted to any trader or investor style
Indicator for binary options arrow is easy to use and does not require configuration works on all currency pairs, cryptocurrencies buy signal blue up arrow sell signal red down arrow tips do not trade during news and 15-30 minutes before their release, as the market is too volatile and there is a lot of noise it is worth entering trades one or two candles from the current period (recommended for 1 candle) timeframe up to m 15 recommended money management fixed lot or fixed percentage of the depo
KT Psar Arrows
KEENBASE SOFTWARE SOLUTIONS
KT Psar Arrows trace des flèches sur le graphique en utilisant l'indicateur standard Parabolic SAR. Une flèche haussière est tracée lorsque le plus haut de la bougie touche le SAR. Une flèche baissière est tracée lorsque le plus bas de la bougie touche le SAR. Les signaux sont générés en temps réel sans attendre la clôture de la bougie.  Fonctionnalités Un outil utile pour les traders souhaitant expérimenter des stratégies de trading intégrant l'indicateur Parabolic SAR.  Peut être utilisé pour
TrendSys
Maryna Shulzhenko
Trend Sys, an indicator designed to detect trends in price movement and allows you to quickly determine the direction of the trend. The best way to trade Trend Sys is to enter the market when Trend Sys peaks and goes the other way. This is a sign of a trend reversal. I hope you enjoy this indicator and leave your comments to make it even better. Good luck and happy trading.
Email Drawdown Alert
Roman Starostin
5 (12)
Free informative Indicator-helper. It'll be usefull for traders who trade many symbols or using grid systems (Averaging or Martingale). Indicator counts drawdown as percent and currency separate. It has a number of settings: Count deposite drawdown according equity value and send e-mail or notifications to user if DD more than set; Sending e-mail when max open orders reached; Shows price and remaining pips amount before MarginCall on current chart and Account generally; Display summary trade lot
FREE
Introducing the Austin Trend Scanner: Your Ultimate Tool for Timely Trend Identification. The Austin Trend Scanner is a groundbreaking MetaTrader 4 indicator meticulously engineered to provide traders with precise trend reversal signals across multiple timeframes. Built upon advanced algorithms and non-repainting technology, this indicator offers unparalleled accuracy in identifying profitable trading opportunities. Key Features: 1. Non-Repainting Signals: The Austin Trend Scanner delivers non
Trading with the Transition to quality indicator is as simple as possible, if a blue arrow appears on the chart pointing up, a buy deal is opened. In the same case, if you see a red arrow pointing down, open a sell order. That is, everything is as simple as possible, positions are closed according to the reverse scheme, that is, as soon as a signal is received to open an order in the opposite direction from your position. For example, you opened a long position (sell), close it when a red arro
PX Trend
Vitalii Zakharuk
PX Trend is a technical indicator that mathematically transforms the price of a currency pair in the form of signaling arrows on the chart, it is used to predict the direction of the market movement. This tool is basic for the interpretation of the parameters of the graphs in technical analysis. PX Trend refers to an arrow indicator Forex - a tool that gives unambiguous signals to buy or sell currencies using arrows. An arrow directed upwards recommends buying, downward - selling. The indicato
移動平均線クロス、ボリンジャーと移動平均線のクロス、移動平均線の角度でサイン表示 MT5インジケータ こちらに サイト とがあります。 このインジケータは3つのパターンでサインを表示(切り替え可能)します。 ①   移動平均線のクロス ②   ボリンジャーバンドと短期移動平均線とのクロス ③   ボリンジャーバンドと短期移動平均線とのクロスと、中期移動平均線と長期移動平均線の角度 移動平均線のクロス 指定した短期移動平均線と長期移動平均線のゴールデンクロスでは買いサイン、デットクロスでは売りサインを表示します。 ディフォルトでは短期は5,長期は20となっています。 もちろん変更可能になります。 移動平均線の種類をEMA(指数平滑移動平均線)やSMMA(平滑化移動平均)などに変更可能で適する価格も変更可能になります。 ボリンジャーバンドと短期移動平均線のクロス ボリンジャーバンド(以降BB)と短期移動平均線のクロスでサインを表示します。 ディフォルトではBB+1σと5MAのゴールデンクロスで買いサイン、BB-1σと5MAのデットクロスで売りサインでサインを表示します。 BBの期間や、B
ArchIntel Pivot Point
Raphael Adetunji Olaiyapo
This tool draws all the pivot point lines on chart. It is important to remind/tell you that there are 5 pivot method according to BabyPips website. All these methods have their unique mathematical formula. 1. Floor Method. 2. Woodie Method. 3. Camarilla Method. 4. DeMark Method. 5. Fibonacci Method. What makes this pivot tool unique is that you can click the "Fibonacci" button to select the pivot method you want. You can click the "Monthly" button to select the Period you want to use for the piv
Présentation du Moving Average Crossover Scanner Pro, un multi-symbole puissant et polyvalent,       Multi-période       indicateur conçu pour améliorer vos décisions de trading. Cet indicateur avancé intègre des croisements de moyenne mobile (MA) et offre des fonctionnalités supplémentaires pour fournir des alertes rapides et fiables. Avec le Moving Average Crossover Scanner Pro, vous pouvez bénéficier des caractéristiques uniques des croisements MA sur plusieurs paires de devises et périodes
Introduction to Fractal Pattern Scanner Fractal Indicator refers to the technical indicator that makes use of the fractal geometry found in the financial market. Fractal Pattern Scanner is the advanced Fractal Indicator that brings the latest trading technology after the extensive research and development work in the fractal geometry in the financial market. The most important feature in Fractal Pattern Scanner is the ability to measure the turning point probability as well as the trend probabi
Les acheteurs de ce produit ont également acheté
Gann Made Easy
Oleg Rodin
4.83 (157)
Gann Made Easy est un système de trading Forex professionnel et facile à utiliser qui est basé sur les meilleurs principes de trading en utilisant la théorie de mr. WD Gann. L'indicateur fournit des signaux d'ACHAT et de VENTE précis, y compris les niveaux Stop Loss et Take Profit. Vous pouvez échanger même en déplacement en utilisant les notifications PUSH. VEUILLEZ ME CONTACTER APRÈS L'ACHAT POUR RECEVOIR GRATUITEMENT DES INSTRUCTIONS DE TRADING ET D'EXCELLENTS INDICATEURS SUPPLÉMENTAIRES! Vou
M1 Sniper
Oleg Rodin
5 (19)
M1 SNIPER est un système d'indicateurs de trading facile à utiliser. Il s'agit d'un indicateur à flèche conçu pour l'unité de temps M1. Cet indicateur peut être utilisé seul pour le scalping sur l'unité de temps M1 ou intégré à votre système de trading existant. Bien que conçu spécifiquement pour le trading sur l'unité de temps M1, ce système peut également être utilisé avec d'autres unités de temps. Initialement, j'avais conçu cette méthode pour le trading du XAUUSD et du BTCUSD. Cependant, je
Game Changer Indicator
Vasiliy Strukov
3.77 (26)
Game Changer est un indicateur de tendance révolutionnaire conçu pour être utilisé sur n'importe quel instrument financier et transformer votre MetaTrader en un puissant outil d'analyse de tendance. Il fonctionne sur toutes les unités de temps et facilite l'identification des tendances, signale les retournements potentiels, sert de mécanisme de stop suiveur et fournit des alertes en temps réel pour une réactivité optimale du marché. Que vous soyez un professionnel chevronné ou un débutant en qu
Dynamic Forex28 Navigator
Bernhard Schweigert
4.43 (7)
Dynamic Forex28 Navigator - L'outil de trading Forex de nouvelle génération. ACTUELLEMENT 49 % DE RÉDUCTION. Dynamic Forex28 Navigator est l'évolution de nos indicateurs populaires de longue date, combinant la puissance de trois en un : Advanced Currency Strength28 Indicator (695 avis) + Advanced Currency IMPULSE avec ALERT (520 avis) + CS28 Combo Signals (Bonus). Détails sur l'indicateur https://www.mql5.com/en/blogs/post/758844 Qu'offre l'indicateur de force de nouvelle génération ? Tout
Scalper Inside PRO
Alexey Minkov
4.74 (69)
An exclusive indicator that utilizes an innovative algorithm to swiftly and accurately determine the market trend. The indicator automatically calculates opening, closing, and profit levels, providing detailed trading statistics. With these features, you can choose the most appropriate trading instrument for the current market conditions. Additionally, you can easily integrate your own arrow indicators into Scalper Inside Pro to quickly evaluate their statistics and profitability. Scalper Inside
Atomic Analyst
Issam Kassas
5 (3)
Tout d'abord, il convient de souligner que cet indicateur de trading n'est ni repainting, ni redrawing et ne présente aucun délai, ce qui le rend idéal à la fois pour le trading manuel et automatisé. Manuel de l'utilisateur : réglages, entrées et stratégie. L'Analyste Atomique est un indicateur d'action sur les prix PA qui utilise la force et le momentum du prix pour trouver un meilleur avantage sur le marché. Équipé de filtres avancés qui aident à éliminer les bruits et les faux signaux, et à
GOLD Impulse with Alert
Bernhard Schweigert
4.64 (11)
Cet indicateur est une super combinaison de nos 2 produits Advanced Currency IMPULSE with ALERT  +   Currency Strength Exotics . Il fonctionne pour tous les cadres temporels et montre graphiquement l'impulsion de force ou de faiblesse pour les 8 principales devises plus un symbole ! Cet indicateur est spécialisé pour montrer l'accélération de la force des devises pour tout symbole comme l'or, les paires exotiques, les matières premières, les indices ou les contrats à terme. C'est le premier
RFI levels PRO
Roman Podpora
5 (1)
L'indicateur montre avec précision les points de retournement et les zones de retour des prix où le       Acteurs majeurs   . Vous repérez les nouvelles tendances et prenez des décisions avec une précision maximale, en gardant le contrôle de chaque transaction. VERSION MT5     -     Révèle son potentiel maximal lorsqu'il est combiné à l'indicateur   TREND LINES PRO Ce que l'indicateur montre : Structures et niveaux d'inversion avec activation au début d'une nouvelle tendance. Affichage des nive
Scalper Vault
Oleg Rodin
5 (36)
Scalper Vault est un système de scalpage professionnel qui vous fournit tout ce dont vous avez besoin pour un scalpage réussi. Cet indicateur est un système de trading complet qui peut être utilisé par les traders de forex et d'options binaires. Le délai recommandé est M5. Le système vous fournit des signaux fléchés précis dans le sens de la tendance. Il vous fournit également des signaux supérieurs et inférieurs et des niveaux de marché Gann. Les indicateurs fournissent tous les types d'alertes
Trend Lines PRO
Roman Podpora
5 (1)
TREND LINES PRO     Cet indicateur permet de comprendre les véritables changements de direction du marché. Il révèle les renversements de tendance et les points de retour des principaux acteurs. Tu vois     Lignes BOS     Détection des changements de tendance et des niveaux clés sur des unités de temps supérieures, sans paramètres complexes ni interférences inutiles. Les signaux restent affichés sur le graphique même après la fermeture de la bougie. VERSION MT 5    -     Révèle son potentiel max
Supply and Demand Dashboard PRO
Bernhard Schweigert
4.8 (20)
Actuellement 40% de réduction ! Ce tableau de bord est un logiciel très puissant qui fonctionne sur plusieurs symboles et jusqu'à 9 horizons temporels. Il est basé sur notre indicateur principal (Best reviews : Advanced Supply Demand ).   Le tableau de bord donne une excellente vue d'ensemble. Il montre :  Les valeurs d'offre et de demande filtrées, y compris l'évaluation de la force de la zone, Les distances en pips vers/et dans les zones, Il met en évidence les zones imbriquées, Il donne 4
Trend Screener
STE S.S.COMPANY
4.79 (95)
Indicateur de tendance, solution unique révolutionnaire pour le trading et le filtrage des tendances avec toutes les fonctionnalités de tendance importantes intégrées dans un seul outil ! Il s'agit d'un indicateur multi-période et multi-devises 100 % non repeint qui peut être utilisé sur tous les symboles/instruments : forex, matières premières, crypto-monnaies, indices et actions. OFFRE À DURÉE LIMITÉE : L'indicateur Support and Resistance Screener est disponible pour seulement 50 $ et à vie. (
Actuellement 40% de réduction ! La meilleure solution pour tout débutant ou trader expert ! Ce logiciel de tableau de bord fonctionne sur 28 paires de devises. Il est basé sur 2 de nos principaux indicateurs (Advanced Currency Strength 28 et Advanced Currency Impulse). Il donne un excellent aperçu de l'ensemble du marché Forex. Il montre les valeurs de l'Advanced Currency Strength, la vitesse de mouvement des devises et les signaux pour 28 paires de devises dans tous les (9) délais. Imaginez
Volatility Trend System - un système de trading qui donne des signaux pour les entrées. Le système de volatilité donne des signaux linéaires et ponctuels dans le sens de la tendance, ainsi que des signaux pour en sortir, sans redessiner ni retarder. L'indicateur de tendance surveille la direction de la tendance à moyen terme, montre la direction et son changement. L'indicateur de signal est basé sur les changements de volatilité et montre les entrées sur le marché. L'indicateur est équipé de pl
El indicador "MR BEAST ALERTAS DE LIQUIDEZ" es una herramienta avanzada diseñada para proporcionar señales y alertas sobre la liquidez del mercado basándose en una serie de indicadores técnicos y análisis de tendencias. Ideal para traders que buscan oportunidades de trading en función de la dinámica de precios y los niveles de volatilidad, este indicador ofrece una visualización clara y detallada en la ventana del gráfico de MetaTrader. Características Principales: Canal ATR Adaptativo: Calcula
Weis Wave with Alert
Trade The Volume Waves Single Member P.C.
4.82 (22)
Rental/Lifetime Package Options and Privileges' Rent Monthly Six Months   Yearly/Lifetime Weis Wave with Speed with Alert+Speed Index x x x Manual  x x x Quick Set up Video x x x Blog x x x Lifetime Updates x x x Setup and Training Material x x Rectangle Break Alert Tool      x Discord Access Channel "The SI traders" x   How to trade info visit:    http://www.tradethevolumewaves.com   ** If you purchase please contact me to setup your  : training Room and  complete manual access.  This is
Apollo Secret Trend est un indicateur de tendance professionnel qui peut être utilisé pour trouver des tendances sur n'importe quelle paire et période. L'indicateur peut facilement devenir votre principal indicateur de trading que vous pouvez utiliser pour détecter les tendances du marché, quelle que soit la paire ou la période que vous préférez négocier. En utilisant un paramètre spécial dans l'indicateur, vous pouvez adapter les signaux à votre style de trading personnel. L'indicateur fournit
Un indicateur technique qui structure les graphiques et identifie les mouvements de prix cycliques. Peut fonctionner sur n'importe quel graphique. Plusieurs types de notifications. Il y a des flèches supplémentaires sur le graphique lui-même. Sans revenir sur l'histoire, fonctionne sur la fermeture de la bougie. TF recommandé à partir de M5 et plus. Facile à utiliser et à configurer les paramètres. Lorsque vous utilisez 2 indicateurs avec des paramètres différents, vous pouvez les utiliser sans
TPA True Price Action indicator reveals the true price action of the market makers through 100% non-repainting signals (except early signals mode) strictly at the close of a candle! TPA shows entries and re-entries, every time the bulls are definitely stronger than the bears and vice versa. Not to confuse with red/green candles. The shift of power gets confirmed at the earliest stage and is ONE exit strategy of several. There are available now two free parts of the TPA User Guide for our custom
Advanced Supply Demand
Bernhard Schweigert
4.91 (299)
Offre spéciale : 40 % de réduction La solution idéale pour les traders débutants comme experts ! Cet indicateur est un outil de trading unique, performant et abordable grâce à l’intégration de nombreuses fonctionnalités exclusives et d’une nouvelle formule. Cette mise à jour vous permet d’afficher des zones sur deux unités de temps. Vous pourrez ainsi visualiser non seulement une unité de temps supérieure, mais aussi l’unité de temps du graphique, ainsi que l’unité de temps supérieure : des z
Slayer Binary
Abdulkarim Karazon
5 (1)
Slayer Binary est un indicateur de flèche d’une bougie à options binaires. Cet indicateur ne s’adresse pas à ceux qui cherchent le Saint Graal, car c’est une approche irréaliste du trading en général. L’indicateur donne un taux de réussite stable, et s’il est utilisé pour gérer l’argent et un objectif quotidien, il sera encore plus fiable. L’indicateur est livré avec de nombreuses caractéristiques listées ci-dessous : CARACTÉRISTIQUES PAS DE REPEINT : L’indicateur ne repeint pas ses flèches en
Le système PRO Renko est un système de trading très précis spécialement conçu pour le trading de graphiques RENKO. Il s'agit d'un système universel qui peut être appliqué à divers instruments de négociation. Le système neutralise efficacement ce qu'on appelle le bruit du marché en vous donnant accès à des signaux d'inversion précis. L'indicateur est très facile à utiliser et n'a qu'un seul paramètre responsable de la génération du signal. Vous pouvez facilement adapter l'outil à n'importe que
Currency Strength Wizard est un indicateur très puissant qui vous offre une solution tout-en-un pour un trading réussi. L'indicateur calcule la puissance de telle ou telle paire de devises en utilisant les données de toutes les devises sur plusieurs périodes. Ces données sont représentées sous la forme d'un indice de devise facile à utiliser et de lignes électriques de devise que vous pouvez utiliser pour voir la puissance de telle ou telle devise. Tout ce dont vous avez besoin est d'attacher l'
Top Bottom Tracker est un indicateur basé sur des algorithmes sophistiqués qui analyse la tendance du marché et peut détecter les hauts et les bas de la tendance / Version MT5 . Le prix augmentera progressivement jusqu'à ce qu'il atteigne 500$. Prochain prix --> 99$ Caractéristiques Pas de repeinture Cet indicateur ne change pas ses valeurs lorsque de nouvelles données arrivent Paires de trading Toutes les paires de devises Période de temps Toutes les périodes de temps Paramètres de
Currency Strength Exotics
Bernhard Schweigert
4.88 (33)
ACTUELLEMENT 20% DE RÉDUCTION ! La meilleure solution pour tout débutant ou trader expert ! Cet indicateur est spécialisé pour montrer la force de la devise pour tous les symboles comme les paires exotiques, les matières premières, les indices ou les contrats à terme. C'est le premier de son genre, n'importe quel symbole peut être ajouté à la 9ème ligne pour montrer la force réelle de la devise de l'or, l'argent, le pétrole, DAX, US30, MXN, TRY, CNH etc. Il s'agit d'un outil de trading unique
No Repaint Bext
Andrey Kozak
1 (1)
No Repaint Bext est un système de trading complet. Il indique quand ouvrir et fermer une position ainsi que la direction de la transaction. Chaque fois qu'une flèche verte apparaît, vous devez ouvrir une position d'achat . Toutes les positions d'achat sont fermées lorsqu'une flèche rouge apparaît. De même, chaque fois qu'une flèche rouge apparaît, une position de vente est ouverte et sera fermée lorsque la flèche verte apparaît. Le trading se fait sur l' unité de temps M5 et peut être utilisé s
Are you looking for a simple and reliable indicator that can help you spot market swing points easily? Do you want clear buy and sell signals that work on any timeframe and any trading instrument? Buy Sell Signal Pro is designed to do exactly that. It helps traders identify important market turning points and understand the current market structure in a clear and easy way. This indicator detects Higher Highs (HH), Higher Lows (HL), Lower Highs (LH), and Lower Lows (LL) so you can quickly see wh
TrendLine PRO MT4
Evgenii Aksenov
4.83 (167)
L'indicateur   Trend Line PRO   est une stratégie de trading indépendante. Il montre le changement de tendance, le point d'entrée de la transaction, ainsi que le calcul automatique de trois niveaux de protection Take Profit et Stop Loss. Trend Line PRO   est parfait pour tous les symboles Meta Trader : devises, métaux, crypto-monnaies, actions et indices. L'indicateur est utilisé dans le trading sur des comptes réels, ce qui confirme la fiabilité de la stratégie. Pour le moment, l'indicateur
Si vous achetez cet indicateur, vous recevrez mon Gestionnaire de Trading Professionnel   + EA  GRATUITEMENT. Tout d'abord, il convient de souligner que ce système de trading est un indicateur non repeint, non redessiné et non retardé, ce qui le rend idéal pour le trading manuel et automatisé. Cours en ligne, manuel et téléchargement de préréglages. Le "Système de Trading Smart Trend MT5" est une solution de trading complète conçue pour les traders débutants et expérimentés. Il combine plus de
Trend indicator AI
Ramil Minniakhmetov
4.49 (84)
L'indicateur Trend Ai est un excellent outil qui améliorera l'analyse du marché d'un trader en combinant l'identification des tendances avec des points d'entrée exploitables et des alertes d'inversion. Cet indicateur permet aux utilisateurs de naviguer dans les complexités du marché forex avec confiance et précision Au-delà des signaux primaires, l'indicateur Trend Ai identifie les points d'entrée secondaires qui surviennent lors des retraits ou des retracements, permettant aux traders de capit
Plus de l'auteur
Volume Ticks ResSup
Sergey Zhukov
4.57 (7)
The market price is moved by the market makers with large amounts of equity. The only way to understand intentions of big players is to track their activity by concentration of volumes on one level or another. Volume Ticks ResSup draws a level with the maximum concentration of a tick volume since the beginning of a day. In most cases, such level is an actual support or resistance level. Parameters ColorLevelSupport - support line color; ColorLevelResistance - resistance line color; BarsDayCount
Hummingbird
Sergey Zhukov
1.5 (2)
The Expert Advisor is based on the momentum of the price rate of change. When the speed of the price begins to increase sharply, the EA opens an order in the direction of its movement. Rate of Change is defined as the distance of StepPrice ticks that the price has moved for the period of TimePrice seconds. In contrast to the standard algorithm, virtual levels are modified not only after the TimePrice time, but also after the change of direction of the price movement—momentum. The built-in filter
The main rule of the profitable trading is opening trades in the direction of a trend. You can define the current trend using fractal analysis. Important Levels ResSup displays important price levels on the chart. The breakthrough of those levels shows the price direction. The data panel allows you to track the current trends on all timeframes. The current timeframe's important level values are shown in the comments. The indicator can be useful for traders working by levels. It can also be a par
The ProfileVolumesMarket indicator calculates tick volume on each price level in a selected range. Volume is vital when determining strength and therefore significance of price levels. The calculation range is set by a trader by means of moving two vertical lines. Thus the indicator allows to track important levels on different steps of a symbol price formation. A histogram of volume profile can be displayed on the chart (or removed from the chart) if you press "ON" ("OFF") button. When you chan
The indicator is created for professional trading by Fibonacci levels. AutoFiboLevels plots Fibonacci retracement and extension levels on impulse and corrective wave. The indicator unambiguously interprets a market situation. Points of extremum for level plotting are calculated using fractal analysis. A trader can independently set retracement and extension levels and calculation time frame adjusting the indicator for various strategies. Parameters: WorkTF - time frame for indicator calculation
The indicator calculation is based on the analysis of the price characteristics of bars and is adjusted by the ATR value. The degree of the ATR influence is determined by the ratio. The color scheme of the indicator depends on the direction of the current trend. A change in the trend is displayed by an arrow and a corresponding message. Depending on the strategy chosen by the trader, this indicator can be used to generate market entry signals, to place stop loss or close trades, and can also be
OnlyTrend
Sergey Zhukov
The indicator has been developed as a trading system component. It has proven to be an efficient technical tool when following a trend. The indicator shows the most suitable market entry points. It can be especially useful to those who add to positions after corrections in the trend direction. When a signal appears, the indicator generates an alert. The settings contain the depth of the indicator display history and ability to disable alerts. The signal is generated upon closing of the current
The main rule of the profitable trading is opening trades in the direction of a trend. You can define the current trend using fractal analysis. The Important Zone ResSup indicator displays important price support and resistance levels on the chart. The breakthrough or bounce from those levels shows further price direction. The data panel allows you to track the current trends on all timeframes. The current timeframe's important level values are shown in the comments. The indicator can be useful
The Volume Impuls VSA indicator paints a histogram of volumes tading into account the bar direction and comparing it with the volume of previous bars. The volume of the rising and falling trend are painted respectively in blue and in red. If the current volume exceeds the volumes of the opposite direction, an impulse is formed. Accordingly, the impulse of the upward and downward trends are painted in blue and orange. Also the indicator displays three levels, based on which you can easily compare
Indicator based trading according to the price analysis of bars, the most popular among traders. The indicators calculated based on larger periods are used for identification of a stable trend on the market, and the ones calculated based on smaller periods are used for entering the market after a correction. The oscillators with overbought and oversold levels have a special place in indicator-based trading. The values of such indicators are subjected to wave structure - the higher waves (chart t
Spring
Sergey Zhukov
This multifunctional Expert Advisor has been created in the form of a designer and is suitable both automatic and manual trading. Its main advantage is the ability to select and adjust the strategy for the current market conditions. To recover from the drawdown, the EA fully utilizes the feature of the currency market - the price cannot remain in a narrow channel for a long time. A breakout of the flat in one direction or another is inevitable. So, by placing orders in the breakout direction, yo
Stochastic is the indicator used by traders the most. This version allows to extract the maximum amount of information without hassle of constantly switching between the timeframes and, thereby, greatly simplifies working with it. This is a standard Stochastic oscillator provided with an info panel displaying the current relative position of %K and %D lines on all timeframes. The info panel is intuitive and easy to use. The oscillator is especially useful in scalping techniques when you need to
ADX is one of the indicators most commonly used by traders. This version allows to extract the maximum amount of information without hassle of constantly switching between the timeframes and, thereby, greatly simplifies working with it. This is a standard ADX indicator provided with an info panel displaying the current relative position of -DM and +DM lines on all timeframes. Blue circle - uptrend. Red circle - downtrend. Yellow circle - no trend. Blue arrow - (+DM) > (-DM); Red arrow - (-DM) >
Filtrer:
Aucun avis
Répondre à l'avis