DYJ StochasticSignalSource
- Indikatoren
-
Daying Cao
 Hallo! Ich bin ein Software-Ingenieur hat sich seit vielen Jahren entwickelt.Haben ihre eigenen einzigartigen Handelssystem, hat eine Fülle von EA Trading-Erfahrung. Die Hauptwährung ist EUR / USD, GBP / USD. USD / JPY, AUD / USD, USD / CAD, Gold, EUR / NZD Cross Currency. EA läuft, um Trends zu
 - Version: 2.6
- Aktualisiert: 26 Juni 2024
- Aktivierungen: 5
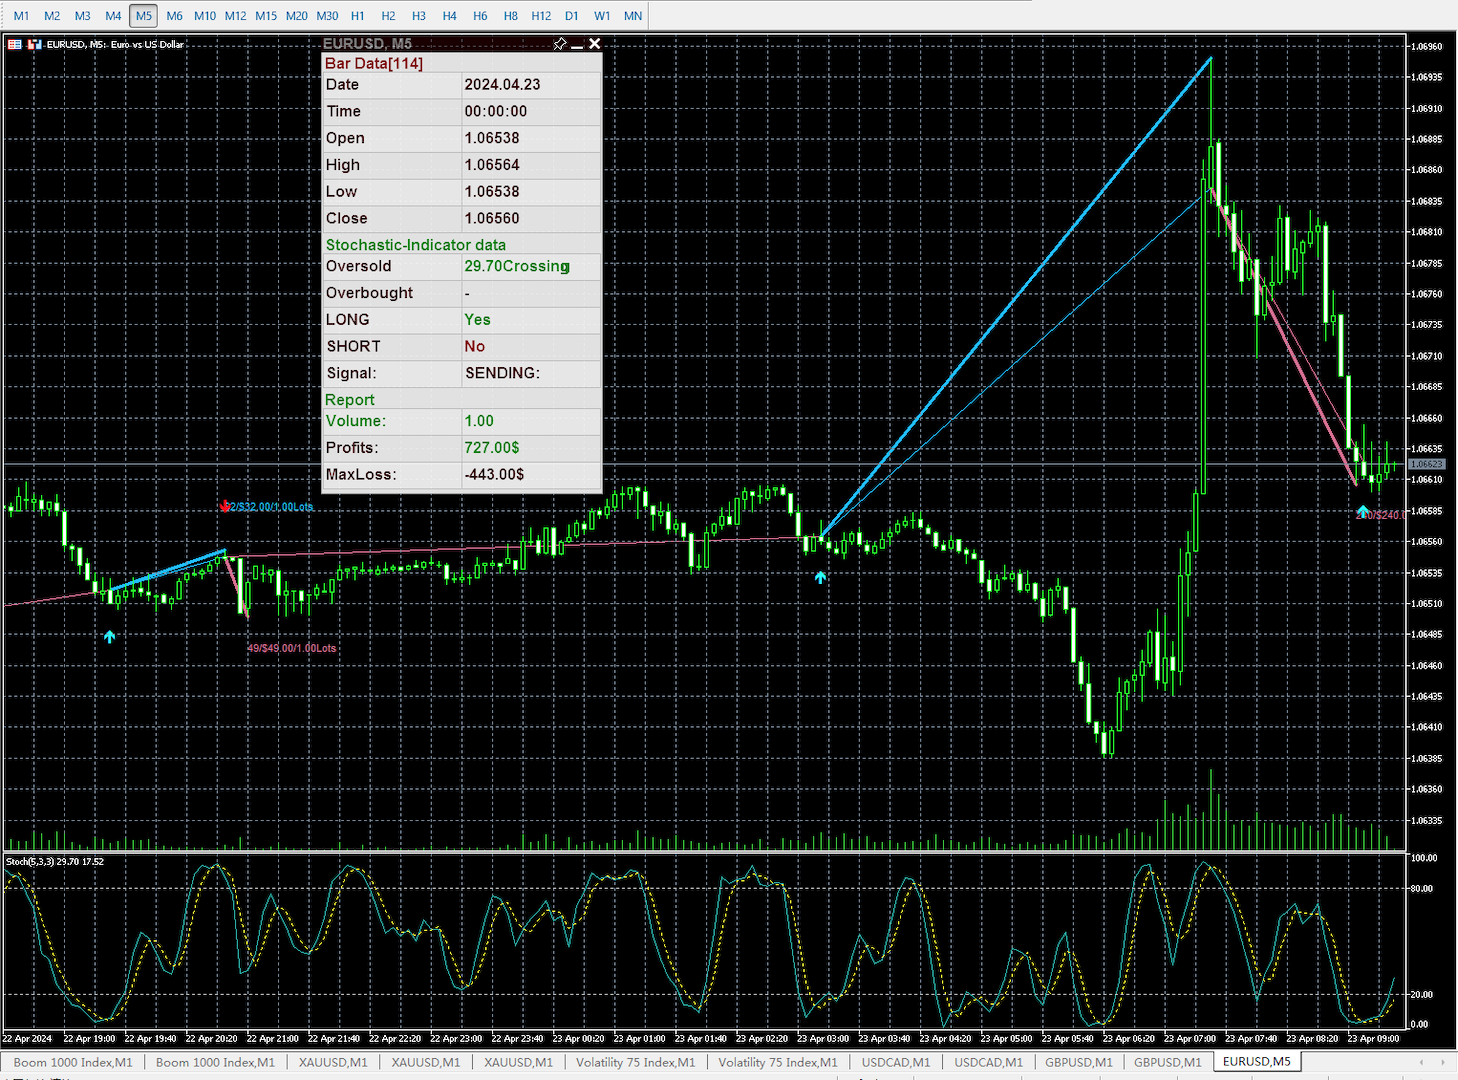
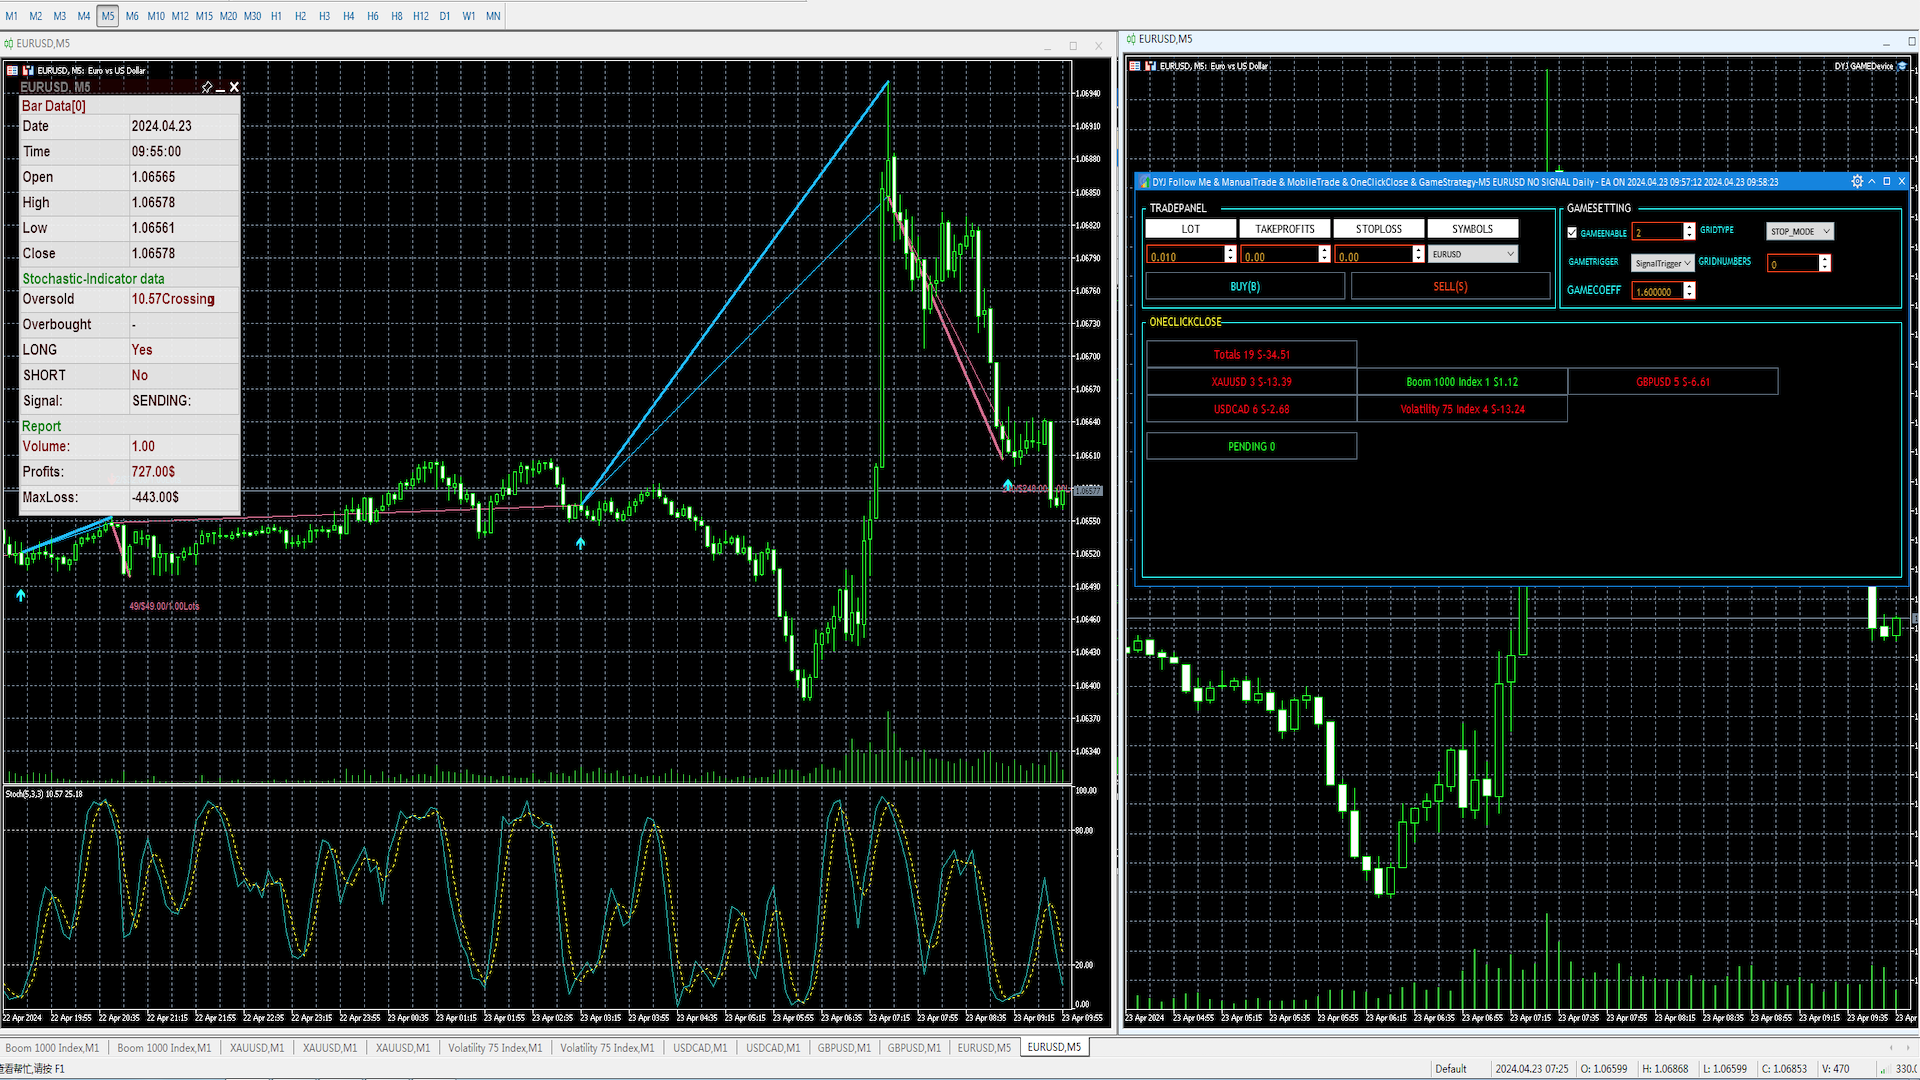
Die DYJ StochasticSignalSource wird in zwei Zeilen angezeigt. Die Hauptlinie wird %K genannt. Die zweite Linie, genannt %D, ist ein gleitender Durchschnitt von %K. Die %K-Linie wird normalerweise als durchgezogene Linie und die %D-Linie als gepunktete Linie angezeigt.
Es gibt mehrere Möglichkeiten, einen stochastischen Oszillator zu interpretieren. 4 beliebte Methoden sind:
- Kaufen, wenn der Oszillator (entweder %K oder %D) unter einen bestimmten Wert (z. B. 20) fällt. Verkaufen, wenn der Oszillator über ein bestimmtes Niveau ansteigt (z. B. 80).
- Wenn die K- und die D-Linie unter (z. B. 20) liegen, kaufen Sie, wenn die %K-Linie über die %D-Linie ansteigt. Wenn die K- und die D-Linie über dem Wert liegen (z. B. 80), verkaufen Sie, wenn die %K-Linie unter die %D-Linie fällt.
- Kaufen, wenn die %K-Linie über die %D-Linie steigt. verkaufen, wenn die %K-Linie unter die %D-Linie fällt.
- Kaufen, wenn der Oszillator (entweder %K oder %D) unter ein bestimmtes Niveau fällt (z. B. 20) und dann über dieses Niveau ansteigt. Verkaufen Sie, wenn der Oszillator über ein bestimmtes Niveau steigt (z. B. 80) und dann unter dieses Niveau fällt.
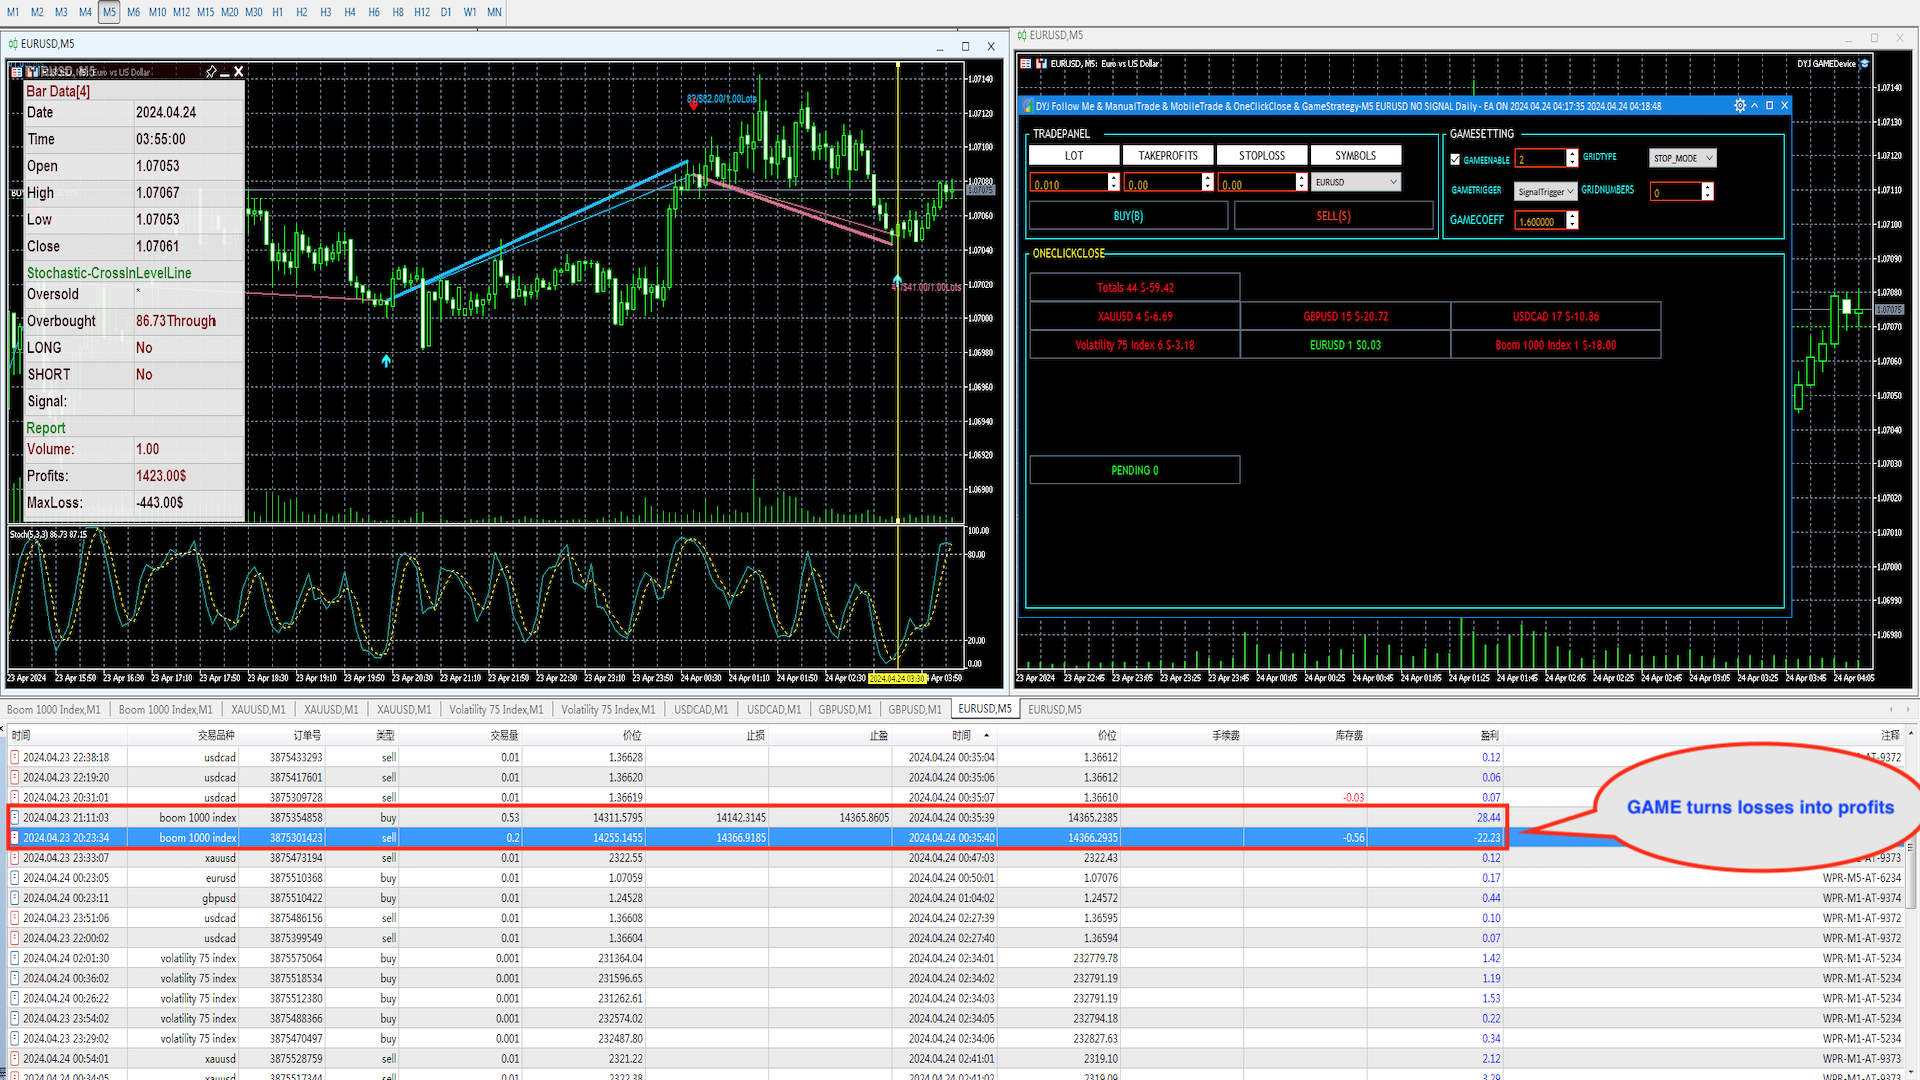
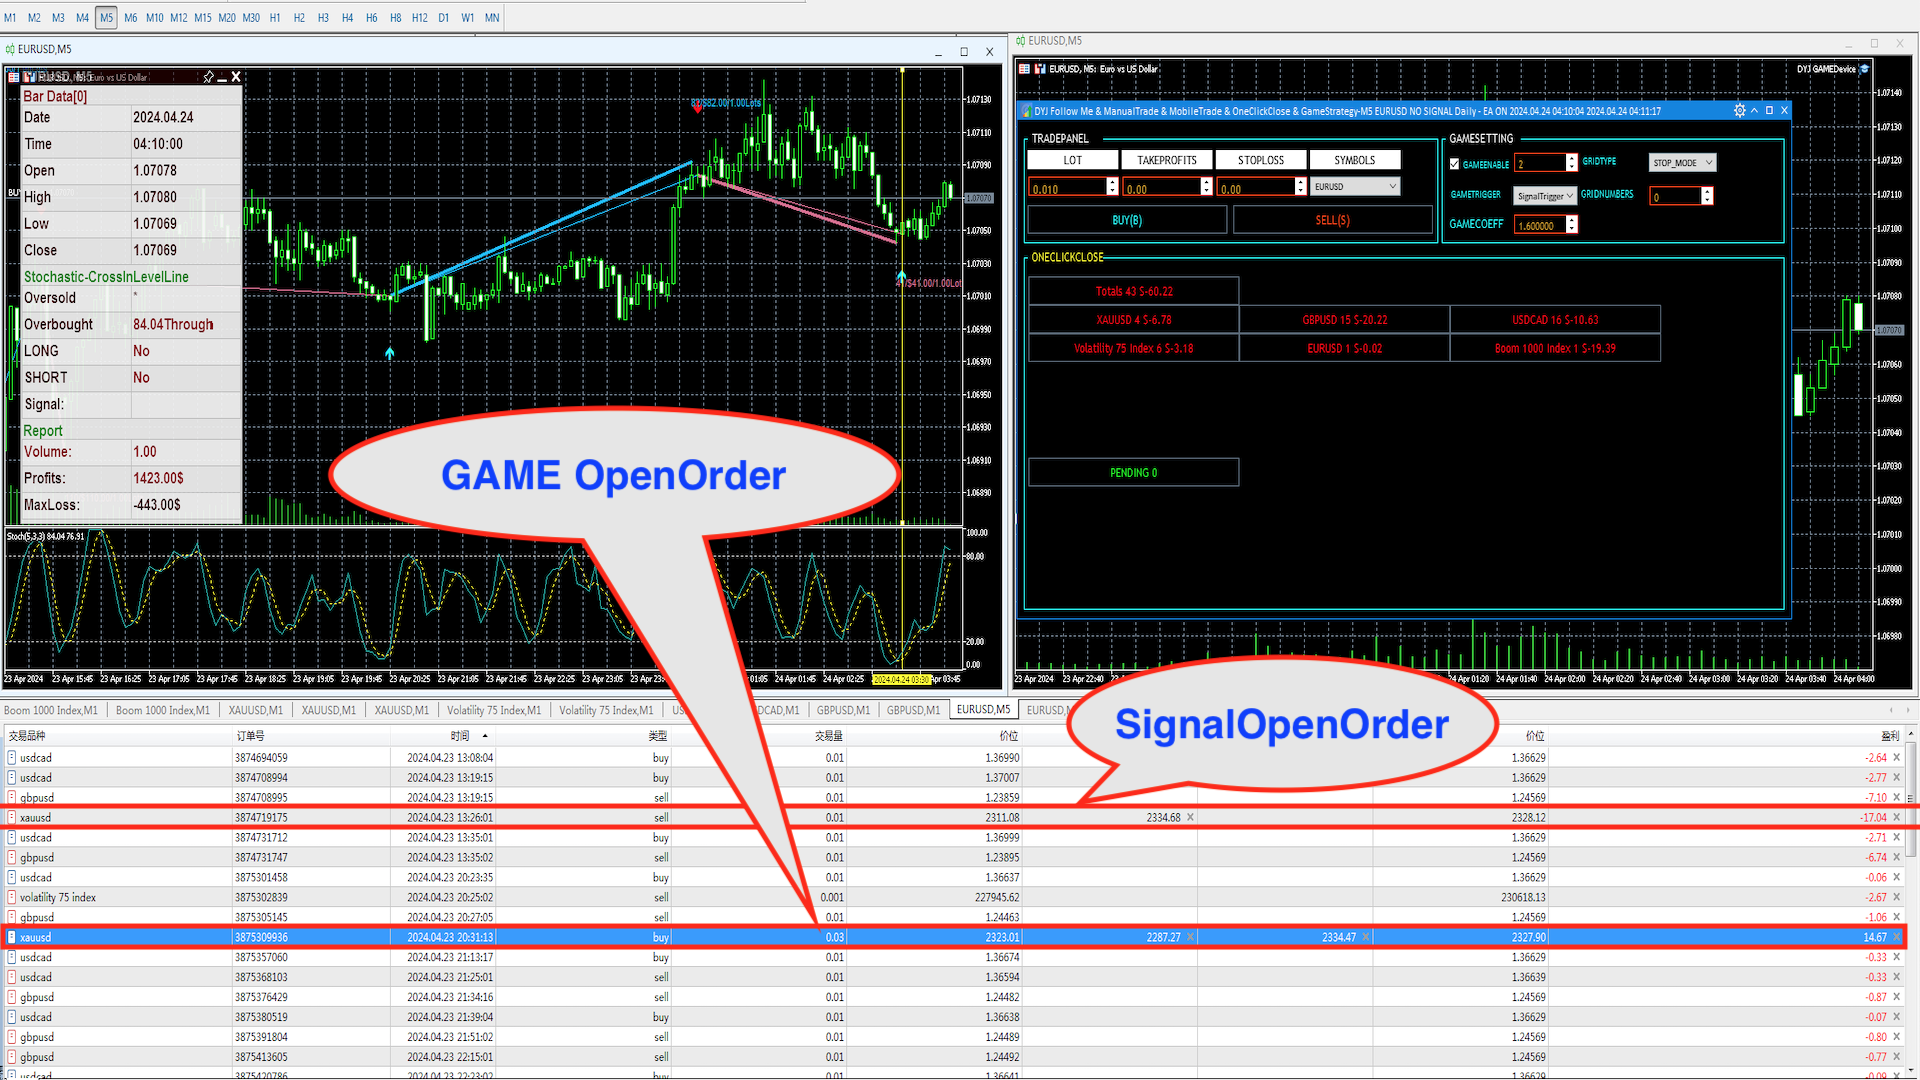
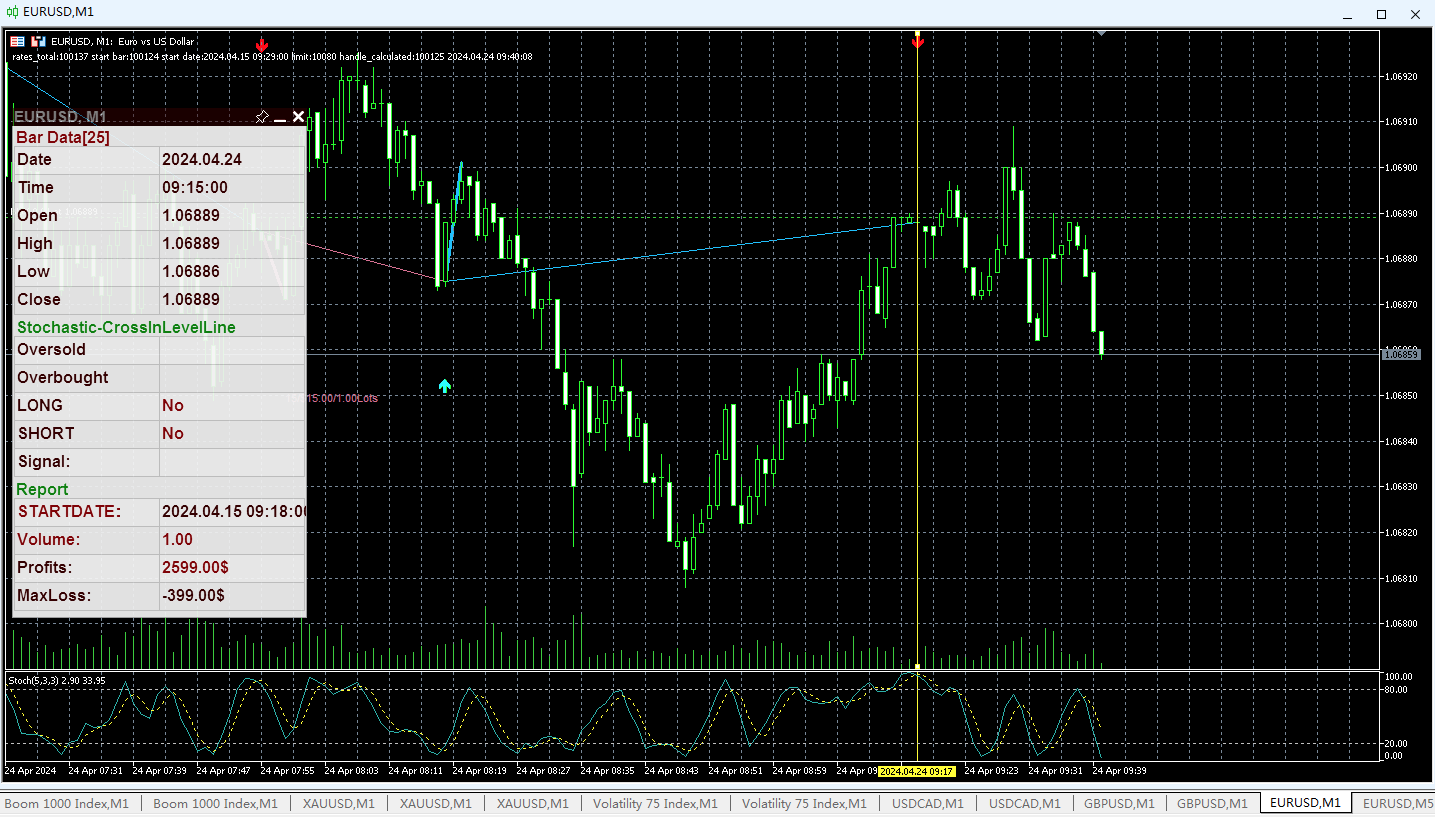
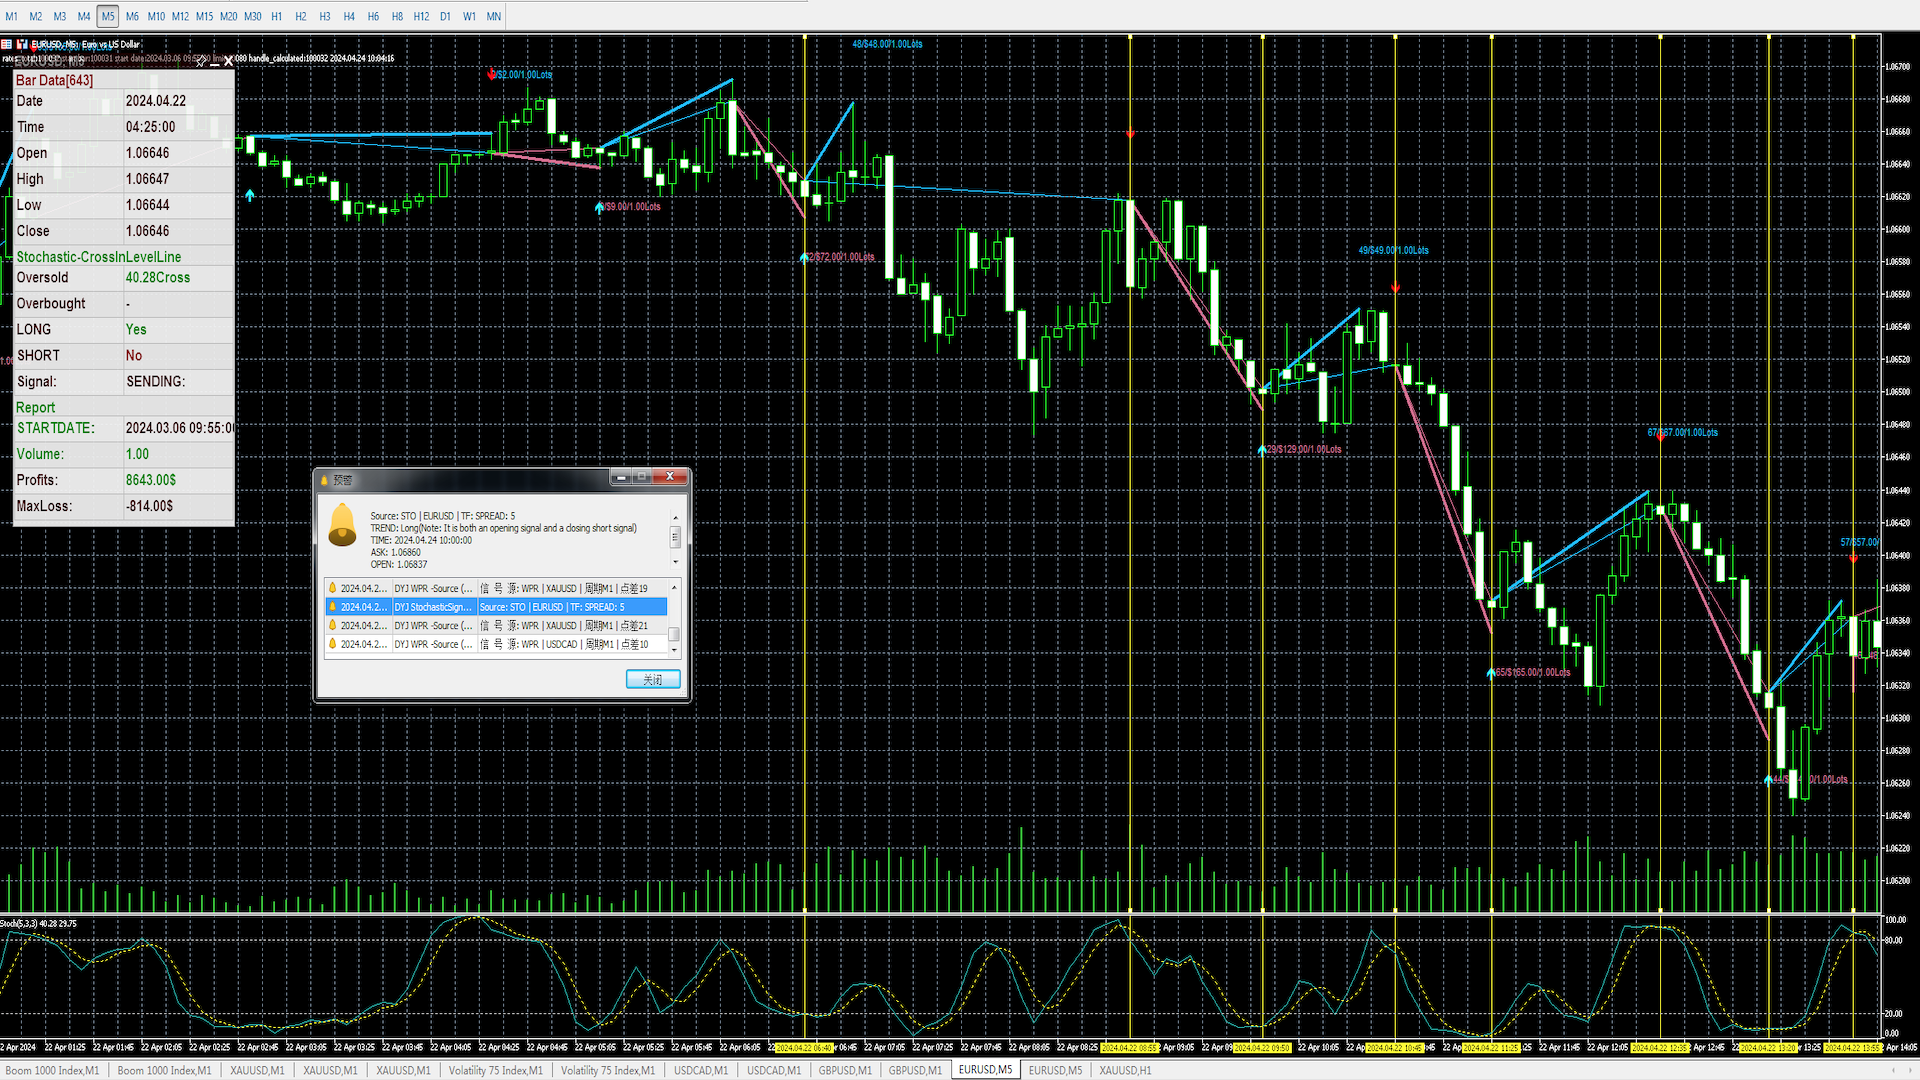
Sie können dasmathematische Modell des DYJ Trader-Indikators verwenden, um die realen Eröffnungs- und Schlusspositionen des Indikators anzuzeigen und den Gesamtgewinn und den maximalen gleitenden Verlust zu berechnen!
Darüber hinaus markiert der Stochastik-Oszillator DYJ StochasticSignalSource auch den Einstiegs- und Ausstiegspunkt mit farbigen Pfeilen und zählt auch den Gesamtgewinn und den maximalen gleitenden Verlust in Echtzeit auf der Grundlage dieser Positionen, die wichtige Daten für die Beurteilung der Handelswahrscheinlichkeit sind.
Sie verwenden die folgende Software DYJ GAMEDevice, um die Positionseröffnungs- und -schließungssignale von der DYJ StochasticSignalSource, der Signalquelle des stochastischen Oszillators, zu empfangen, um die automatische Positionseröffnung und -schließung zu realisieren. DYJ GAMEDevice kann Verluste in Gewinne verwandeln
Eingabe-Parameter
[General]
- InpUseLanguage = Englisch/Chinesisch
- signal_source_name = "STOCHASTIC"
[Indicator]
- KPeriode=5 -- KPeriode K
- DZeitraum=3 -- DZeitraum D
- slowing=3 -- Verlangsamung
- ma_method = MODE_SMA -- MA-Methode
- price_field=STO_LOWHIGH -- Preis-Feld
- InpOversoldArea = 20 -- stoch überverkaufte Zone
- InpOverboughtArea = 80 -- stoch überkaufte Zone
- InpSimulatedVolume = 1 -- Lose
[EstimateSystem]
- InpOnlyOppositeClosedLine = false
- InpIsDisplayChartText = wahr
- InpIsDisplayProfitsLine = wahr
- MaxProfitsTextHoch = 40
- MaxProfitsTextLow = 20
- UpLineClr = DeepSkyBlue // Farbe der Pfeile nach oben
- DnLineClr = PaleVioletRed // Farbe des Pfeils nach unten
- alertsMessage = wahr
- alertsSound = wahr
- alertsEmail = falsch
- alertsPush = falsch
- InpIsMultipleLinesTextForAlertsMessage = true
- InpStartDate = "19700101" // InpStartDate:Wenn es 19700101 ist, stellt es das Mindestdatum dar.
- InpEndDate = "19700101" // InpEndDate:Bei 19700101 handelt es sich um ein unendliches Datum.
- InpWindowsXSize = 1030
- InpWindowsYSize = 450