B4S Institutional Round Number Prices
- Indikatoren
- Version: 2.0
- Aktualisiert: 4 Juni 2024
- Aktivierungen: 5

Kurzbeschreibung:
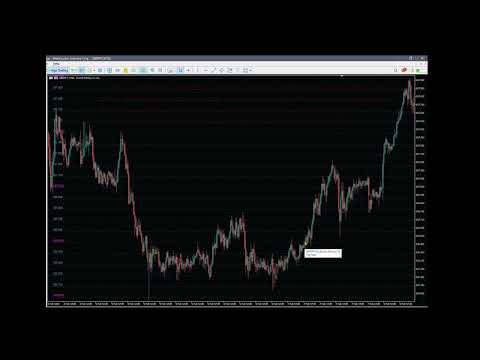
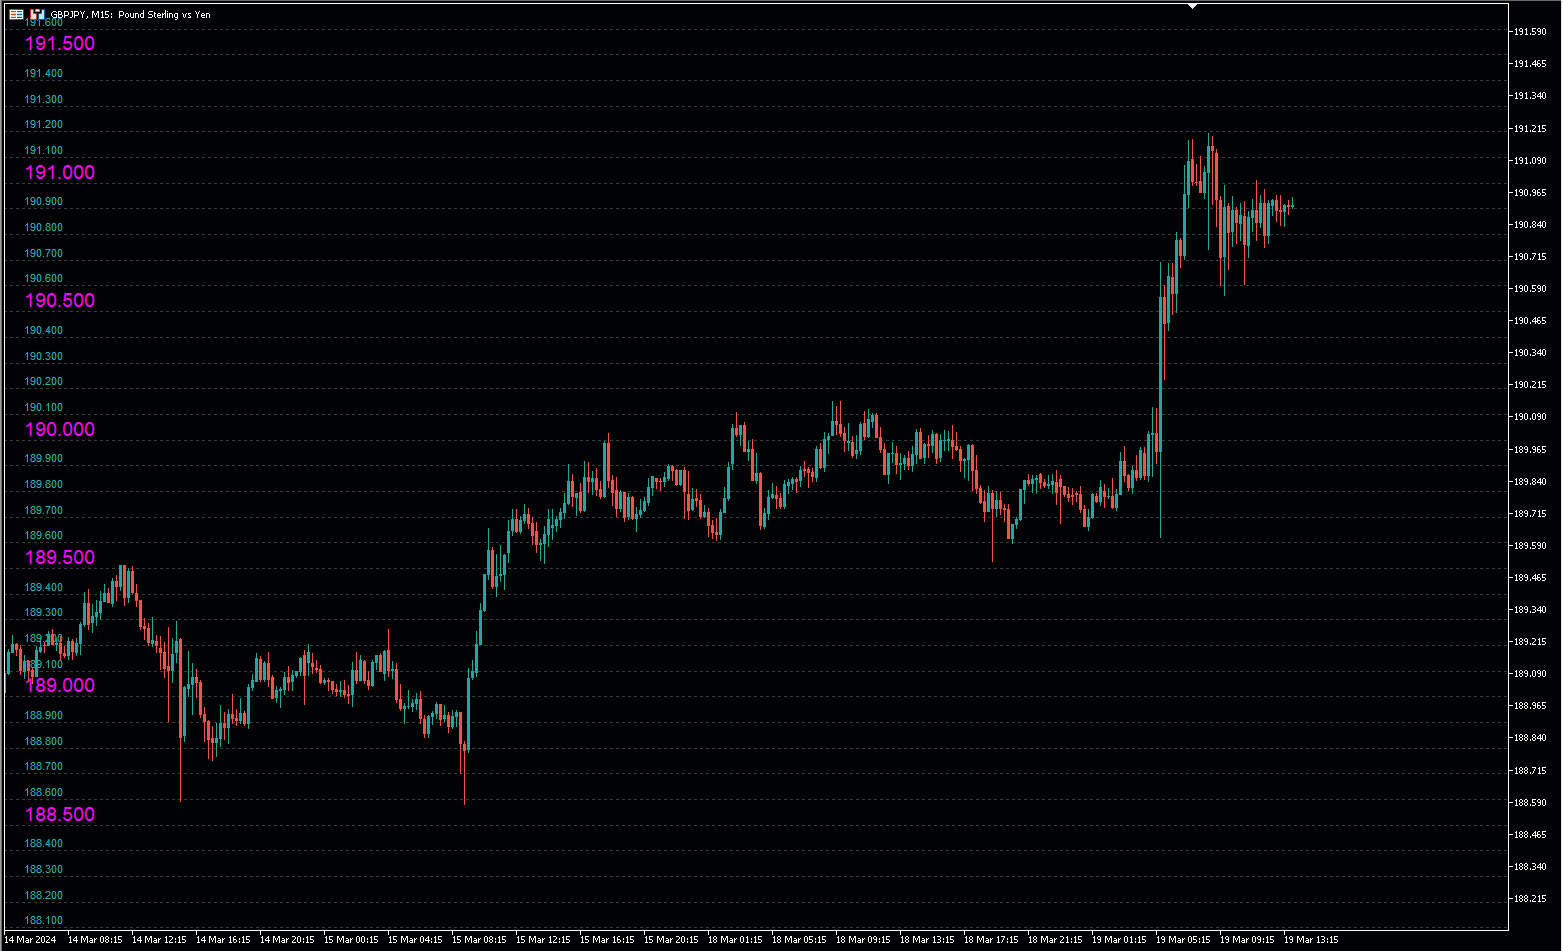
Der Indikator B4S_Institutional_Round_Number_Prices identifiziert und markiert wichtige Preisniveaus, die als Round Number Prices oder institutionelle Preisniveaus bezeichnet werden und für ihre psychologische Bedeutung bekannt sind. Diese Niveaus beeinflussen häufig die institutionelle Aktivität, ziehen die Aufmerksamkeit auf sich und lösen bedeutende Marktbewegungen aus.
Merkmale:
- Identifizierung von Rundkursen: Der Indikator zeichnet sich durch seine Fähigkeit aus, runde Kurse zu erkennen, die Ihnen wichtige Einblicke in potenzielle Marktbewegungen geben.
- Dauerhafte Benutzereinstellungen: Genießen Sie den Komfort, Ihre Präferenzen nur einmal einzustellen! Die von Ihnen gewählten Einstellungen werden automatisch gespeichert und bleiben auch bei zukünftigen Neustarts erhalten, wodurch Ihr Handelserlebnis optimiert wird.
- Flexible Einstellungsanpassung: Sie möchten Änderungen vornehmen? Aktivieren Sie den einfachen booleschen Schalter im Eingabebereich, um die gespeicherten Einstellungen mühelos anzupassen.
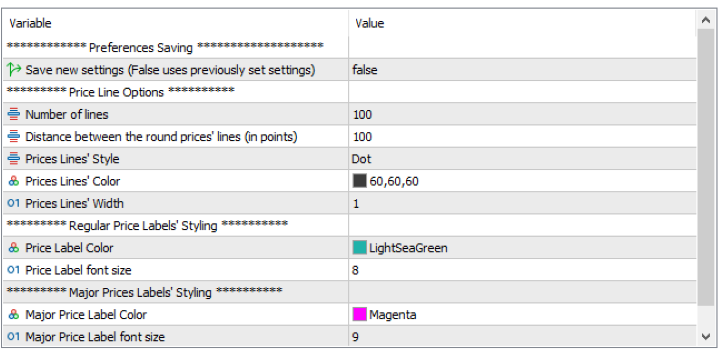
Einstellungen:
- Preiszeilen-Optionen:
- Anzahl der Linien
- Abstand zwischen den Linien (in Punkten)
- Stil der Preislinien
- Farbe der Preislinien
- Breite der Preislinien
- Optionen zur Gestaltung von Preisschildern:
- Farbe des Preisschildes
- Schriftgröße der Preisetiketten
- Optionen für Hauptpreisetiketten:
- Farbe des Hauptpreisetiketts
- Schriftgröße des Hauptpreisetiketts
Bedeutung der institutionellen Preisniveaus
1. strategische Handelszonen:
- Ausführungsplanung: Große Institutionen planen ihre Geschäfte oft strategisch um wichtige Kursniveaus herum. Institutionelle Kursniveaus dienen als Referenzpunkte, an denen diese Einrichtungen wichtige Kauf- oder Verkaufsaufträge ausführen.
- Geringere Kursverluste: Der Handel um institutionelle Kursniveaus ermöglicht es großen Instituten, Slippage zu minimieren, indem sie Positionen zu Kursen eingehen oder aufgeben, die im breiteren Marktkontext als optimal angesehen werden.
2. konzentrierte Liquidität:
- Erhöhte Liquidität: Institutionelle Kursniveaus sind Magneten für Liquidität. Große Institute zielen auf diese Niveaus ab, um konzentrierte Liquiditätszonen anzuzapfen, was die Ausführung umfangreicher Aufträge erleichtert, ohne übermäßige Auswirkungen auf den Markt zu verursachen.
- Geringere Marktauswirkungen: Der Handel auf institutionellen Niveaus hilft großen Marktteilnehmern zu vermeiden, den Markt mit ihren umfangreichen Geschäften zu stören. Indem sie ihre Aktivitäten auf diese Schlüsselebenen konzentrieren, können Institutionen die Auswirkungen ihrer Geschäfte auf die Kursbewegungen verringern.
3) Smart Money-Ausrichtung:
- Smart Money-Referenz: Institutionelle Händler werden auf dem Markt oft als "intelligentes Geld" betrachtet. Das Erkennen und Verfolgen ihrer Handlungen auf institutionellen Ebenen kann Privatanlegern Einblicke in mögliche zukünftige Marktrichtungen geben.
- Angleichung von Strategien: Händler können ihre Strategien an den institutionellen Aktivitäten ausrichten und die Bedeutung der institutionellen Kursniveaus als Wegweiser für die Bewegungen des intelligenten Geldes erkennen.
- Trend-Bestätigung: Institutionelle Kursniveaus können als Bestätigungspunkte für Trends dienen. Ausbrüche oder Abpraller von diesen Niveaus können auf die Einleitung oder Fortsetzung eines Trends hindeuten.
4 Analyse des Auftragsflusses:
- Auftragsakkumulation: Große Institutionen können institutionelle Kursniveaus nutzen, um Positionen zu akkumulieren oder aufzuteilen. Die Überwachung des Auftragsflusses um diese Niveaus herum liefert wertvolle Erkenntnisse über die Absichten der Institutionen.
- Algorithmische Handelsstrategien: Institutionelle Händler setzen häufig algorithmische Strategien ein, die darauf ausgerichtet sind, Preisniveaus mit historischer Bedeutung auszunutzen. Der Indikator kann dabei helfen, diese algorithmischen Strategien zu erkennen und auf sie abzustimmen.
5. marktbeeinflussung und Psychologie:
- Marktwahrnehmung: Große Institutionen haben die Möglichkeit, die Marktwahrnehmung zu beeinflussen. Indem sie Transaktionen auf institutioneller Ebene durchführen, tragen sie dazu bei, die allgemeine Marktstimmung zu beeinflussen.
- Psychologische Auswirkungen: Der institutionelle Handel auf wichtigen Ebenen kann einen psychologischen Einfluss auf den breiteren Markt haben. Händler sehen in den institutionellen Aktivitäten oft ein Signal für eine mögliche Marktrichtung.
6. risikomanagement:
- Informierte Risikoentscheidungen: Die Institute nutzen die institutionellen Kurse, um fundierte Risikomanagemententscheidungen zu treffen. Diese Niveaus dienen als Referenzpunkte für die Festlegung von Stop-Loss-Aufträgen, die Verwaltung von Positionsgrößen und die Bewertung des Gesamtrisikos.
- Bewertung der Volatilität: Große Institute können ihre Risikoparameter auf der Grundlage der um die institutionellen Niveaus beobachteten Volatilität anpassen. Das Erkennen dieser Niveaus hilft bei der Antizipation und Steuerung der Marktvolatilität.
7 Verbessertes Timing und Entscheidungsfindung:
- Präzises Timing: Die Fähigkeit des Indikators, runde Kurse zu identifizieren, erhöht die Präzision des Timings. Händler können ihre Strategien an diesen Niveaus ausrichten und zum richtigen Zeitpunkt in Positionen ein- oder aussteigen.
- Strategischer Ein- und Ausstieg: Indem Sie institutionelle Kursniveaus in Ihre Analyse einbeziehen, können Sie Ihre Ein- und Ausstiegspunkte strategisch planen. Dies führt zu fundierteren Handelsentscheidungen und einem besseren Risikomanagement.
Zusammenfassung
Zusammenfassend lässt sich sagen, dass das B4S Institutional Round Number Prices Grid ein wertvolles Hilfsmittel für Trader ist, da es Einblicke in das Verhalten großer Institutionen bietet. Indem sie die Bedeutung institutioneller Kursniveaus als Referenzpunkte verstehen, können Händler ihre Strategien ausrichten, fundierte Entscheidungen treffen und potenziell von den Bewegungen profitieren, die von großen Marktteilnehmern orchestriert werden.
Verwandte Themen
1. B4S
2. #Psychologische Niveaus
3) #Marktstimmungsanalyse
4. #Smart Money Trading
5. #Preis-Aktions-Strategien
6. #Algorithmische Handelssignale
7. #Liquiditätszonen Identifikation
8. #Handel um wichtige Niveaus
9. institutionelle Orderflow-Analyse
10. #Institutionelle Preisniveau-Analyse
11. #Preisreaktionen auf Schlüssel-Levels
12. #Handelseinstiegs- und -ausstiegspunkte
13. #Marktmanipulationserkennung
14. #Markt-Mikrostruktur-Analyse
15. #Behavioral Finance im Handel
16. #Marktpsychologische Einblicke
17. #Risikomanagement auf institutioneller Ebene