B4S Institutional Round Number Prices

Brief Description:

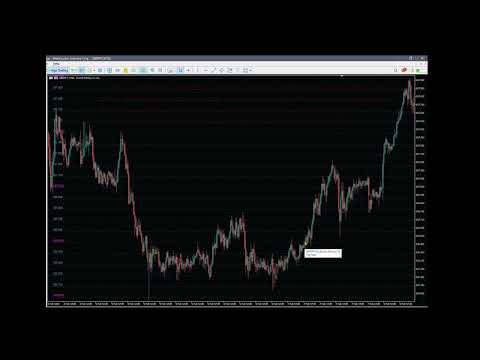
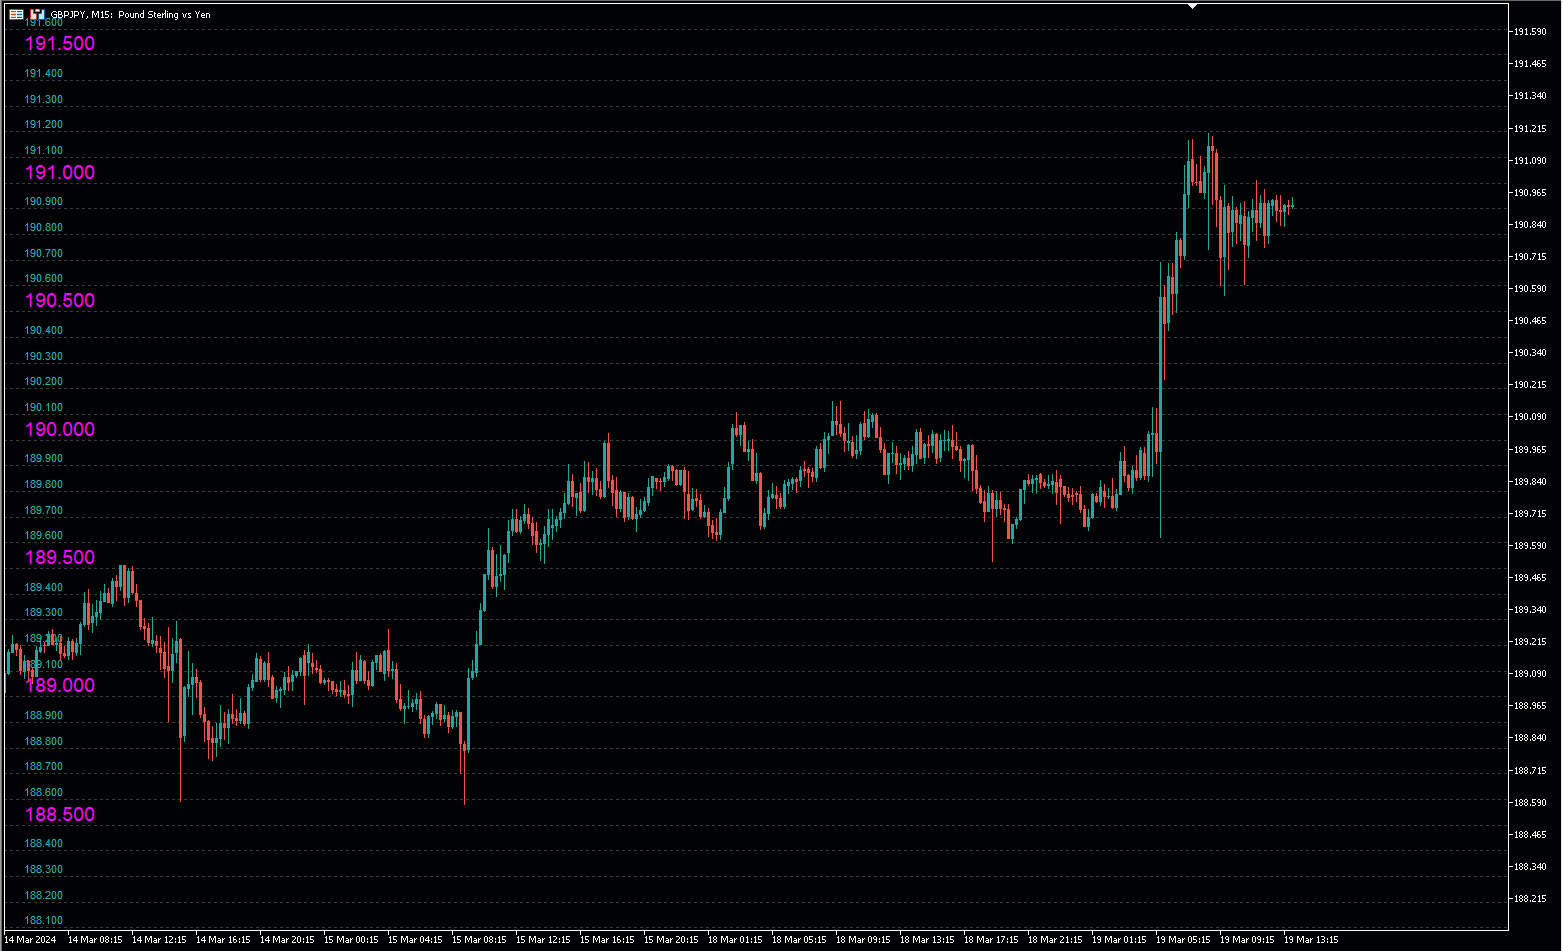
The B4S_Institutional_Round_Number_Prices indicator identifies and marks key price levels, known as round number prices or institutional price levels, renowned for their psychological significance. These levels often influence institutional activity, attracting attention and triggering significant market moves.


Features:

  • Round Number Price Identification: The indicator excels at identifying round number prices, providing you with crucial insights into potential market movements.
  • Persisting User Settings: Enjoy the convenience of setting your preferences just once! Your chosen settings are automatically saved and persist through future restarts, streamlining your trading experience.
  • Flexible Settings Adjustment: Need to make changes? Activate the simple Boolean toggle in the input section to adjust saved settings effortlessly.
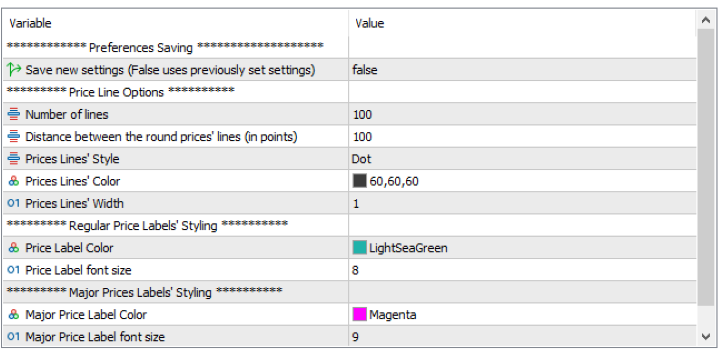
 

Settings:

  1. Price Line Options:
    • Number of Lines
    • Distance Between Lines (in points)
    • Price Lines' Style
    • Price Lines' Color
    • Price Lines' Width
  2. Price Label Styling Options:
    • Price Label Color
    • Price Label Font Size
  3. Major Prices Labels' Options:
    • Major Price Label Color
    • Major Price Label Font Size


Importance of Institutional Price Levels

1.      Strategic Trading Zones:

  • Execution Planning: Large institutions often strategically plan their trades around key price levels. Institutional price levels act as reference points where these entities execute significant buy or sell orders.
  • Reduced Slippage: Trading around institutional levels allows large institutions to minimize slippage by entering or exiting positions at prices that are considered optimal within the broader market context.

2.      Liquidity Concentration:

  • Increased Liquidity: Institutional price levels are magnets for liquidity. Large institutions target these levels to tap into concentrated liquidity zones, facilitating the execution of substantial orders without causing excessive market impact.
  • Reduced Market Impact: Trading at institutional levels helps large players avoid disrupting the market with their sizable trades. By concentrating their activity at these key levels, institutions can reduce the impact of their trades on price movements.

3.      Smart Money Alignment:

  • Smart Money Reference: Institutional traders are often considered "smart money" in the market. Recognizing and following their actions around institutional levels can provide retail traders with insights into potential future market directions.
  • Alignment of Strategies: Traders may align their strategies with institutional activity, recognizing the importance of institutional price levels as guideposts for smart money movements.
  • Trend Confirmation: Institutional price levels can act as confirmation points for trends. Breakouts or bounces from these levels may indicate the initiation or continuation of a trend.

4.      Order Flow Analysis:

  • Order Accumulation: Large institutions may use institutional levels to accumulate or distribute positions. Monitoring the order flow around these levels provides valuable insights into institutional intentions.
  • Algorithmic Trading Strategies: Institutional traders often employ algorithmic strategies that are designed to take advantage of price levels with historical significance. The indicator can aid in identifying and aligning with these algorithmic strategies.

5.      Market Influence and Psychology:

  • Market Perception: Large institutions have the ability to influence market perception. By transacting around institutional levels, these entities contribute to shaping the overall market sentiment.
  • Psychological Impact: Institutional trading at key levels can have a psychological impact on the broader market. Traders often look to institutional activity as a signal for potential market direction.

6.      Risk Management:

  • Informed Risk Decisions: Institutions use institutional levels to make informed risk management decisions. These levels serve as reference points for setting stop-loss orders, managing position sizes, and assessing overall risk exposure.
  • Volatility Assessment: Large institutions may adjust their risk parameters based on the volatility observed around institutional levels. Recognizing these levels aids in anticipating and managing market volatility.

7.      Enhanced Timing and Decision Making:

  • Precision Timing: The indicator's ability to identify round number prices enhances your timing precision. Traders can align their strategies with these levels, entering or exiting positions at opportune moments.
  • Strategic Entry and Exit: By incorporating institutional price levels into your analysis, you can strategically plan your entry and exit points. This leads to more informed trade decisions and improved risk management.


Summary

In summary, the B4S Institutional Round Number Prices Grid becomes a valuable asset for traders by providing insights into the behavior of large institutions. By understanding the importance of institutional price levels as reference points, traders can align their strategies, make informed decisions, and potentially benefit from the movements orchestrated by major market players.


Related Topics

1.      B4S

2.      #Psychological Levels

3.      #Market Sentiment Analysis

4.      #Smart Money Trading

5.      #Price Action Strategies

6.      #Algorithmic Trading Signals

7.      #Liquidity Zones Identification

8.      #Trading Around Key Levels

9.      #Institutional Order Flow Analysis

10.  #Institutional Price Levels Analysis

11.  #Price Reactions at Key Levels

12.  #Trade Entry and Exit Points

13.  #Market Manipulation Detection

14.  #Market Microstructure Analysis

15.  #Behavioral Finance in Trading

16.  #Market Psychology Insights

17.  #Risk Management at Institutional Levels


Produtos recomendados
Um padrão de cabeça e ombros é uma formação de gráfico que se assemelha a uma linha de base com três picos, os dois externos têm altura próxima e o meio é o mais alto. Ele prevê uma reversão de tendência de alta para baixa e acredita-se ser um dos padrões de reversão de tendência mais confiáveis. É um dos vários padrões principais que sinaliza, com diferentes graus de precisão, que uma tendência está chegando ao fim. [ Guia de instalação | Guia de atualização | Solução de problemas | FAQ | Todo
MSnR Lines
Pierre Paul Amoussou
MSnR Lines é um indicador personalizado projetado para exibir níveis de suporte e resistência em um gráfico. Esses níveis são baseados na teoria de Suporte e Resistência da Malásia, que define os níveis não como áreas, mas como níveis de preço específicos derivados de picos e vales de gráficos de linha. Recursos: Três tipos de níveis: A-Level, V-Level e Nível de lacuna. Indicação de frescor para níveis: Os níveis frescos são mais significativos do que os níveis não frescos. Cor e estilo personal
Cansado de traçar linhas de suporte e resistência? A Resistência de suporte é um indicador de período múltiplo que detecta e plota automaticamente linhas de suporte e resistência no gráfico com um toque muito interessante: conforme os níveis de preços são testados ao longo do tempo e sua importância aumenta, as linhas se tornam mais espessas e mais escuras. [ Guia de instalação | Guia de atualização | Solução de problemas | FAQ | Todos os produtos ] Melhore sua análise técnica da noite para o d
MT5 Support and Resistance Indicator Automatic Drawing of Multiple Supports and Resistances with levels.  Supports As follow 1.       Weak Support 2.       Untested Support 3.       Verified Support 4.       Proven Support 5.       Turncoat Support Resistances As follow 1.       Weak Resistance 2.       Untested Resistance 3.       Verified Resistance 4.       Proven Resistance 5.       Turncoat Resistance Best Strategy to use 1.       Identify Trend Direction on Daily Time Frame, Example Gold =
Weis Wave Scouter
Jean Carlos Martins Roso
Descubra o poder da análise avançada de volume com o Weis Wave Scouter, um indicador revolucionário para MetaTrader 5 que combina os princípios consagrados do método Wyckoff e da análise VSA (Volume Spread Analysis). Desenvolvido para traders que buscam precisão e profundidade em suas operações, este indicador oferece uma leitura tática do mercado por meio da análise de ondas de volume cumulativo, ajudando a identificar pontos-chave de reversão e continuação de tendência. O Weis Wave Scouter a
Time Candle Suleiman
Suleiman Alhawamdah
5 (22)
Por favor, deixe uma avaliação positiva. Nota importante: A imagem mostrada nas capturas de tela é dos meus indicadores, o indicador "Suleiman Levels" e o indicador "RSI Trend V", incluindo, é claro, o "Time Candle" anexado, que originalmente faz parte do indicador abrangente para análise avançada e níveis exclusivos, "Suleiman Levels". Se você gostar, experimente o indicador "RSI Trend V": https://www.mql5.com/en/market/product/132080 e se você gostar, experimente o indicador "Suleiman Levels":
FREE
Trend Lines Supports and Resistances is an indicator that analyses the market structure, identifies Pivot Points, displays active Support/Resistance zones and trend levels. Main Features: Defining and displaying Pivot Points. Analyse Pivot Points to build and display trend lines. Setting up visual display of trend lines. Setting up trend lines broken notifications. Analyse Pivot Points to define and display support and resistance levels. Setting up visual display of support and resistance leve
Pivot_Point_Weekly — clear, uncluttered weekly pivots for MT5 Pivot_Point_Weekly plots one thing and does it exceptionally well: the classic weekly pivot (P) calculated from the previous week’s high, low, and close. It renders each week’s pivot as a clean horizontal “step,” with short, perfectly vertical joins from week to week so you can see the regime shifts at a glance—without cluttering your chart with a forest of levels. This indicator is intentionally minimalist: no S1/R1 ladders, no fib v
Automatic Fibonacci Tool Fibonacci retracements is a popular instrument used by technical analysts to determine potential Support and Resistance areas. In technical analysis, this tool is created by taking two extreme points (usually a peak and a minimum) on the chart and dividing the vertical distance by the key Fibonacci coefficients equal to 23.6%, 38.2%, 50%, 61.8%, and 100%. Our Automatic Fibonacci Tool is programmed to make thigs easier. Using this tool, there is no need to explicitly set
Resumo Auto Fibo Trend Signal é um indicador de análise multifuncional desenvolvido para auxiliar traders manuais na leitura de mercado e na tomada de decisões. Através de um painel de controle interativo integrado diretamente no gráfico, você pode gerenciar diversos indicadores técnicos e modificar parâmetros em tempo real, eliminando a necessidade de abrir constantemente a janela de propriedades. Funções e Características Principais Painel de Controle Interativo O painel dedicado permite ativ
FREE
Português (Portugais) Indicador Monthly Levels + Pin Bar Pro Descrição O indicador Monthly Levels + Pin Bar Pro combina os níveis mensais chave (Máxima, Mínima, Abertura, Fechamento) com a detecção automática de padrões de reversão Price Action (Pin Bars) . Desenvolvido para traders técnicos e institucionais, ajuda a antecipar zonas de reação do mercado e gera sinais visuais claros no gráfico. Funcionalidades principais Níveis mensais automáticos : Máxima, Mínima, Abertura, Fechament
Easy Indy
Vinutthapon Bumroong
This indicator automatically draws trendlines, Fibonacci levels, support and resistance zones, and identifies BOS (Break of Structure) and CHOCH (Change of Character) patterns on the chart. Just by placing it on the graph, it handles the essential technical analysis tasks for traders, providing a streamlined, effective trading tool this tools is alway make every one easy for trading.
The indicator builds a graphical analysis based on the Fibonacci theory. Fibo Fan is used for the analysis of the impulses and corrections of the movement. Reversal lines (2 lines at the base of the Fibonacci fan) are used to analyze the direction of movements. The indicator displays the of 4 the target line in each direction. The indicator takes into account market volatility. If the price is above the reversal lines, it makes sense to consider buying, if lower, then selling. You can open posi
Este indicador para Metatrader5 analiza múltiples timeframes dinámicamente para identificar máximos   y mínimos significativos según va avanzando el precio, proyectando niveles de recuperación   (Fibonacci o personalizados). Incluye sistema de caché para máximo   rendimiento y validación no intrusiva de timeframes.     CARACTERÍSTICAS PRINCIPALES: 1.   Análisis multi-timeframe (hasta 3 timeframes simultáneos) 2.   Dinámico: Sigue la evolución del precio   3. Sistema de caché inteligente (optimiz
Este é um indicador MTF dos níveis de suporte e resistência com base nos   extremos do indicador Advanced ZigZag Dynamic   e / ou   Extended Fractals   com etiquetas de preço (pode ser desativado). TFs mais altos podem ser selecionados para o modo MTF. Por padrão, os níveis são gerados com base nos pontos do indicador ZigZag. Os pontos indicadores fractais também podem ser usados em conjunto com o ZigZag ou em vez dele. Para simplificar o uso e economizar tempo de CPU, o cálculo é realizado uma
O HAshi-E é uma forma aprimorada de analisar os sinais do Heiken-Ashi. Resumo: O Heiken-Ashi é particularmente valorizado por sua capacidade de filtrar a volatilidade de curto prazo, o que o torna a ferramenta preferida para identificar e acompanhar tendências, ajuda na tomada de decisões sobre pontos de entrada e saída e auxilia na distinção entre sinais falsos e reversões genuínas de tendências. Diferentemente dos gráficos de velas tradicionais, as velas Heiken-Ashi são calculadas usando os
Unlock the power of Fibonacci with our advanced indicator! This tool precisely plots Fibonacci levels based on the previous day's high and low, identifying the next day's key support and resistance levels. Perfect for day trading and swing trading, it has consistently generated weekly profits for me. Elevate your trading strategy and seize profitable opportunities with ease. NOTE: In the Input section make sure the draw labels are set to "True" so you can see each levels.
Magnetic levels for MT5 is a great addition to your trading strategy if you use support and resistance levels, supply and demand zones. The price very often gives good entry points to the position exactly at the round levels and near them. The indicator is fully customizable and easy to use: -Choose the number of levels to be displayed -Choose the distance Between The levels -Choose the color of the levels. Can be added to your trading system for more confluence. Works very well when combined
O nível Premium é um indicador único com mais de 80% de precisão nas previsões corretas! Este indicador foi testado pelos melhores Especialistas em Negociação por mais de dois meses! O indicador do autor você não encontrará em nenhum outro lugar! A partir das imagens você pode ver por si mesmo a precisão desta ferramenta! 1 é ótimo para negociar opções binárias com um tempo de expiração de 1 vela. 2 funciona em todos os pares de moedas, ações, commodities, criptomoedas Instruções: Assim
Auto Optimized RSI   é um indicador de setas inteligente e fácil de usar, projetado para fornecer sinais de negociação precisos. Ele utiliza simulações de trades com dados históricos para identificar automaticamente os níveis de compra e venda de RSI mais eficazes para cada instrumento e período gráfico. Este indicador pode ser usado como um sistema de negociação independente ou como parte da sua estratégia atual. É especialmente útil para traders de curto prazo. Diferente dos níveis fixos tradi
Provide ideas for trend trading. Automatic calculation and generation of trend channels. The channel line, also known as the pipeline line, is to draw a straight line parallel to the trend line in the opposite direction of the trend line, and the straight line crosses the highest or lowest price of the recent period. These two lines run the price in the middle and have obvious pipe or channel shapes. Necessary for traders: tools and indicators Waves automatically calculate indicators, channel
Golden Zones Pro
Cleverson Tuntufye Kilembe
Golden Zones Pro  é o seu indicador MT5 completo para qualquer instrumento e em qualquer tempo gráfico. Ele marca as zonas exatas onde movimentos sérios têm probabilidade de começar. Configure, ajuste e apenas siga as zonas — sem adivinhações, sem pensar demais. Como entrar em Compra ou Venda: • Entre em uma compra ou venda apenas quando o preço entrar na zona e for rejeitado, confirmado por velas (candles) de rejeição claras. • Se o nível for rompido (o preço fechar além da zona), não entre na
All Harmonics 26
Alexey Isavnin
3.5 (4)
Harmonic patterns are characteristic series of price movements with respect to Fibonacci levels, which statistically precede price reversals. This indicator searches for harmonic patterns. It is capable of recognising 26 classical and non-classical harmonic patterns : Classical Gartley Butterfly Alternate Butterfly Bat Alternate Bat Crab Deep Crab Three Drives Non-classical Shark Alternate Shark Cypher 5-0 Anti Gartley Anti Butterfly Anti Alternate Butterfly Anti Bat Anti Alternate Bat Anti Crab
Renko Plus
Eadvisors Software Inc.
Com o Renko Plus você consegue utilizar os recursos na funcionalidade Indicador, basta adicioná-lo ao gráfico do Metatrader5.             O gráfico Renko é um tipo de gráfico, desenvolvido pelos japoneses, que é construído usando o movimento de preços em vez de preços e intervalos de tempo padronizados, como a maioria dos gráficos. Acredita-se que tenha o nome da palavra japonesa para tijolos, "renga", já que o gráfico se parece com uma série de tijolos.             Um novo tijolo
Double HMA MTF for MT5
Pavel Zamoshnikov
4 (4)
This is an advanced multi-timeframe version of the popular Hull Moving Average (HMA) Features Two lines of the Hull indicator of different timeframes on the same chart. The HMA line of the higher timeframe defines the trend, and the HMA line of the current timeframe defines the short-term price movements. A graphical panel with HMA indicator data from all timeframes at the same time . If the HMA switched its direction on any timeframe, the panel displays a question or exclamation mark with a tex
Volunacci MT5
Mohammed Kaddour
Volonacci Indicator It is an indicator that combines Fibonacci and volume to determine the price direction This indicator helps you identify Fibonacci angles according to the strategy The Volonacci indicator is indeed an interesting combination of Fibonacci levels and volume. This indicator uses Fibonacci tools to identify potential support and resistance levels, and enhances this by using volume to confirm the strength behind the price action. MT4 Version  https://www.mql5.com/en/market/produ
TrendFusionXplorer consists of three powerful trend-analyzing indicators — TRP , PMax and OTT — developed by Kivanc Ozbilgic. Each indicator displays the trend's support and resistance levels based on its unique properties and methodology. TrendFusionXplorer assists in determining entry and exit points for markets and can also be used for setting trailing stop-loss (SL) and take-profit (TP) levels on open positions. Specifications 1. Trend Reversal Predictor (TRP): TRP follows Thomas R. DeMar
Renko System
Marco Montemari
This indicator can be considered as a trading system. It offers a different view to see the currency pair: full timeless indicator, can be used for manual trading or for automatized trading with some expert advisor. When the price reaches a threshold a new block is created according to the set mode. The indicator beside the Renko bars, shows also 3 moving averages. Features renko mode median renko custom median renko 3 moving averages wicks datetime indicator for each block custom notification
Indicador Support & Resistance é uma modificação do indicador Fractals, padrão Bill Williams. O indicador funciona em qualquer prazo. Ele exibe os níveis de suporte e resistência no gráfico e permite a definição do stop loss e take profit (você pode verificar o valor exato, colocando o cursor do mouse sobre o nível). Linhas tracejadas Azul são nível de suporte. Linhas tracejadas vermelho são nível de resistência. Se você quiser, você pode mudar o estilo e a cor dessas linhas. Se o preço se aprox
RBreaker
Zhong Long Wu
RBreaker Gold Indicators é uma estratégia de negociação intradiária de curto prazo para futuros de ouro que combina duas abordagens: o seguimento de tendência e as reversões intradiárias. Ela permite capturar lucros durante mercados em tendência e também realizar lucros oportunamente e operar na direção oposta quando o mercado se reverte. Esta estratégia foi classificada por 15 anos consecutivos entre as dez estratégias de negociação mais lucrativas pela revista americana Futures Truth. Ela pos
Os compradores deste produto também adquirem
Azimuth Pro
Ottaviano De Cicco
5 (6)
PROMOÇÃO DE LANÇAMENTO O preço do Azimuth Pro está inicialmente definido em 299$ para os primeiros 100compradores. O preço final será de 499$ . A DIFERENÇA ENTRE ENTRADAS RETAIL E INSTITUCIONAIS NÃO É O INDICADOR — É A LOCALIZAÇÃO. A maioria dos traders entra em níveis de preço arbitrários, perseguindo momentum ou reagindo a sinais atrasados. As instituições esperam o preço atingir níveis estruturados onde oferta e demanda realmente mudam. Azimuth Pro mapeia esses níveis automaticamente: VWA
Divergence Bomber
Ihor Otkydach
4.9 (86)
Cada comprador deste indicador recebe adicionalmente, e de forma gratuita: A ferramenta exclusiva "Bomber Utility", que acompanha automaticamente cada operação, define os níveis de Stop Loss e Take Profit e fecha operações de acordo com as regras da estratégia; Arquivos de configuração (set files) para ajustar o indicador em diferentes ativos; Set files para configurar o Bomber Utility nos modos: "Risco Mínimo", "Risco Balanceado" e "Estratégia de Espera"; Um vídeo tutorial passo a passo que aju
CGE Trading Suite
Carl Gustav Johan Ekstrom
5 (1)
CGE Trading Suite delivers the analytical edge typically reserved for professional trading desks. The platform integrates a full suite of analytical tools into one seamless workflow: dynamic grid mapping, liquidity behavior analysis, ECM, trend lines, MIDAS, trade cycles, and directional channel projections. Together, these provide a unified view of market structure and momentum. Directional clarity is further enhanced by the capital flow index, which measures currency basket strength to identif
RelicusRoad Pro: Sistema Operacional Quantitativo de Mercado 70% DE DESCONTO ACESSO VITALÍCIO (TEMPO LIMITADO) - JUNTE-SE A 2.000+ TRADERS Por que a maioria dos traders falha mesmo com indicadores "perfeitos"? Porque eles operam Conceitos Únicos no vácuo. Um sinal sem contexto é uma aposta. Você precisa de CONFLUÊNCIA . RelicusRoad Pro não é um simples indicador de seta. É um Ecossistema Quantitativo de Mercado completo. Ele mapeia a "Estrada do Valor Justo", distinguindo ruído de rupturas estru
Trend Screener Pro MT5
STE S.S.COMPANY
4.84 (103)
Desbloqueie o poder da negociação de tendências com o indicador Trend Screener: sua solução definitiva de negociação de tendências, alimentada por lógica difusa e sistema de múltiplas moedas! Eleve sua negociação de tendências com o Trend Screener, o revolucionário indicador de tendências alimentado por lógica difusa. É um poderoso indicador de acompanhamento de tendências que combina mais de 13 ferramentas e recursos premium e 3 estratégias de negociação, tornando-o uma escolha versátil para to
Quantum TrendPulse
Bogdan Ion Puscasu
5 (22)
Apresentando   Quantum TrendPulse   , a ferramenta de negociação definitiva que combina o poder do   SuperTrend   ,   RSI   e   Stochastic   em um indicador abrangente para maximizar seu potencial de negociação. Projetado para traders que buscam precisão e eficiência, este indicador ajuda você a identificar tendências de mercado, mudanças de momentum e pontos de entrada e saída ideais com confiança. Principais características: Integração SuperTrend:   siga facilmente a tendência predominante do
OmniSync Projection
Antonio-alin Teculescu
5 (1)
Chronos Fractal Engine is an innovative price projection indicator for MetaTrader 5, designed to transform your technical analysis by intelligently identifying and projecting historical price patterns. Built upon an advanced correlation algorithm and the fractal principles of the market, this powerful tool visualizes potential future price movements, giving you a unique edge in your trading decisions. What is Chronos Fractal Engine? At its core, the Chronos Fractal Engine employs a sophisticat
Btmm state engine pro
Garry James Goodchild
5 (3)
BTMM State Engine Pro is a MetaTrader 5 indicator for traders who use the Beat The Market Maker approach: Asian session context, kill zone timing, level progression, peak formation detection, and a multi-pair scanner from a single chart. It combines cycle state logic with a built-in scanner dashboard so you do not need the same tool on many charts at once. What it does Draws the Asian session range; session times can follow broker server offset or be set in inputs. Tracks level progression (L
Apresentando       Quantum Breakout PRO   , o inovador Indicador MQL5 que está transformando a maneira como você negocia Breakout Zones! Desenvolvido por uma equipe de traders experientes com experiência comercial de mais de 13 anos,       Quantum Breakout PRO       foi projetado para impulsionar sua jornada comercial a novos patamares com sua estratégia de zona de fuga inovadora e dinâmica. O Quantum Breakout Indicator lhe dará setas de sinal em zonas de breakout com 5 zonas-alvo de lucro e su
Grabber System MT5
Ihor Otkydach
4.83 (23)
Apresento a você um excelente indicador técnico: Grabber, que funciona como uma estratégia de trading “tudo incluído”, pronta para usar. Em um único código estão integradas ferramentas poderosas de análise técnica de mercado, sinais de entrada (setas), funções de alertas e notificações push. Cada comprador deste indicador também recebe gratuitamente: Utilitário Grabber: ferramenta para gerenciamento automático de ordens abertas Vídeo tutorial passo a passo: como instalar, configurar e operar com
ARICoins
Temirlan Kdyrkhan
ARICoin is a powerful trading companion designed to generate high-probability entry signals with dynamic TP/SL/DP levels based on volatility. Built-in performance tracking shows win/loss stats, PP1/PP2 hits, and success rates all updated live. Key Features: Buy/Sell signals with adaptive volatility bands Real-time TP/SL/DP levels based on ATR Built-in MA Filter with optional ATR/StdDev volatility Performance stats panel (Success, Profit/Loss, PP1/PP2) Alerts via popup, sound, push, or email Cust
Bill Williams Advanced
Siarhei Vashchylka
5 (11)
Bill Williams Advanced is designed for automatic chart analysis using Bill Williams' "Profitunity" system. The indicator analyzes four timeframes at once. Manual (Be sure to read before purchasing) Advantages 1. Analyzes the chart using Bill Williams' "Profitunity" system. Signals are displayed in a table in the corner of the screen and on the price chart. 2. Finds all known AO and AC signals, as well as zone signals. Equipped with a trend filter based on the Alligator. 3. Finds "Divergence Bar
RFI levels PRO MT5
Roman Podpora
3.67 (3)
O indicador mostra com precisão os pontos de reversão e as zonas de retorno de preço onde o   Principais players . Você identifica onde novas tendências estão se formando e toma decisões com máxima precisão, mantendo o controle sobre cada negociação. VERSION MT4     -    Revela seu potencial máximo quando combinado com o indicador   TREND LINES PRO. O que o indicador mostra: Estruturas de reversão e níveis de reversão com ativação no início de uma nova tendência. Exibição dos níveis de   TAKE P
ARIPoint
Temirlan Kdyrkhan
ARIPoint is a powerful trading companion designed to generate high-probability entry signals with dynamic TP/SL/DP levels based on volatility. Built-in performance tracking shows win/loss stats, PP1/PP2 hits, and success rates all updated live. Key Features: Buy/Sell signals with adaptive volatility bands Real-time TP/SL/DP levels based on ATR Built-in MA Filter with optional ATR/StdDev volatility Performance stats panel (Success, Profit/Loss, PP1/PP2) Alerts via popup, sound, push, or email Cu
Trend Forecaster
Alexey Minkov
5 (7)
The Trend Forecaster indicator utilizes a unique proprietary algorithm to determine entry points for a breakout trading strategy. The indicator identifies price clusters, analyzes price movement near levels, and provides a signal when the price breaks through a level. The Trend Forecaster indicator is suitable for all financial assets, including currencies (Forex), metals, stocks, indices, and cryptocurrencies. You can also adjust the indicator to work on any time frames, although it is recommen
Advanced Supply Demand MT5
Bernhard Schweigert
4.53 (15)
Atualmente com 33% de desconto! A melhor solução para qualquer Trader Novato ou especialista! Este indicador é uma ferramenta de negociação exclusiva, de alta qualidade e acessível porque incorporamos uma série de recursos proprietários e uma nova fórmula. Com esta atualização, você poderá mostrar fusos horários duplos. Você não só será capaz de mostrar um TF mais alto, mas também mostrar ambos, o TF do gráfico, MAIS o TF mais alto: MOSTRANDO ZONAS ANINHADAS. Todos os traders de Oferta e Demanda
O Sistema Global de Resolução do Estado do Mercado China Tianji é um indicador de análise de estado de mercado para MT5 que pode ser usado em qualquer símbolo e em qualquer período gráfico. Ele ajuda o trader a identificar se o mercado atual está mais próximo de uma fase lateral ou de uma tendência, além de mostrar quais regiões de preço merecem mais atenção e quais podem parecer atraentes, mas ainda carregam risco mais alto. O Sistema Global de Resolução do Estado do Mercado China Tianji é um s
A Master Edition é uma ferramenta analítica de nível profissional projetada para visualizar a estrutura do mercado através da lente do volume e do fluxo de dinheiro. Ao contrário dos indicadores de volume padrão, esta ferramenta exibe um Perfil de Volume Diário diretamente no seu gráfico, permitindo ver exatamente onde a descoberta de preços ocorreu e onde o "dinheiro inteligente" está posicionado. Esta Master Edition é projetada para clareza e velocidade, apresentando um sistema único de Auto-T
PZ Trend Trading MT5
PZ TRADING SLU
3.8 (5)
O Trend Trading é um indicador projetado para lucrar o máximo possível com as tendências que ocorrem no mercado, cronometrando retrocessos e rupturas. Ele encontra oportunidades de negociação analisando o que o preço está fazendo durante as tendências estabelecidas. [ Guia de instalação | Guia de atualização | Solução de problemas | FAQ | Todos os produtos ] Negocie mercados financeiros com confiança e eficiência Lucre com as tendências estabelecidas sem ser chicoteado Reconhecer retrocessos
Current event:  https://c.mql5.com/1/326/A2SR2025_NoMusic.gif A2SR para MT5 Indicador: Oferta e Procura (S/R) Atual Automatizada. + Instrumentos de Negociação. Product description in English here. --   Guidance   : -- at   https://www.mql5.com/en/blogs/post/734748/page4#comment_16532516 -- and  https://www.mql5.com/en/users/yohana/blog Poderoso, Genuíno e que Poupa Tempo para Decisões de Negociação Mais Inteligentes + Objetos Compatíveis com EA. Principais Vantagens Níveis de SR Antecipado
AriX
Temirlan Kdyrkhan
1 (4)
AriX Indicator for MT5 A powerful trend-following and signal-evaluation tool AriX is a custom MT5 indicator that combines Moving Averages and ATR-based risk/reward logic to generate clear buy/sell signals. It visualizes dynamic SL/TP levels, evaluates past trade outcomes, and displays win/loss statistics in a clean on-chart panel. Key features include: Buy/Sell signals based on MA crossovers ATR-based SL/TP1/TP2/TP3 levels with visual lines and labels Signal outcome tracking with real-time stat
Gartley Hunter Multi
Siarhei Vashchylka
5 (11)
Gartley Hunter Multi - An indicator for searching for harmonic patterns simultaneously on dozens of trading instruments and on all possible timeframes. Manual (Be sure to read before purchasing) | Version for MT4 Advantages 1. Patterns: Gartley, Butterfly, Shark, Crab. Bat, Alternate Bat, Deep Crab, Cypher 2. Simultaneous search for patterns on dozens of trading instruments and on all possible timeframes 3. Search for patterns of all possible sizes. From the smallest to the largest 4. All fou
TPSpro RFI Levels MT5
Roman Podpora
4.53 (19)
INSTRUÇÕES RUS  /  INSTRUÇÕES   ENG  /  Versão MT4 Principais funções: Exibe zonas ativas de vendedores e compradores! O indicador exibe todos os níveis/zonas de impulso iniciais corretos para compras e vendas. Quando esses níveis/zonas são ativados, onde a busca por pontos de entrada começa, os níveis mudam de cor e são preenchidos com cores específicas. Setas também aparecem para uma percepção mais intuitiva da situação. LOGIC AI - Exibição de zonas (círculos) para busca de pontos de entrada
Este é um indicador para MT5 que fornece sinais precisos para entrar em uma negociação sem redesenhar. Ele pode ser aplicado a qualquer ativo financeiro: forex, criptomoedas, metais, ações, índices. Ele fornecerá estimativas bastante precisas e informará quando é melhor abrir e fechar um negócio. Assista o vídeo (6:22) com um exemplo de processamento de apenas um sinal que compensou o indicador! A maioria dos traders melhora seus resultados de negociação durante a primeira semana de negociação c
LINHAS DE TENDÊNCIA PRO   -   Ajuda a entender onde o mercado está realmente mudando de direção. O indicador mostra inversões de tendência reais e pontos onde os principais participantes retornam ao mercado. Você vê     Linhas BOS   Análise de tendências e níveis-chave em prazos maiores — sem configurações complexas ou ruídos desnecessários. Os sinais não são repintados e permanecem no gráfico após o fechamento da barra. VERSÃO MT4   -   Revela seu potencial máximo quando combinado com o   indic
Ferramenta dos market makers. O Meravith irá: Analisar todos os timeframes e exibir a tendência atual em vigor. Destacar zonas de liquidez (equilíbrio de volume) onde o volume comprador e vendedor é igual. Mostrar todos os níveis de liquidez de diferentes timeframes diretamente no seu gráfico. Gerar e apresentar análise de mercado em formato de texto para sua referência. Calcular alvos, níveis de suporte e pontos de stop-loss com base na tendência atual. Calcular a relação risco/retorno das suas
Antes de tudo, vale ressaltar que esta Ferramenta de Negociação é um Indicador Não Repintante, Não Redesenhante e Não Atrasado, o que a torna ideal para negociação profissional. Curso online, manual do utilizador e demonstração. O Indicador de Conceitos de Ação de Preço Inteligente é uma ferramenta muito poderosa tanto para traders novos quanto experientes. Ele combina mais de 20 indicadores úteis em um único, combinando ideias avançadas de negociação como Análise do Trader do Círculo Interno
Easy SMC Trading
Israr Hussain Shah
4 (1)
Análise de Tendência Estrutural com Auto RR e Scanner de BOS Versão: 1.0 Visão Geral A Análise de Tendência Estrutural com Auto RR é um sistema de negociação abrangente, concebido para traders que dependem da Ação do Preço e da Estrutura de Mercado. Combina um filtro de tendência suavizado com a deteção de Pontos de Oscilação e sinais de Ruptura de Estrutura (BOS) para gerar configurações de negociação de alta probabilidade. O principal diferencial desta ferramenta é a sua Gestão de Risco Aut
Order Block Pro (MQL5) – Versão 1.0 Autor: KOUAME N'DA LEMISSA Plataforma: MetaTrader 5 Descrição: Order Block Pro é um indicador avançado projetado para detectar automaticamente Blocos de Ordem de alta e baixa no seu gráfico. Ao analisar velas de consolidação seguidas de velas de impulso fortes, o indicador identifica áreas-chave onde o preço provavelmente se acelerará. Ideal para traders que desejam: Identificar pontos de entrada e saída precisos. Detectar zonas dinâmicas de suporte e resistê
PZ Swing Trading MT5
PZ TRADING SLU
5 (5)
Swing Trading é o primeiro indicador projetado para detectar oscilações na direção da tendência e possíveis oscilações de reversão. Ele usa a abordagem de negociação de linha de base, amplamente descrita na literatura de negociação. O indicador estuda vários vetores de preço e tempo para rastrear a direção da tendência agregada e detecta situações nas quais o mercado está sobrevendido ou sobrecomprado em excesso e pronto para corrigir. [ Guia de instalação | Guia de atualização | Solução de prob
Mais do autor
Product Description: Adaptive Y-Axis Scaling is a powerful MT5 indicator designed to enhance your trading experience by providing precise control over the Y-axis (price) scaling of your charts. This innovative tool allows you to customize the price scaling by specifying the number of pips from the visible chart's highs and lows. The calculated price range from this input is then used to set the maximum and minimum prices for the open chart, ensuring an optimized and comprehensive view of market
FREE
Introducing the B4S BidLine CandleTimer An insightful indicator that combines real-time bid line visualization with a dynamic countdown timer. Gain a competitive edge in your trading as you stay informed about the time remaining until the next candle starts, all displayed seamlessly on your chart. Why B4S BidLine CandleTimer? Unleash the potential of your trading strategy with the B4S BidLine CandleTimer. Here's why this indicator stands out: Real-Time Bid Line: Witness market movements like nev
B4S ChartExplorer
Henry Waribu Macharia
Brief Description: An advanced navigation, news display, and control panel indicator designed to revolutionize your chart analysis experience. Seamlessly navigate through timeframes, dates, and times with an intuitive control panel, and stay informed with visually represented detailed news events. Now with enhanced features and improvements for an even better trading experience. Key Features: User-Friendly Control Panel: Easily navigate through timeframes, dates, and times. Enable or disable the
Brief Description B4S Economic News Radar now offers enhanced features to keep traders informed and empowered. Experience comprehensive news coverage directly on your trading chart, including upcoming and past events, customizable reminders, and automatic time zone adjustments. Why News Events Matter: Market volatility triggered by economic indicators, central bank decisions, and geopolitical events can significantly impact trading outcomes. Stay ahead of these shifts with timely information and
Brief Description: A tool to display historical Open, High, Low, and Close (OHLC) price points for various time periods. Gain insights into market behavior with data from yesterday, the day before, the previous week, and the previous month. Recognize liquidity zones effectively. Features: 1. Comprehensive Timeframe Insights: Visualize crucial OHLC points for different timeframes. Historical data for yesterday, day before yesterday, previous week, and previous month. 2. Built on ICT's Teachings:
Brief Description The indicator is a powerful tool based on Inner Circle Trader's trading theory. It strategically plots lines at key prices relative to time, highlighting crucial market moments such as Tokyo Open, New York Midnight, London Open, New York Open, New York 8:30 AM, and New York Session End. The indicator is built on the foundation of Inner Circle Trader's trading theory, emphasizing the significance of key open times as liquidity and reference zones. These zones act as magnets for
B4S ICT Killzones
Henry Waribu Macharia
Brief Description The B4S_ICT_Killzones indicator is designed to enhance your trading strategy by highlighting key market times based on the Inner Circle Trader's (ICT) proven trading model. This indicator intelligently plots colored boxes around critical "killzone" periods, providing valuable insights into market behavior influenced by different geographical and time zone locations and time variations. Features / Indicator Settings 1. Killzone Identification Asian Range: Target the Asian tradin
Brief Description The B4S PriceLevel Watcher is a useful indicator designed to empower traders with precise price level notifications. It allows users to set customizable notifications based on specific price types, such as close, high, low, ask, bid, or either ask or bid of the current candle.   Problem being solved In the ever-evolving world of trading, staying attuned to price movements is paramount. Traders need to remain vigilant, ready to act swiftly as market conditions change. However, t
Filtro:
Sem comentários
Responder ao comentário