Head and Shoulders Pattern Scanner
- Indikatoren
-
Davoud Moghaddam
 I am a professional MQL5 developer and software engineer with over 5 years of hands-on experience in the Forex market. My main expertise lies in designing, developing, and optimizing Expert Advisors (EAs), custom indicators, and automated trading tools based on various trading strategies.
 - Version: 1.5
- Aktualisiert: 19 Dezember 2023
- Aktivierungen: 20
- Dies ist die Vollversion, um die kostenlose Version zu erhalten , kontaktieren Sie mich bitte.
Die kostenlose Version funktioniert auf "AUDNZD" und "XAUUSD" Charts. - Alle Symbole und Zeitrahmen Scanner
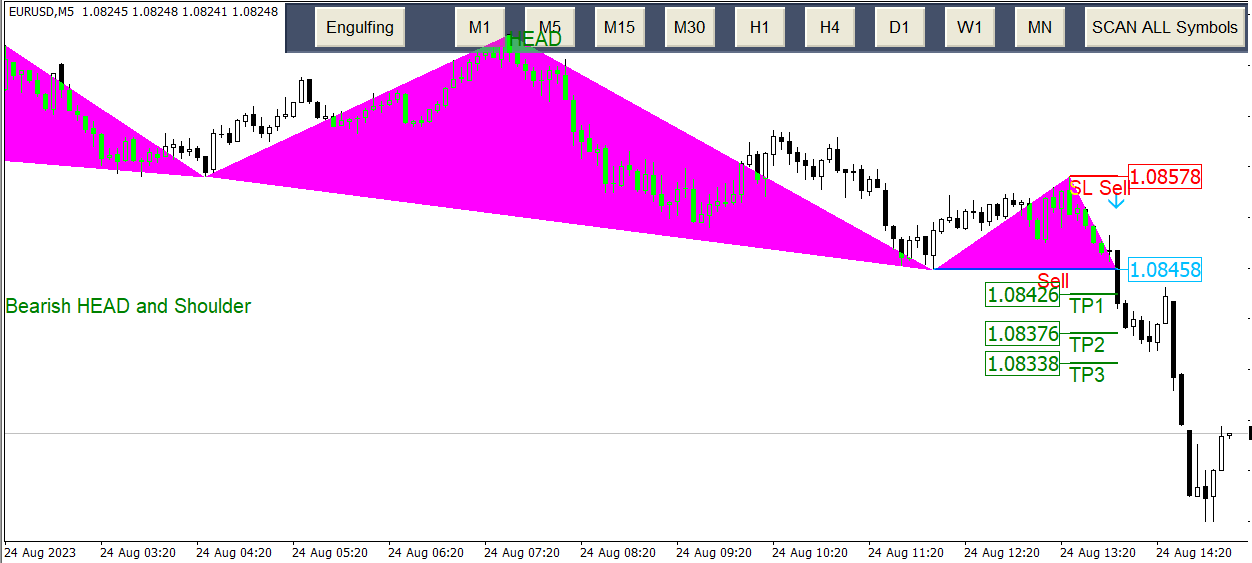
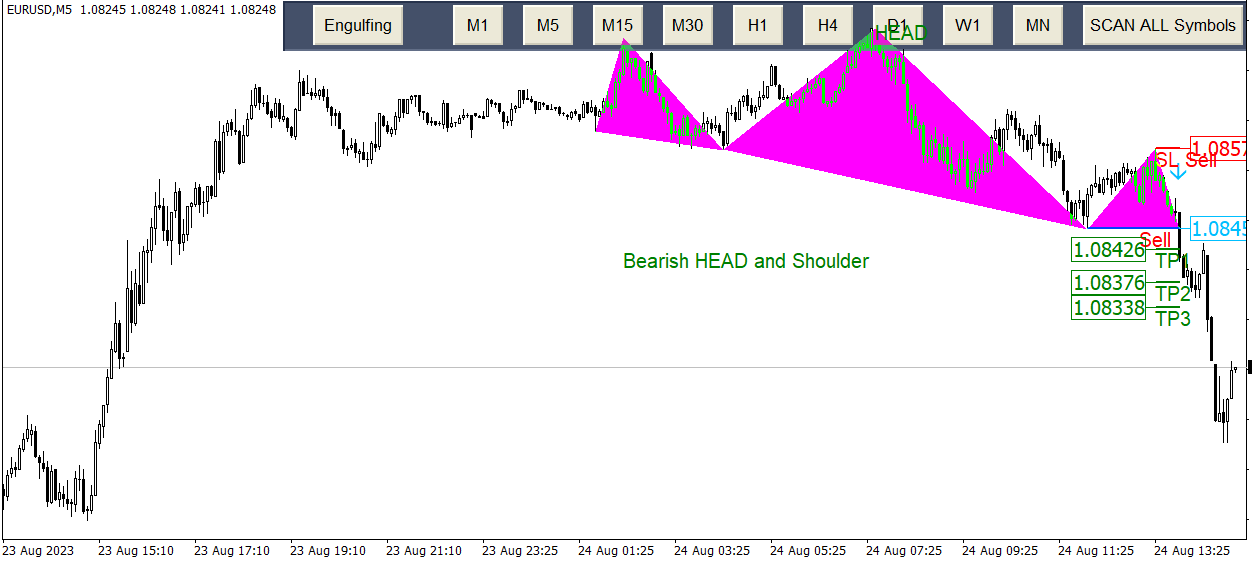
Kopf und Schulter
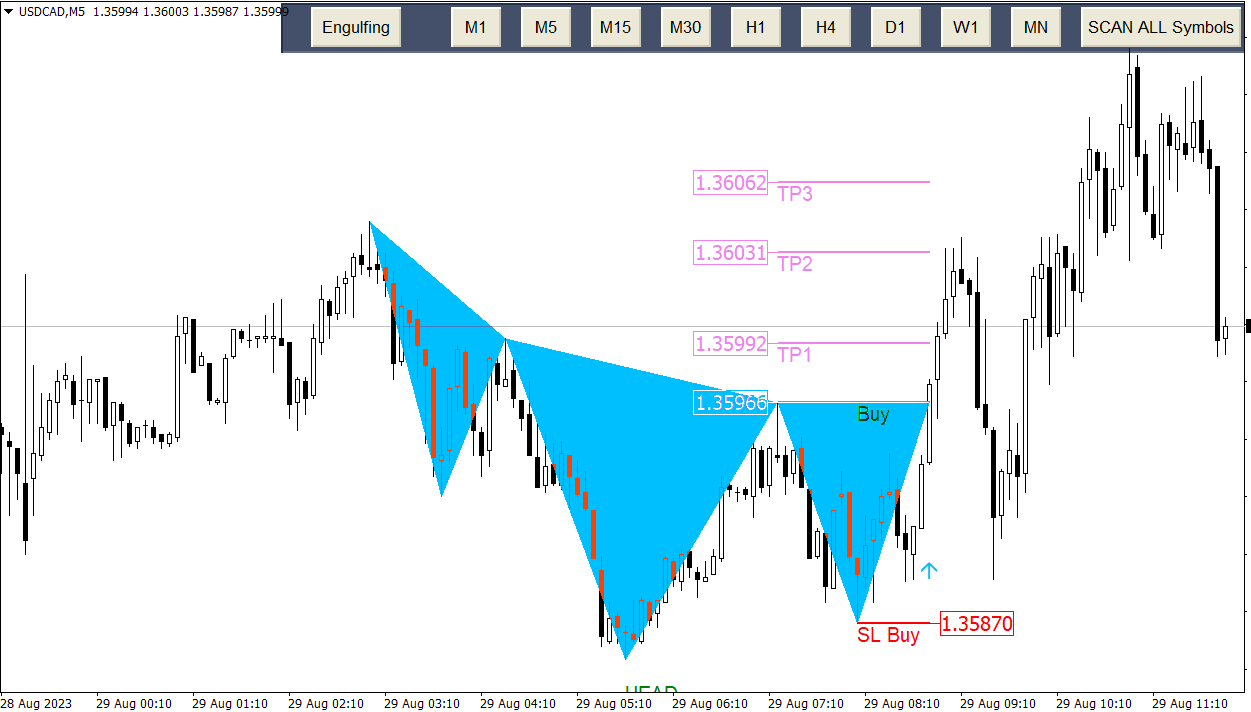
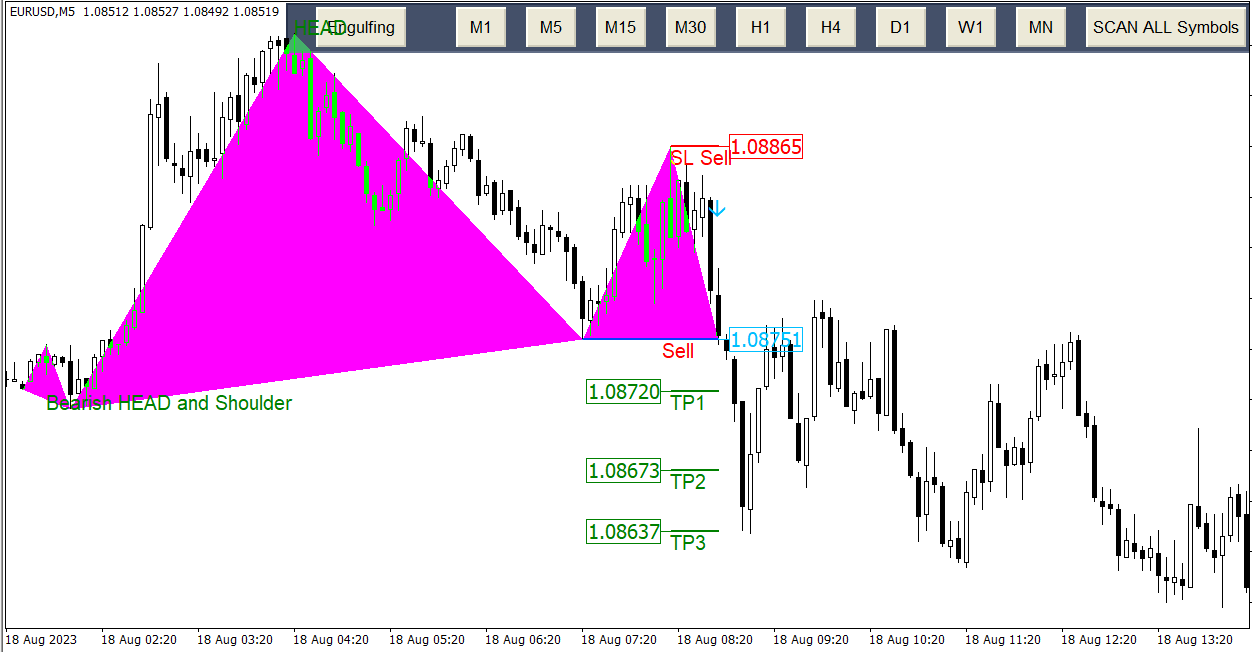
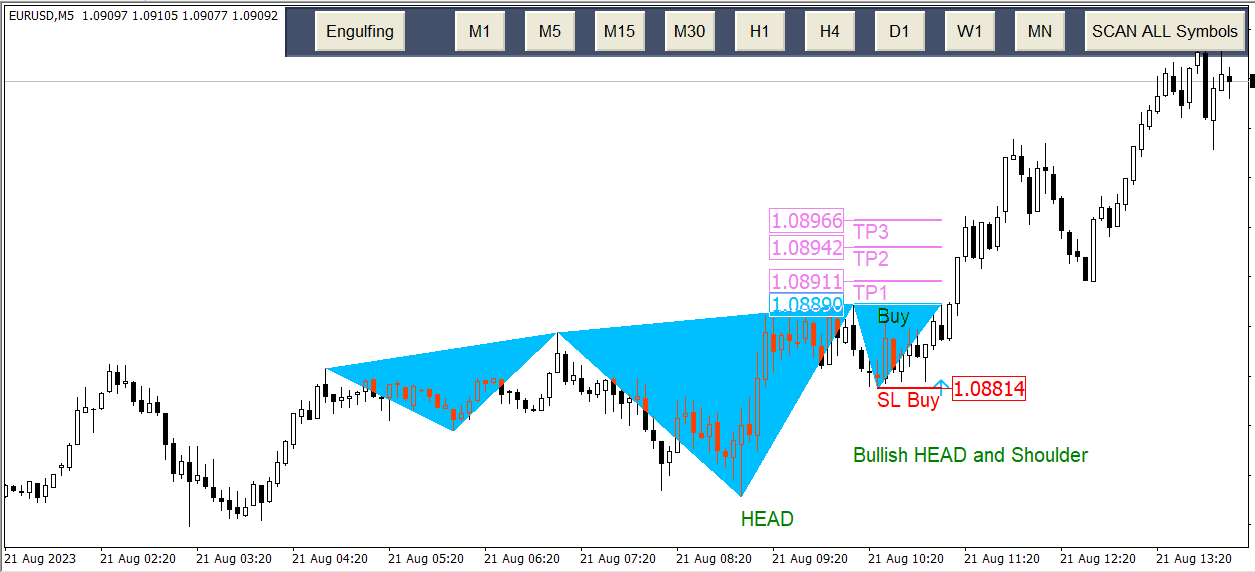
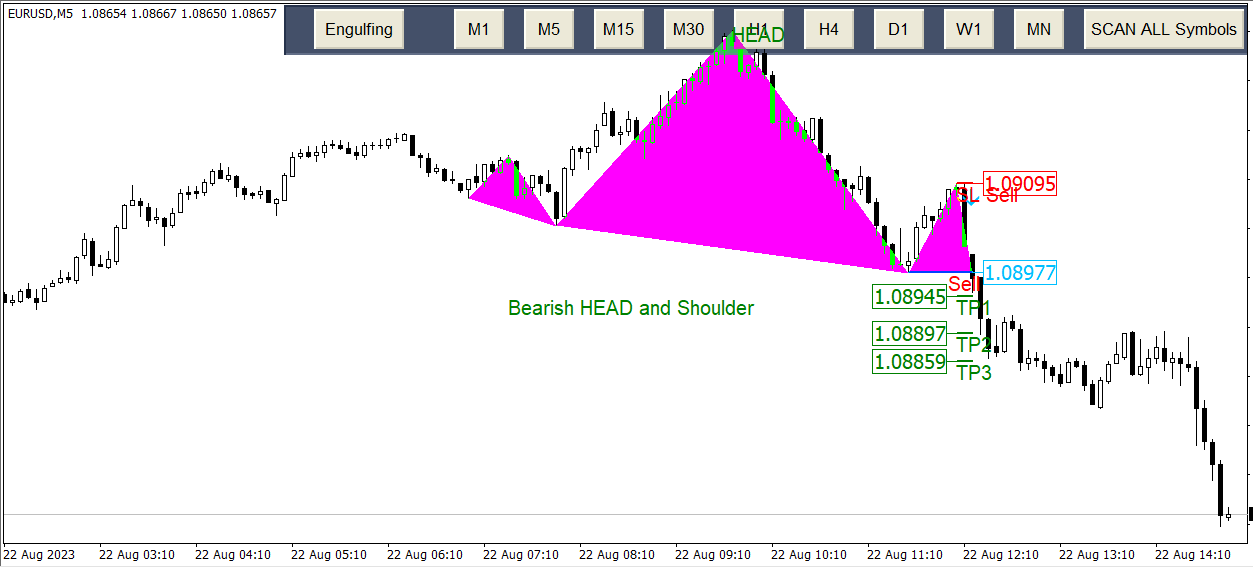
Eines der beliebtesten Price Action-Muster ist das Head and Shoulders-Muster. Das Muster hat drei lokale Spitzen, die der linken Schulter, dem Kopf und der rechten Schulter ähneln. Das Kopf-Schulter-Chartmuster tritt in allen Arten von Märkten auf, einschließlich Forex, Kryptowährungen, Rohstoffen, Aktien und Anleihen. Das Kopf-Schulter-Diagramm in einem Aufwärtsmarkt zeigt eine Trendumkehr von Aufwärts zu Abwärts und signalisiert, dass ein Aufwärtstrend sich seinem Ende nähert. Eine umgekehrte Kopf-Schulter-Formation in einem bärischen Markt bedeutet, dass der Trend seinen Tiefpunkt erreicht haben muss und sich nach oben wenden könnte. Mit diesem Indikator können Sie das Kopf-Schulter-Muster sowohl für das aktuelle Symbol und den aktuellen Zeitrahmen als auch für andere Symbole und Zeitrahmen überprüfen. Ein Ausbruch ist eine potenzielle Handelsmöglichkeit, die sich ergibt, wenn der Kurs eines Vermögenswerts bei steigendem Volumen über ein Widerstandsniveau steigt oder unter ein Unterstützungsniveau fällt.
Kopf und Schulter MT5 Hier
Wichtigste Merkmale |
Eingabe-Parameter |
Anzeige / Stil Option
- Ändern der Farbe des bullischen und bärischen Kopf- und Schulterausbruchs, TP, SL
- Ändern der Liniendicke
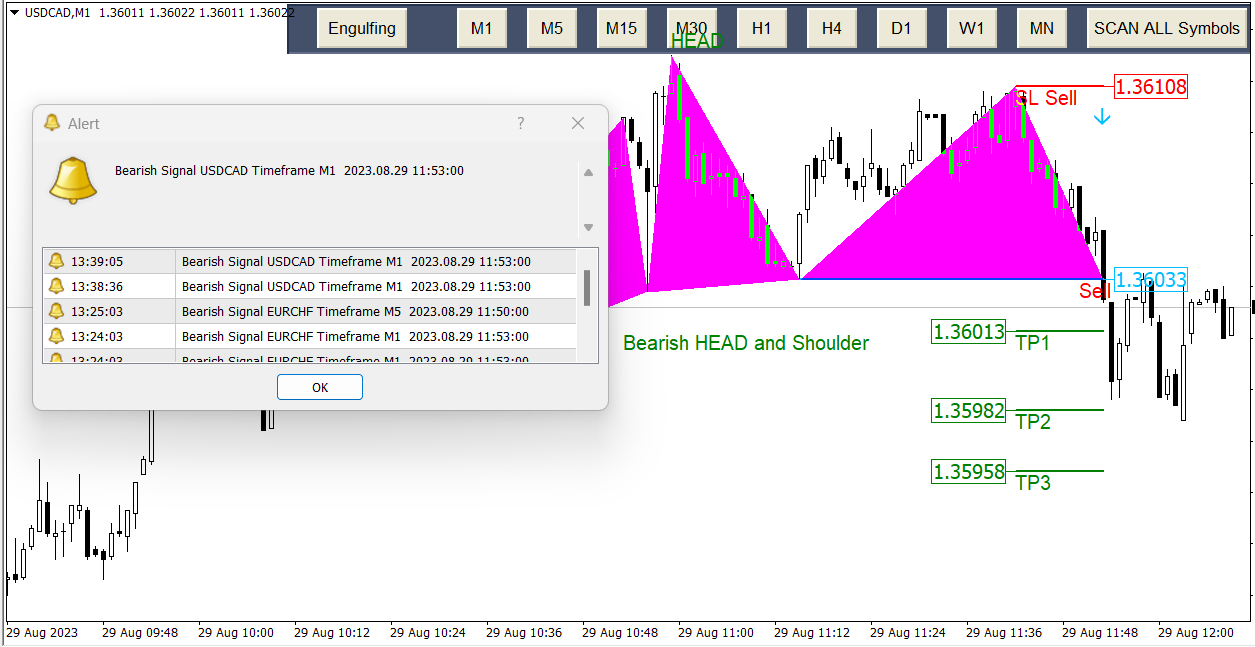
Alert Einstellungen
- Warnung anzeigen, Warnung aktivieren oder deaktivieren
- Benachrichtigung anzeigen, Aktivieren oder Deaktivieren der Benachrichtigung
- E-Mail senden, Aktivieren oder Deaktivieren von E-Mail