Neue technische Indikatoren für den MetaTrader 4 - 134

!!! In [CodeBase] habe ich den Mql4-Indikatorcode veröffentlicht. Laden Sie den Code kostenlos herunter!!! (Sie müssen den Code beim Update des Terminals anpassen).
Dieser Indikator ist ein Werkzeug für Trader. Es zeigt die Bewegung der Stochastik in allen Perioden und Symbolen: М1, М5, М15, М30, Н1, Н4 jede Minute (die Zeitskala von aktuell bis -240 Minuten, d.h. die letzten 4 Stunden).
Step_Stoch überwindet den Nachteil stochastischer Indikatoren - Lagging. Zum Beispiel kann ein Anstieg nach
FREE

MCTC ist der fortschrittlichste Multicurrency-Stärke-Indikator für das Daytrading, der KEINE gleitenden Durchschnitte verwendet. Dieser vielseitige Stärke-Indikator hat viele Einstellungen, die an die Bedürfnisse des Daytraders angepasst werden können. Mit bis zu 12 anpassbaren Zeiträumen, automatischer Berechnung und grafischer Darstellung der Höchst-/Tiefstwerte der vorherigen Periode, 2 seitlichen Anzeigen für Währungsstärke, Paarstärke, Punktbewegung, Punktbewegung der vorherigen Perioden, P

Der BuySellArrows ist ein scheinbar einfacher und beständiger Indikator. Alle Trader kennen Indikatoren, die zahlreiche Eingabeparameter enthalten, die die Kauf- und Verkaufsposition ändern, wenn Sie den Wert dieser Parameter ändern. Viele Trader fragten sich, welcher Parameterwert am genauesten ist. Deshalb habe ich beschlossen, einen universellen Indikator ohne Eingabeparameter zu entwickeln. In diesem Fall werden Sie sehr stabile Indikatoren haben, ohne dass Sie sich Sorgen machen müssen, das
Dieses Produkt kombiniert den Stochastik Oszillator und den RSI. Die Verwendung ist wie folgt. Dieser Indikator funktioniert mit den Zeitrahmen M1 und M5. Dieser Indikator verwendet den Stochastik-Oszillator und den RSI. Das Bild zeigt Stochastic x1 (rot) und RSI x2. Sie können eine Short-Position eröffnen, wenn die Stochastik, der RSI (blau) und der RSI (gelb) einen Wert von 95, 70 bzw. 70 überschreiten, oder eine Long-Position bei Werten von weniger als 5, 30 bzw. 30.

Der Indikator sucht nach Kauf- und Verkaufszonen, in denen ein Geschäft mit einem minimalen Stop-Loss und einem besseren Risiko-Ertrags-Verhältnis eröffnet werden kann. Der Indikator basiert auf der qualitativen Suche nach dem Double Top/Double Bottom Muster. Diese Version funktioniert nur auf USDCAD! Die Vollversion des Indikators kann hier erworben werden - https://www.mql5.com/en/market/product/29820
Funktionsprinzip des Indikators Sucht nach lokalen Tops/Bottoms, die potentiell zu einer Rev
FREE
Dies ist eine Erweiterung des Average True Range-Indikators mit der Aufschlüsselung von Preisgewinn, -verlust und Standardabweichung; mit der Aufschlüsselung des Preises in Preisgewinn und -verlust kann dieser nun als Oszillator mit Standardabweichung als Warteschlange für den Zeitpunkt des Ein- und Ausstiegs verwendet werden.
Einstellungen ATR-Periode - Normalerweise auf 12 eingestellt. ExtStdDev Periode - Dies ist die Periode für die Standardabweichung und folgt normalerweise der ATR-Periode.
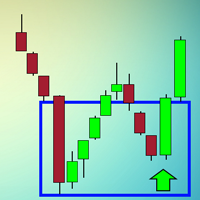
Der Indikator sucht nach Kauf- und Verkaufszonen, in denen ein Geschäft mit einem minimalen Stop-Loss und einem besseren Risiko-Ertrags-Verhältnis eröffnet werden kann. Der Indikator basiert auf der qualitativen Suche nach dem Muster Double top/Double bottom.
Funktionsprinzip des Indikators Sucht nach lokalen Höchst-/Tiefstständen, die potenziell zu einer Umkehrzone werden können Er wartet auf eine Impulsbewegung, die über die Umkehrzone hinausgeht, und zeichnet ein rot/blaues breites Rechteck

Indikator des Tick-Volumens, ausgestattet mit einem Benachrichtigungssystem und der Möglichkeit, plötzliche und signifikante Veränderungen der Preise der Balken im Verhältnis zum angegebenen Koeffizienten - Change Factor - zum Durchschnittswert des Volumens für einen bestimmten Zeitraum (Period Signal) und den Balken der vorherigen Handelssitzung zu überwachen. Die Farbe des Histogramms des Indikators charakterisiert die Veränderungen des Volumens eines Balkens: 1 - relativ zur vorherigen Sitzun

Mit Ants Lite ATR können Sie Ihre Trades auf der Grundlage der Marktvolatilität eingeben und verwalten, was Ihnen sicherere Eingänge und bessere Ausgänge ermöglicht. Basierend auf der Arbeit von Daryl Guppy.
Funktionen Möglichkeit, den Bar zu definieren, ab dem die Long- und Short-Berechnung beginnt. Kann verwendet werden, um sowohl Einstiegs- als auch Ausstiegssignale zu generieren. Anpassbare ATR-Periode und Multiplikator. GMMA ist ein bewährter Indikator mit einem langen Stammbaum. Volatilit

Folding rule von 4 Trendlinien Der Indikator wurde auf der Grundlage der Handelsstrategie "Zollstock" erstellt. Er zeigt vier Paare von geneigten Widerstands- und Unterstützungslinien an. Diese Linien werden auf der Grundlage des nächstgelegenen Hochs und Tiefs des technischen Indikators ZigZag mit vier vorgegebenen Eingabeparametern gezeichnet. Der Indikator zeichnet Punkte über und unter den Kursextremen, die für die Darstellung der Trendlinien verwendet wurden. Der Trendlinienindikator erleic

Das Marktprofil hilft dem Händler, das Verhalten der wichtigsten Marktteilnehmer zu erkennen und Zonen von deren Interesse zu definieren. Das Hauptmerkmal ist die klare grafische Darstellung des Preisaktionsbereichs, in dem 70 % der Trades durchgeführt wurden. Das Verständnis der Lage von Volumenakkumulationsbereichen kann dem Händler helfen, die Erfolgswahrscheinlichkeit zu erhöhen. Das Tool kann sowohl als eigenständiges System als auch in Kombination mit anderen Indikatoren und Handelssysteme

Supporta ist ein Handelsindikator, der automatisch Unterstützungs- und Widerstandsniveaus und deren Stärke anhand von Kursbewegungen identifiziert und diese auf Kurscharts einzeichnet. Das Instrument unterstützt sowohl den MetaTrader 4 als auch den MetaTrader 5 und kann für jedes Finanzinstrument und jeden Zeitrahmen verwendet werden. Die MetaTrader 5-Version ist unter dem Namen Supporta MT5 auf dem Markt erhältlich. Eine ausführliche Dokumentation und einen Schnellstart finden Sie im offizielle

Dieser Indikator unterscheidet sich vom herkömmlichen Indikator durch einen zusätzlichen Satz von Parametern. Die ADX-Linie ändert ihre Farbe in Abhängigkeit von der Position der +DI- und -DI-Linien zueinander.
Indikator-Eingaben Zeitraum - Berechnungszeitraum des Indikators; Methode - Wählen Sie die Mittelungsmethode: einfach, exponentiell, geglättet, linear gewichtet; Anwenden auf - Wählen Sie den anzuwendenden Kurs: Close, Open; High; Low; Median; Typical; Average Weighted; Standardmäßig wer
Der True Channel Indikator bildet den linearen Regressionskanal. Der Kanal besteht aus den Unterstützungs-/Widerstandslinien sowie der durchschnittlichen Trendlinie.
Zusätzliche Informationen, die der Indikator anzeigt Unterstützungs-/Widerstandskurs für den aktuellen Balken Breite des Kanals Kanalneigung aktuelle Kursposition relativ zum Kanal in %
Optionen Balken für die Berechnung - Anzahl der Balken für den Aufbau des Kanals Preis für die Berechnung - Preis, der für die Konstruktion der Ka

NN8D Points ist einer der Indikatoren, die im NN8D (Nikolsky 's Nesting Doll ) Handelssystem enthalten sind. NN8D Points ist ein Indikator, der mehrere Werkzeuge zur Analyse des Forex-Marktes enthält: Kerzenanalyse und Bereichssystem. Anstelle einer einfachen Mittelwertbildung nach Eröffnungs-, Schluss-, Höchst- und Tiefstkursen führt NN8D Points eine komplexe Analyse der aktuellen und vorherigen Balken anhand verschiedener Parameter durch: Farbe des Balkens; Größe des Balkenkörpers; Dochte des

Dieser Indikator warnt vor potenziellen Käufen und Verkäufen anhand des exponentiellen gleitenden Durchschnitts. Der Indikator unterstützt Push-Benachrichtigungen, Terminal-Warnungen und akustische Warnungen. Ich bin ein aktiver Entwickler, der Forex studiert und werde diesen Indikator weiterhin mit neuen Funktionen aktualisieren. Er ist anpassbar für einminütige, fünfminütige, fünfzehnminütige, dreißigminütige, einstündige, vierstündige, tägliche, wöchentliche und monatliche Zeitrahmen.
Empfeh
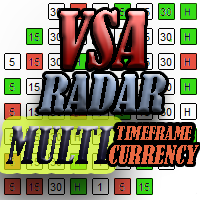
Das Panel funktioniert wie ein Filter, der Muster auf der Grundlage der Volume Spread Analysis-Technik findet. Die Suche wird für ausgewählte Handelsinstrumente und alle verfügbaren Zeitrahmen durchgeführt. Es ist möglich, Instrumente hinzuzufügen und zu entfernen. Wenn Sie auf die Schaltfläche "Signal" klicken, können Sie schnell zu dem Diagramm mit dem identifizierten Muster und Zeitrahmen wechseln. Mit den Schaltflächen "<<" und ">>" können Sie auch in der Historie (nach vorherigen Bars) such

Dieser Indikator zeigt Bollinger Bandsignale für mehrere Symbole und mehrere Zeitrahmen an. Die Signale werden als einfache Verhältniszahlen erstellt, die den Abstand zwischen dem aktuellen Kurs und dem gleitenden Durchschnitt, gemessen in Standardabweichungen, darstellen. Auf diese Weise schaffen wir einen sehr vielseitigen und einfach zu bedienenden Indikator, der uns hilft, nicht nur die stärksten Trends zu erkennen, sondern auch die am meisten überkauften und überverkauften Bedingungen.
Mer

Miet-/Lifetime-Paket Optionen und Privilegien'
Miete Monatlich Sechs Monate Jährlich/Lebenszeit Weis Wave mit Geschwindigkeit mit Alert+Speed Index x x x Manuell x x x Video zur Schnelleinrichtung x x x Blog x x x Lifetime-Updates x x x Einrichtungs- und Schulungsmaterial
x x Rechteckbruch-Warnwerkzeug x Discord-Zugangskanal "Die SI-Händler"
x Infos zum Handel unter : http://www.tradethevolumewaves.com ** Wenn Sie kaufen, kontaktieren Sie mich bitte, um Ihren : Trainingsraum und vollständi

Dieser Indikator wurde entwickelt, um die besten aller Candlestick-Umkehrmuster zu erkennen: Three Line Strike . Laut dem Bestseller-Autor und Candlestick-Guru Thomas Bullkowski hat dieses Muster eine Gewinnquote zwischen 65% und 84% . Diese KOSTENLOSE Version des Scanners scannt nur EURUSD und GBPUSD. Die Vollversion des Scanners finden Sie hier: Three Line Strike Scanner 30 Instrumente Dieser Indikator scannt für Sie bis zu 30 Instrumente (Forex, Indizes oder Rohstoffe) auf bis zu 8 Zeitrahmen
FREE

Dieser Indikator zeigt Verhältnisse zwischen Extremen auf dem Chart an. Sie können Ihre eigenen Verhältnisse angeben (z.B. Fibonacci).
Parameter Wichtigste Parameter Dichte - wie sehr in Details, um Verhältnisse in Extremen zu suchen. Eine größere Zahl bedeutet weniger Details, eine kleinere Zahl bedeutet mehr Details. Die Basiseinheit ist 1 Balken im Diagramm. Historie - wie weit man bei der Suche in der Historie gehen soll. Wenn Sie -1 einstellen, verarbeitet der Indikator alle Balken aus der
FREE
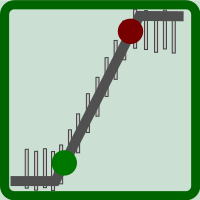
Dieser Indikator dient dazu, den Beginn des Trends darzustellen (dies sind die grünen und roten Punkte der Grafik). Er wird als einfach bezeichnet, weil es nur wenige Setup-Parameter gibt, aber er ist im Wesentlichen eine Reihe von Regeln - er verwendet eine Kombination aus WATR und einer Reihe von MAs. Durch die Kombination ihrer Messwerte wird die Richtung des Trends bestimmt.
Wie wird er angewendet? Wenn auf der Hauptlinie des Indikators grüne Punkte zu sehen sind, ist der Trend aufwärts ger
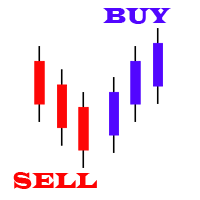
Price Action ist eines der beliebtesten Handelskonzepte. Candlestick-Muster sind ein unverzichtbares Instrument für jeden Price-Action-Händler. Ein Candlestick-Muster ist ein ein- oder manchmal mehrbalkiges Preisaktionsmuster, das grafisch auf einem Candlestick-Diagramm dargestellt wird und von Price-Action-Händlern zur Vorhersage verwendet wird.
Eingabe-Parameter On Alert - true/false (zeigt eine Meldung in einem separaten Fenster an). Patterns Reverse - true/false (erlaubt die Anzeige der rüc

Der Indikator zeigt die obere, mittlere und untere Preisgrenze für einen bestimmten Zeitraum an. Außerdem werden zwei gleitende Durchschnitte (MAs) angezeigt.
Parameter
CTType : Korridor Basis. Stunde : Stunden, _Tag : Tage, _Balken : Balken CTPrice : Preistyp, nach Balken. OpenClose : Eröffnungs-/Schlusskurse, HighLow : Höchst-/Tiefstkurse CTShift : Korridorverschiebung CTNum : Anzahl der zu berücksichtigenden Korridore, mindestens 2 CTPeriodFast : Schneller Zeitraum, mindestens 2 CTShiftFast

Indikator des Tick-Volumens mit der Möglichkeit, plötzliche und signifikante Änderungen der Preise von Bars im Verhältnis zum angegebenen Koeffizienten - Change Factor - zu überwachen. Die Farbe des Histogramms des Indikators charakterisiert die Veränderungen des Volumens eines Balkens im Vergleich zur vorherigen Sitzung. Standardmäßig sind die Balken des Indikators in den folgenden Farben gefärbt: Grün - ein leichter Anstieg des Volumens, der den Änderungsfaktor nicht überschreitet; Rot - ein l
Indikator des Tick-Volumens mit der Fähigkeit, plötzliche und signifikante Veränderungen in den Preisen der Balken in Bezug auf den angegebenen Koeffizienten zu überwachen - Change Factor - auf den Durchschnittswert des Volumens für einen bestimmten Zeitraum - Period Signal. Die Farbe des Histogramms des Indikators charakterisiert die Veränderungen des Volumens eines Balkens im Vergleich zur vorherigen Sitzung und der Signallinie.
Eingaben des Indikators Period Signal - Periode der Signallinie;

Der ForexAurum Fibonacci-Indikator ist ein nützliches Werkzeug für Händler, die Fibonacci in Kombination mit den ZigZag-Indikatoren verwenden. Er verwendet die Echtzeitberechnung der Niveaus für alle Zeitrahmen und zeigt die Ergebnisse für Sie an. Zusätzlich können Sie RSI-, ADX- und Stochastik-Indikatoren einrichten, um den Einstieg zu bestätigen.
Wie man es benutzt Ziehen Sie den Indikator einfach auf ein 1-Minuten-Diagramm eines beliebigen Symbols und legen Sie ihn dort ab. Dann können Sie n
Wühlmaus-Indikator Funktionsprinzipien Er basiert auf den Standardindikatoren des MetaTrader 4 Terminals. Er zeigt die Einstiegspunkte in den Markt an.
Wie man handelt Wenn ein Balken vollständig ist und ein Pfeil angezeigt wird, platzieren Sie eine BuyStop-Order auf dem Hoch des Balkens, wenn der Pfeil grün ist, oder eine SellStop-Order auf dem Tief des Balkens, wenn der Pfeil rot ist. StopLoss sollte auf dem Niveau des letzten abwärts gerichteten Fraktals unterhalb des Einstiegspunktes bei e

NN8D Volume ist einer der Indikatoren des NN8D Handelssystems (Nikolsky 's Nesting Doll ). NN8D Volume zeigt eine Trendrichtung an, indem es das Marktrauschen aussortiert und Trades auch während Haupttrendkorrekturen beibehält. Kauf-Checkliste: Bullen auf dem aktuellen Balken und vorzugsweise auf dem vorherigen. Die NN8D-Volumen-Linie sollte sich von den Bullen-Punkten weg nach oben bewegen, was einen Aufwärtstrend und eine Zunahme der Volatilität anzeigt. Aktueller Balken - Kaufen (ein offener

Der Indikator hilft Ihnen, nach den Methoden der VSA (Volume Spread Analysis) und der PRICE ACTION zu handeln und diese Methoden perspektivisch zu studieren. Der Indikator sucht nach VSA- und PRICE ACTION-Mustern unter Berücksichtigung des aktuellen Trends. Es ist möglich, die Muster des höheren Zeitrahmens auf dem aktuellen Zeitrahmen-Chart zu sehen. Der benutzerdefinierte Modus ermöglicht es Ihnen, Ihre Muster auf der Grundlage der VSA-Methode zu finden. Außerdem gibt es ein Volumenhistogramm,


Sind Sie es leid, von Spikes und Peitschen gejagt zu werden?
Werden Sie nicht zum Opfer der erratischen Bewegungen des Marktes... Tun Sie etwas dagegen!
Treffen Sie sofort klügere Entscheidungen mit der präzisen Balance aus Filtern und genauen Statistiken von Impulse Pro.
Timing ist alles im Handel
Um mehr zu erfahren, besuchen Sie bitte www.mql5.com/en/blogs/post/718212 Antizipieren Sie die nächste große Bewegung, bevor sie sich entfaltet, in 3 einfachen Schritten!
Vorteile, die Sie erhal

Das Tool dient zur Berechnung der Größe der Position, die mit dem zuvor angenommenen Risiko eröffnet werden kann. Das Risiko kann definiert werden als: Prozentualer Wert des Kontos (%), Nominalwert, ausgedrückt in der Kontowährung. Die Größe der Position wird durch den Abstand der geplanten SL (rote Linie) bestimmt.
Eingabeparameter Lost_in_Money - wenn true, wird der Wert des akzeptablen Verlustes durch den Parameter "Acceptable_loss" bestimmt, ansonsten wird der akzeptable Verlust durch den P

Der Blahtech Moving Average Indikator ist eine Multitimeframe Version des Standard Moving Average Indikators. Er ist außerdem mit anpassbaren Alarmen, Periodenbrüchen und anderen Konfigurationsoptionen ausgestattet. Die gleitenden Durchschnitte der 50- und 200-Tage-Linie werden von Anlegern und Händlern häufig verfolgt, wobei Durchbrüche über und unter den MA-Linien als interessante Signale gelten. Links [ Installieren | Aktualisieren | Training | Alle Produkte ]
Funktions-Highlights Bis zu dre
FREE

Market Insider ist ein hervorragender Indikator für das Scalping des Trends und den Handel mit Marktausbrüchen und Umkehrungen. Er basiert auf einem ATR gemessenen Volatilitätskanal und dem CCI-Indikator . Die grüne Trendlinie und die grünen Balken zeigen einen Aufwärtstrend an, während die rote Trendlinie und die roten Balken einen Abwärtstrend anzeigen. Ein intensiver Preisdurchbruch einiger der Trendlinien deutet auf einen Marktdurchbruch und einen potenziellen neuen Gegentrend hin. In Märkte
FREE

Der Analytic Trade Indikator ist ein komplettes Handelssystem. Er besteht aus 4 Teilen: Der erste Teil sind die Pfeile, die die optimalen Punkte für die Eröffnung und Schließung von Aufträgen anzeigen. Der Pfeil nach oben steht für ein Kaufsignal, der Pfeil nach unten für ein Verkaufssignal. Der zweite Teil ist das Informationsfeld in der oberen rechten Ecke. Der aktuelle Kurs wird in größerer Schrift angezeigt, darüber befinden sich: der Tageshöchstkurs, der Abstand zwischen dem aktuellen Kurs

Zuverlässige SMA-Umkehrsignale. Kein Neulackieren. Einfache Einstellungen. Geeignet für binäre Optionen. Für maximalen Komfort der Trader gemacht. Der Indikator führt eine komplexe Analyse einer Kursbewegung relativ zum SMA durch und zeigt das Feld an, auf das höchstwahrscheinlich ein Kursimpuls und eine SMA-Umkehr folgen wird. Interne Sortiermechanismen sortieren definitiv späte, unzuverlässige oder ineffiziente Eingaben aus.
Optionen
SMA_PERIOD - die betrachtete SMA-Periode sollte nicht klein

ForexGumpUltra ist ein neuer und fortgeschrittener Indikator aus der ForexGump-Serie. Dieser Indikator bestimmt auf einfache Weise die Kursrichtung für jedes Währungspaar und jeden Zeitrahmen. Der Indikator zeichnet seine Signale auf dem Null-Balken und zeichnet sie nicht neu (siehe das Video). In der 34. Sekunde des Videos ist zu sehen, dass dieser Indikator neue Filter verwendet, um die Änderungen in der Richtung der Preisbewegung ohne Verzögerung zu bestimmen, trotz des gegenwärtigen Marktrau
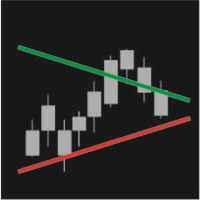
IntradayTrack zeigt täglich Unterstützungs- und Widerstandslinien an, die auf der durchschnittlichen Symbolvolatilität für einen bestimmten Zeitraum basieren. Sie können die Linie sowohl am Anfang als auch am Ende einer Handelsperiode in einem bestimmten Winkel neigen.
Parameter Track-Periode - der Zeitraum, in dem die Linien gezeichnet werden (Tag, Woche, Monat) Avg price range - Anzahl der Tage, für die die durchschnittliche Volatilität berücksichtigt wird
Startwert (Avg %) - Abstand zwischen

Trend-Scanner ist ein Indikator für MetaTrader 4 , mit dem Sie 3 Arten von Trends und Signalen auf den Charts sehen können. Trend-Scanner sucht nach 3 Arten von Handelssignalen für alle Basiswerte, die in den Einstellungen aufgeführt sind (und vom Trader angepasst werden können). Wenn es Bedingungen gibt, die es Ihnen erlauben, zuverlässige Trends zu erkennen, wird ein Pop-up-Alarm angezeigt, eine akustische Benachrichtigung und eine Push-Benachrichtigung gesendet. Trend-Scanner sucht ständig na

Dieser Indikator basiert auf den Bollinger Bändern auf einem oder mehreren Zeitrahmen und auf einem beliebigen Währungspaar (Cross Pair). Der Indikator erzeugt eine Warnmeldung, wenn er ein Kauf- oder Verkaufssignal feststellt. Außerdem zeichnet er einen vertikalen Balken auf dem Preisdiagramm: grün für Kauf oder rot für Verkauf, weiß, wenn er flach ist. Warnmeldungen und vertikale Balken für KAUF oder VERKAUF werden generiert, wenn die Bollinger Bänder für alle gewählten Zeitrahmen konsistent s

PriceChannel ist für die Trenderkennung ohne den Effekt von zufälligen Kurssprüngen konzipiert. Es verwendet Preisreihen und einige gleitende Durchschnitte zur Rauschunterdrückung. Er funktioniert auf mehreren Zeitrahmen, sogar auf M1. Um die Effektivität zu erhöhen, empfiehlt es sich, 3 Instanzen von PriceChannel mit unterschiedlichen Parametern auf einem Chart zu verwenden (siehe Screenshots). Sie können die folgenden Einstellungen verwenden (für M1-Charts): PriceChannel(10,2,30) Farbe Gold .
Das Prinzip dieses Indikators ist sehr einfach: Er erkennt den Trend mit dem gleitenden Durchschnitt, überwacht dann den Rückkehrpunkt des Graphen mit Hilfe der Kreuzung des Stochastik-Oszillators und sagt schließlich KAUF- und VERKAUFssignale mit Pfeilen, Warnungen und Benachrichtigungen voraus. Die Parameter sind festgelegt und werden automatisch für jeden Zeitrahmen berechnet. Beispiel:
Wenn Sie den Indikator auf EURUSD, Zeitrahmen M5, installieren: der Indikator wird den Haupttrend mit dem g
" MONALISA (Akronym für MONitor And LISt All ) Stochastic" ist ein Indikator, der auf dem stochastischen Oszillator auf allen Zeitrahmen eines beliebigen Währungspaares basiert. Der Indikator zeigt alle Zeitrahmen (von M1 bis MN1) an und färbt denjenigen Zeitrahmen in GRÜN oder ROT, der auf der Grundlage des Stochastik-Oszillators zu KAUFEN oder VERKAUFEN führt. Dieser Indikator ist nützlich, weil er Ihnen einen vollständigen Überblick über alle Timeframes zur gleichen Zeit ermöglicht.
Merkmale
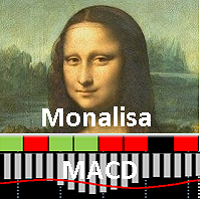
" MONALISA (Akronym für MONitor And LISt All ) MACD" ist ein Indikator, der auf dem MACD Oszillator auf allen Zeitrahmen eines beliebigen Währungspaares basiert. Der Indikator zeigt alle Zeitrahmen (von M1 bis MN1) an und färbt denjenigen Zeitrahmen in GRÜN oder ROT, der auf der Grundlage des MACD-Oszillators zu KAUFEN oder VERKAUFEN führt. Dieser Indikator ist nützlich, weil er Ihnen einen vollständigen Überblick über alle Timeframes zur gleichen Zeit ermöglicht.
Eigenschaften Einfache und fle
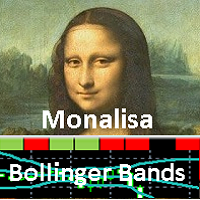
" MONALISA (Akronym für MONitor And LISt All ) Bollinger Bands" ist ein Indikator, der auf dem Bollinger Bands Indikator auf allen Zeitrahmen eines beliebigen Währungspaares basiert. Der Indikator zeigt alle Zeitrahmen (von M1 bis MN1) an und färbt denjenigen Zeitrahmen in GRÜN oder ROT, der auf der Grundlage des Bollinger Bands Indikators zu KAUFEN oder VERKAUFEN führt. Darüber hinaus misst dieser Indikator die "KRAFT " des Trends, die auf der mittleren Linie der Bollinger Bänder (SMA-Linie) un

We-Point ist ein Indikator für MT4, der Händlern hilft, Charts zu lesen und den Beschleunigungspunkt des Trends zu untersuchen.
Der We-Point-Indikator ist ein nützliches Instrument für Händler, die die Richtung eines Basiswerts untersuchen möchten. Der We-Point-Indikator verwendet eine mathematische Formel, die Punkte in Rot (die einen Abwärtstrend anzeigen) und in Grün (die einen Aufwärtstrend anzeigen) erzeugt. Wenn ein grüner (oder roter) Punkt auf dem Chart erscheint, erhält der Händler ein
Es ist ein Werkzeug für die technische Analyse. Es erlaubt Ihnen, Messungen durchzuführen: Fibo, einschließlich der Suche nach Clustern Fibo Ebenen (durch die DiNapoli-Methode) Überschreitung des Gleichgewichts Trendlinie Auswahl der S/D-Levels
Eingabeparameter Trend_Color - Farbe der Trendlinie Trend_Width - Breite der Trendlinie Trend_info - wenn true, werden neben der Trendlinie zusätzliche Informationen angezeigt (low, high, medium der Trendlinie) Trend_info_color_up_dn - Farbe des Textes,
Der Indikator ermöglicht die Messung und Analyse des akkumulierten Volumens (Tick) in einem beliebig gewählten Swing. Die Aufgabe des Benutzers besteht darin, einzelne Messabschnitte mit Hilfe eines "Buntstifts" zu markieren. Der Indikator summiert automatisch die Volumina der einzelnen Kerzen. Die Volumenanalyse ist ein Grundelement der VSA-Technik (Volume Spread Analysis). Eine Methode zur Verwendung des Indikators wird in der Folie gezeigt.
Parameter Beschreibung Anchor_mode - Wenn true, wir

Der Blahtech Fisher Transform Indikator ist ein Oszillator, der überkaufte und überverkaufte Positionen auf dem Chart anzeigt. Der Fisher-Transform-Algorithmus wandelt Kurse mit beliebiger Verteilungsform in eine Normalverteilung um. Das Endergebnis ist eine Kurve mit scharfen Wendepunkten, die helfen kann, Aufwärts- oder Abwärtstrends zu erkennen. Fisher-Transform-Werte von mehr als 1,66 auf dem Tages-Chart gelten als gute Bereiche für Umkehrgeschäfte. Links [ Installieren | Aktualisieren | Tra

Pfeilindikator mit variablem Parabolic SAR und EMA für tendenzielle Märkte . Zeigt an, dass sich ein Trend etabliert hat und dass er sich fortsetzt , was Ihnen ermöglicht, auf lange Trends zu setzen oder zu skalieren. Entwickelt für: Scalping Intraday-Handel Langfristiger Handel Effektiv für: Währungspaare Indizes Öl Silber Gold Kryptowährungen Empfohlene Zeitrahmen: H1 H4 Täglich Wöchentlich Monatlich Für kürzere Zeitrahmen passen Sie bitte die vollständig anpassbaren Einstellungen an. Testen S

Dieser Multi-Indikator/Oszillator (im Folgenden Indikator), der mehrere Zeitrahmen und Symbole umfasst, erkennt, wenn eine Divergenz zwischen dem Preis und einem, zwei oder drei Indikatoren auftritt. Er identifiziert sowohl regelmäßige/klassische (Trendumkehr) als auch versteckte (Trendfortsetzung) Divergenzen. Er verfügt über RSI- und MA-Trendfilteroptionen, die es ermöglichen, nur die stärksten Setups herauszufiltern. In Kombination mit Ihren eigenen Regeln und Techniken können Sie mit diesem

Indikator, der die Analyse der Beziehung zwischen zwei Derivaten ermöglicht. Es gibt verschiedene Methoden der Darstellung der Beziehung. Das beigefügte Video zeigt die gesamte Funktionalität des Indikators.
Eingabeparameter Anchor_mode - setzt das Ende der Messung auf die aktuelle Kerze. Follow_mode - wenn true, folgt der Beginn der Messung (START-Linie) in einem festen Abstand nach ihrem Ende (END-Linie). Follow_distance - Abstand (in Kerzen) zwischen dem Beginn und dem Ende der Messung. Ist
Der Omega-Trend-Indikator ist ein fortschrittliches Instrument, das speziell entwickelt wurde, um Markttrends frühzeitig zu erkennen und ihnen effizient zu folgen. Der Indikator zeichnet zwei Linien. Die Haupttrendlinie (dicker) stellt die mutmaßliche untere oder obere Volatilitätsgrenze des aktuellen Markttrends dar. Ein Bruch der Haupttrendlinie deutet auf eine mögliche Umkehr oder Verschiebung der Trendbewegung hin. Die Trendlinie zeigt auch den besten Punkt für die Platzierung einer Stop-Los
FREE

Indikator für vertikale Linien in den Zeitrahmen М5 und М1. Er zeichnet die Linien für den Zeitraum des aktuellen Tages und des Vortages. Dieser Indikator zeigt dem Händler visuell den Beginn und das Ende der Chart-Stunde, sowie die vergangenen stündlichen Perioden, 30-Minuten- und 5-Minuten-Chart-Intervalle. Der Vorteil dieses Indikators besteht darin, dass der Händler, der diesen Indikator auf einem Chart eines Währungspaares mit einem kleineren Zeitrahmen verwendet, immer weiß, wann die neue
FREE
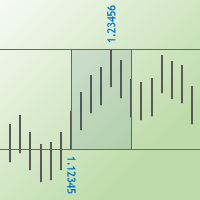
Der Indikator Max Min Prices One ermittelt die Maximal- und Minimalpreise zwischen zwei Kerzen und zeigt sie als Rechteck im Preisdiagramm an. Sie können die Preiswerte und ihre Niveaus auch als horizontale Linien anzeigen.
Parameter Start bar time - Zeit der Startkerze End bar time - Zeitpunkt der Endkerze Rectangle filling - füllt das Rechteck mit Farbe Is show max and min prices - zeigt die Beschriftungen der Höchst- und Tiefstkurse an Zeigt horizontale Linien an - zeigt die Niveaus der Höch

Jerus Line Scalper ist ein Indikator für Scalping auf die Paare EURUSD, GBPUSD, AUDUSD, USDJPY und USDCAD. Empfohlene Paare: M5, M15, M30 und H1. Die Handelsstrategie ist wie folgt: Sobald der Pfeil erscheint, eröffnen Sie eine Order in Richtung des Pfeils und setzen Sie den Take Profit auf +10 Punkte. Setzen Sie den Stop-Loss auf die Stop-Linie des Indikators. Die Stop-Linie wird je nach Signal des Indikators in rot oder blau angezeigt. Auch das Martingale-System kann im System angewendet werde
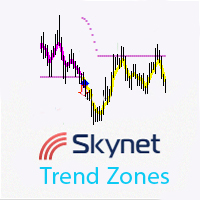
Skynet Trend Zones basiert auf klassischen Indikatoren und einigen mathematischen Berechnungen und funktioniert unter verschiedenen Marktbedingungen zur Anzeige des Trends. Das Funktionsprinzip ist wie folgt: Wenn sich der Preis in einer Spanne bewegt, wird eine flache Linie unter oder über dem Preis angezeigt, je nach vorherigem Trend; wenn sich der Preis nach unten oder oben bewegt, ohne dass es zu einem Rollback kommt, wird eine Linie in einem Winkel zum Preis angezeigt, und wenn es zu einem

Dieser Indikator basiert auf dem MACD auf einem oder mehreren Zeitrahmen und auf einem beliebigen Währungspaar (Cross Pair). Der Indikator erzeugt eine Warnmeldung, wenn er ein Kauf- oder Verkaufssignal feststellt. Außerdem zeichnet er einen vertikalen Balken auf dem Preisdiagramm: grün für Kauf oder rot für Verkauf, gelb, wenn der Wert gleich bleibt. Warnmeldungen und vertikale Balken für KAUF oder VERKAUF werden generiert, wenn der MACD für alle gewählten Zeitrahmen konsistent ist , andernfall

Der Viper Trend-Indikator ist ein Indikator zum Auffinden von Trends. Er verwendet einen gleitenden Durchschnitt, eine Reihe von Kerzenkombinationen und Hoch/Tief-Stufen, um Trends zu finden. Dieser Indikator ist ein vollständiges Handelssystem. Sie können mit diesem Indikator handeln, wie Sie möchten.
Merkmale und Empfehlungen Sie können diesen Indikator für alle Paare verwenden, außer für die volatilen Paare. Es wird empfohlen, ihn auf M15- und höheren Charts zu verwenden. Das wichtigste Elem
Dieser Candlestick-Indikator sucht nach Candlesticks, bei denen die Richtung auf allen ausgewählten Zeitebenen (M1, M5, M15, M30, H1, H4, D1, W1, MN) übereinstimmt. Zum Beispiel, wenn die Kerze auf allen Zeitebenen steigt (bullish) oder fällt (bearish). Sie können: Die Anzeige nicht benötigter Pfeile ausschalten und z.B. nur diejenigen anzeigen lassen, die Änderungen der Signalrichtung anzeigen, d.h. nur den ersten Pfeil in jeder Richtung. Legen Sie die Kerze für das Signal fest: die Nullkerze o

PivotSupportResistance Dieser Indikator zeichnet horizontale Linien an den täglichen Pivot-Levels R3, R2, R1, Pivot, S1, S2, S3, wobei R für Resistance und S für Support steht. Dieser Indikator kann auf jede Chart-Periode angewendet werden, obwohl tägliche Pivots auf Charts mit langen Perioden bedeutungslos sind (wenn Sie Ihren Chart-Zeitrahmen auf einen größeren als den täglichen Chart umstellen, erhalten Sie eine Warnung und der Indikator wird nicht funktionieren). Die Beschriftungen werden fü

Der Fibonacci-Ziel-Indikator ist ein Indikator, der das Tief, das Hoch und die Fibonacci-Ebenen verwendet. Dieser Indikator hat die Fähigkeit, das Ziel vorherzusagen. Er versucht, das Ziel zu bestimmen, das der Graph im Durchschnitt erreichen wird, und zeichnet eine Zielregion. Der Indikator dient auch als Oszillator. Er kann als Trendoszillator verwendet werden, nachdem die erforderlichen Einstellungen vorgenommen wurden. Dieser Indikator ist hilfreich für Ihre Strategie. Er kann keine Signale

Triple bietet Ihnen drei großartige Indikatoren in einem: Commodity Chanel Index (CCI) Exponentielle gleitende Durchschnitte (EMAs) x 3 Relative Stärke Index (RSI)
Wie der Indikator funktioniert Der Indikator zeigt ein Raster von 3 verschiedenen Indikatoren an und stellt sie auf einer Skala von rot (bärisch) bis dunkelgrün (bullisch) dar. Mit einer klaren und leicht ablesbaren Anzeigemetrik mit 5 verschiedenen Farben für jeden Indikator. Dunkelgrün - stark bullisch Hellgrün - Bullisch Gelb - Gl
Beschreibung: - Chart Time + Indicator ist sehr einfach und leicht, aber es kann sehr wichtig sein, die Zeit zu kontrollieren, bevor man einen manuellen Handel eröffnet. Dieser Indikator zeigt die Zeit in einem Panel zwischen 3 verschiedenen Optionen. Es ist möglich, das Panel mit der Maus oder mit festen Koordinaten auf dem Chart zu verschieben. Eingabe-Parameter: - Lokale Zeit : Aktivieren Sie die lokale Zeit, wenn Sie diese anzeigen möchten (Personal Computer Time). - Server-Zeit : Aktiviere

Dieser Indikator zeigt die letzten unberührten Unterstützungen und Widerstände als horizontale Linien an. Der Indikator kann Unterstützung/Widerstand von höheren Zeitrahmen anzeigen. Mit diesem Indikator können Sie z.B. leicht die Unterstützung/Widerstände der Zeitrahmen H4, D1 und W1 auf einem H1-Chart sehen, was ein großer Vorteil sein kann, wenn Sie Ihren Einstieg auf H1 timen. Dies ist die KOSTENLOSE Version des Indikators: Unterstützung-Widerstand-Multi-Zeitrahmen Die kostenlose Version fun
FREE

Dieser einfache Informationsindikator zeigt den Namen des aktuellen Tages und der vergangenen Arbeitstage, Monate und Jahre an.
Über den Begriff der Zeit und des Zeitrahmens Es ist allgemein bekannt, dass ein Zeitrahmen ein Zeitintervall ist, das in der technischen Analyse der freien Finanzmärkte betrachtet wird und in dem sich die Preise und andere Marktdaten ändern, wenn die Kurscharts dargestellt werden. Im MetaTrader 4-Handelsterminal werden diese Zeiträume durch eine vertikale gestrichelte
FREE

Dieser Indikator zeigt die letzten unberührten Unterstützungen und Widerstände als horizontale Linien an. Der Indikator kann Unterstützung/Widerstand von höheren Zeitrahmen anzeigen. Mit diesem Indikator können Sie z.B. leicht die Unterstützung/Widerstände der Zeitrahmen H4, D1 und W1 auf einem H1-Chart sehen, was ein großer Vorteil sein kann, wenn Sie Ihren Einstieg auf H1 timen. Dies ist die FULL-Version des Indikators: Unterstützung/Widerstand Multi Time Frame FREE
Parameter referenceTF: der

Es ist ein weiterer einfacher Informationsindikator. Dieser Indikator zeigt den aktuellen Spread eines Finanzinstruments und den Wert eines Punktes bei einem Volumen von 0,10 Lot.
Über den Spread Der Spread ist die Differenz zwischen dem Brief- und dem Geldkurs eines Vermögenswerts an der Börse oder an der Währung. Beziehen wir uns auf die Zentralbanken und den Währungsumtausch in diesen Banken, um zu verstehen, warum der Spread beim Währungshandel so wichtig ist. In Zentralbanken sehen wir imm
FREE

Der Bollinger Bands Oszillator ist ein Oszillator, der auf der Strategie "Mastering the Trade" von John Carter basiert. Die Strategie zielt darauf ab, die Bewegung von niedriger zu hoher Volatilität zu verfolgen. Der Bollinger Bands Oszillator misst das Momentum des Marktes. Wenn die Volatilität zunimmt, dehnen sich die Bollinger Bands aus und umkreisen den Keltner-Kanal. Der Bollinger Bands Oscillator verwendet Bollinger Bands und Keltner Channel. Der Momentum-Indikator wird auch als Bestätigun
Erfahren Sie, wie man einen Handelsroboter im MetaTrader AppStore, dem Shop für Applikationen für die MetaTrader Handelsplattform, kaufen kann.
Das Zahlungssystem der MQL5.community ermöglicht Zahlungen mit PayPal, Kreditkarten und den gängigen Zahlungssystemen. Wir empfehlen Ihnen eindringlich, Handelsroboter vor dem Kauf zu testen, um eine bessere Vorstellung von dem Produkt zu bekommen.
Sie verpassen Handelsmöglichkeiten:
- Freie Handelsapplikationen
- Über 8.000 Signale zum Kopieren
- Wirtschaftsnachrichten für die Lage an den Finanzmärkte
Registrierung
Einloggen
Wenn Sie kein Benutzerkonto haben, registrieren Sie sich
Erlauben Sie die Verwendung von Cookies, um sich auf der Website MQL5.com anzumelden.
Bitte aktivieren Sie die notwendige Einstellung in Ihrem Browser, da Sie sich sonst nicht einloggen können.