Historical Day Levels
- Indikatoren
- Version: 1.2
- Aktivierungen: 5

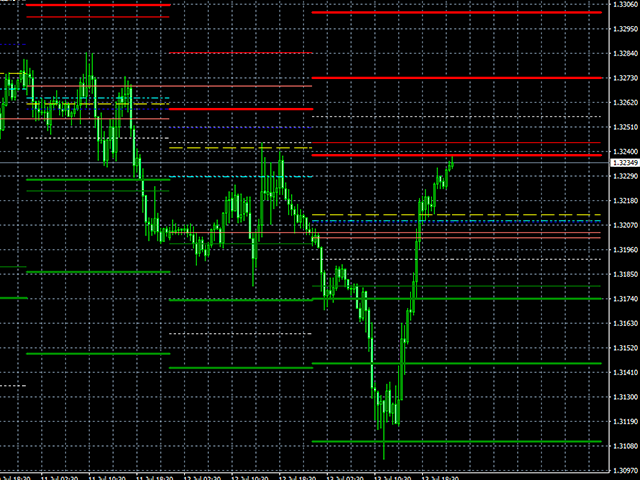
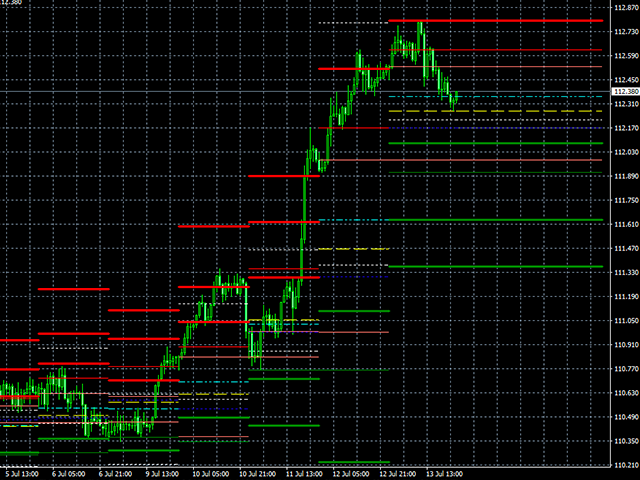
Der Indikator bildet die folgenden historischen Tagesniveaus
- Widerstandsniveaus - ein Preisniveau, über dem es für ein Wertpapier oder einen Markt angeblich schwierig ist, zu steigen:
- R3 Day - täglicher Widerstandskurs #3;
- R2 Tag - täglicher Widerstandskurs #2;
- R1 Tag - täglicher Widerstandskurs #1;
- Unterstützungsniveaus - ein Preisniveau, unter dem es für ein Wertpapier oder einen Markt schwierig ist, zu fallen.
- S1 Tag - tägliche Unterstützungslinie Preis #1;
- S2 Tag - tägliche Unterstützungslinie Preis #2;
- S3 Tag - tägliche Unterstützungslinie Preis #3;
- Extremwerte - Höchst- und Mindestpreis eines Tages:
- High Day - maximaler Tagespreis;
- Low Day - minimaler Tagespreis;
- Forecast Extremes Levels - maximaler und minimaler prognostizierter Tagespreis:
- Projekt Hoher Tag - maximaler prognostizierter Tagespreis;
- Project Low Day - minimaler prognostizierter Tagespreis;
- Middle Day - mittlerer Tagespreis;
- Periodenniveaus - ein Eröffnungs- und Schlusskurs des Tages:
- Open Day - geöffneter Tagespreis;
- Close Day - geschlossener Tagespreis;
- Direkter Tag - prognostizierte Richtung eines Tagespreises;
- Redirect Day - Tagespreis, bei dem sich die Richtung der Preisbewegung geändert hat.
Parameter des Indikators
- Historisches Tageslimit:
- 0 - keine Grenzen (Standard);
- N - Anzeige von N Tagen;
- OpenColor - Farbe für das Niveau des offenen Tages (Standard: Blau);
- OpenLineStyle - Linienstil für den Eröffnungskurs (Standardwert: Solid);
- CloseColor - Linienstil für die geschlossene Tagesebene (Standard: Blau);
- Anzahl:
- 0 - Anzeige der Pegel basierend auf der Berechnung des aktuellen Tages;
- 1 - Anzeige der Niveaus basierend auf der Berechnung des Vortages (Voreinstellung);
- N - Anzeige der Niveaus, die auf der Berechnung des letzten N Tages basieren;
- MiddleColor - Farbe für die mittlere Tagesstufe (Standardwert: Gelb);
- RedirectColor - Farbe für die Umleitungsebene (Standard: Aqua);
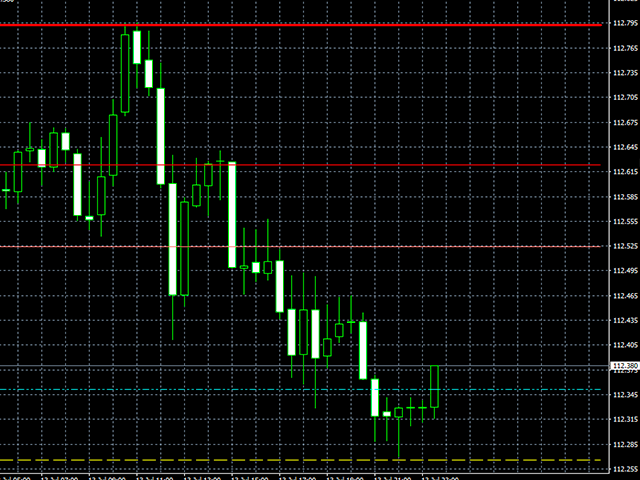
- HighColor - Farbe für das hohe Tagesniveau (Standard: Rot);
- LowColor - Farbe für die niedrige Tagesstufe (Standard: Grün).