Neue technische Indikatoren für den MetaTrader 4 - 135
Beschreibung: - Chart Time + Indicator ist sehr einfach und leicht, aber es kann sehr wichtig sein, die Zeit zu kontrollieren, bevor man einen manuellen Handel eröffnet. Dieser Indikator zeigt die Zeit in einem Panel zwischen 3 verschiedenen Optionen. Es ist möglich, das Panel mit der Maus oder mit festen Koordinaten auf dem Chart zu verschieben. Eingabe-Parameter: - Lokale Zeit : Aktivieren Sie die lokale Zeit, wenn Sie diese anzeigen möchten (Personal Computer Time). - Server-Zeit : Aktiviere

Dieser Indikator zeigt die letzten unberührten Unterstützungen und Widerstände als horizontale Linien an. Der Indikator kann Unterstützung/Widerstand von höheren Zeitrahmen anzeigen. Mit diesem Indikator können Sie z.B. leicht die Unterstützung/Widerstände der Zeitrahmen H4, D1 und W1 auf einem H1-Chart sehen, was ein großer Vorteil sein kann, wenn Sie Ihren Einstieg auf H1 timen. Dies ist die KOSTENLOSE Version des Indikators: Unterstützung-Widerstand-Multi-Zeitrahmen Die kostenlose Version fun
FREE

Dieser einfache Informationsindikator zeigt den Namen des aktuellen Tages und der vergangenen Arbeitstage, Monate und Jahre an.
Über den Begriff der Zeit und des Zeitrahmens Es ist allgemein bekannt, dass ein Zeitrahmen ein Zeitintervall ist, das in der technischen Analyse der freien Finanzmärkte betrachtet wird und in dem sich die Preise und andere Marktdaten ändern, wenn die Kurscharts dargestellt werden. Im MetaTrader 4-Handelsterminal werden diese Zeiträume durch eine vertikale gestrichelte
FREE

Dieser Indikator zeigt die letzten unberührten Unterstützungen und Widerstände als horizontale Linien an. Der Indikator kann Unterstützung/Widerstand von höheren Zeitrahmen anzeigen. Mit diesem Indikator können Sie z.B. leicht die Unterstützung/Widerstände der Zeitrahmen H4, D1 und W1 auf einem H1-Chart sehen, was ein großer Vorteil sein kann, wenn Sie Ihren Einstieg auf H1 timen. Dies ist die FULL-Version des Indikators: Unterstützung/Widerstand Multi Time Frame FREE
Parameter referenceTF: der

Es ist ein weiterer einfacher Informationsindikator. Dieser Indikator zeigt den aktuellen Spread eines Finanzinstruments und den Wert eines Punktes bei einem Volumen von 0,10 Lot.
Über den Spread Der Spread ist die Differenz zwischen dem Brief- und dem Geldkurs eines Vermögenswerts an der Börse oder an der Währung. Beziehen wir uns auf die Zentralbanken und den Währungsumtausch in diesen Banken, um zu verstehen, warum der Spread beim Währungshandel so wichtig ist. In Zentralbanken sehen wir imm
FREE

Der Bollinger Bands Oszillator ist ein Oszillator, der auf der Strategie "Mastering the Trade" von John Carter basiert. Die Strategie zielt darauf ab, die Bewegung von niedriger zu hoher Volatilität zu verfolgen. Der Bollinger Bands Oszillator misst das Momentum des Marktes. Wenn die Volatilität zunimmt, dehnen sich die Bollinger Bands aus und umkreisen den Keltner-Kanal. Der Bollinger Bands Oscillator verwendet Bollinger Bands und Keltner Channel. Der Momentum-Indikator wird auch als Bestätigun
Der Oszillator zeigt Umkehrpunkte und die Stärke der Bewegung sehr gut an. Er kann für jedes Symbol und jeden Zeitrahmen verwendet werden. Er verfügt über einen Parameter für das Niveau, wenn das Signal die erforderliche Stärke erreicht. Der Indikator ist sehr einfach zu konfigurieren. Die Balken des Indikators werden nicht neu gezeichnet.
Beschreibung der Parameter PeriodPower - Zeitraum für die Berechnung der Signalstärke LevelPower - der erforderliche Pegel der Signalleistung
Das Williams Dashboard ist ein Informationspanel, das Ihnen eine globale Marktsicht durch eine Williams Percent Range ermöglicht. Williams Dashboard analysiert und verfolgt alle Vermögenswerte, in die Sie investieren möchten. Profitieren Sie von diesem nützlichen Dashboard, mit dem Sie in wenigen Sekunden den Chart öffnen und schnell in ihn investieren können.
Hauptmerkmale von Williams Dashboard Grafisches Panel, das Ihnen erlaubt, die Situation vieler Vermögenswerte zu erkennen. 7 verschieden

Das CCI Dashboard ist ein Informationspanel, das Ihnen eine globale Marktsicht durch einen Commodity Channel Index ermöglicht. CCI Dashboard analysiert und verfolgt alle Aktivitäten, in die Sie investieren möchten. Profitieren Sie von diesem nützlichen Dashboard, mit dem Sie in wenigen Sekunden den Chart öffnen und schnell investieren können.
Hauptmerkmale von CCI Dashboard Grafisches Panel, das Ihnen erlaubt, die Situation vieler Vermögenswerte zu erkennen. 7 verschiedene Commodity Channel Ind

Einführung in den harmonischen Volatilitätsindikator Der harmonische Volatilitätsindikator ist die erste technische Analyse, die die Fibonacci-Analyse auf die finanzielle Volatilität anwendet. Der harmonische Volatilitätsindikator ist eine weitere Ebene des Preisaktionshandels, die robuste Fibonacci-Ratios (0,618, 0,382 usw.) mit der Volatilität kombiniert. Ursprünglich wurde der harmonische Volatilitätsindikator entwickelt, um die Einschränkungen und Schwächen des Gann-Winkels, auch bekannt als
Stochastic Dashboard ist ein Informationspanel, das Ihnen einen globalen Marktüberblick durch einen stochastischen Indikator ermöglicht. Stochastic Dashboard analysiert und verfolgt alle Vermögenswerte, in die Sie investieren möchten. Profitieren Sie von diesem nützlichen Dashboard, mit dem Sie in wenigen Sekunden den Chart öffnen und schnell in ihn investieren können.
Hauptmerkmale von Stochastic Dashboard Grafisches Panel, das es Ihnen ermöglicht, die Situation vieler Vermögenswerte zu erkenn

Signal Bands ist ein sensibler und praktischer Indikator, der eine tiefgehende statistische Verarbeitung von Informationen durchführt. Er ermöglicht es, auf einem Diagramm (1) den Preistrend, (2) den klaren Preiskanal und (3) latente Anzeichen einer Trendänderung zu erkennen. Der Indikator kann auf Charts beliebiger Perioden verwendet werden, ist aber aufgrund seiner hohen Empfindlichkeit gegenüber dem aktuellen Marktzustand besonders nützlich für das Scalping.
Die Funktionen des Indikators : E

Ein Indikator für runde Niveaus. Eine Reihe von wichtigen Kursniveaus mit Ton- und Textwarnungen, die erzeugt werden, wenn der aktuelle Geldkurs eines Währungspaares einer runden Zahl entspricht. Dieser Indikator zeigt dem Händler visuell die wahren Unterstützungs- und Widerstandsniveaus, die von den meisten Händlern und Handelsrobotern verwendet werden. Der Vorteil dieses Indikators ist, dass der Händler, der diesen Indikator auf einem Diagramm verwendet, keine zusätzlichen Niveaus einzeichnen

Pattern Detector kann die häufigsten 1, 2 und 3 Candlestick-Muster erkennen und Benachrichtigungen senden, wenn sie erkannt werden. Eine Demoversion, die mit AUDNZD arbeitet, finden Sie unter https://www.mql5.com/en/market/product/29189
Wie funktioniert es? Fügen Sie den Indikator zu dem Chart hinzu, den Sie analysieren möchten, und wählen Sie die zu erkennenden Muster aus. Der Indikator zeichnet die erkannten Muster ein. Sie können sich auch per Alarm, App und E-Mail benachrichtigen lassen, we
FREE
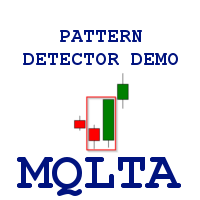
Pattern Detector kann die häufigsten 1, 2 und 3 Candlestick-Muster erkennen und Benachrichtigungen senden, wenn sie erkannt werden. Die DEMO-Version funktioniert nur für das Paar AUDNZD. Das vollständige Produkt finden Sie unter https://www.mql5.com/en/market/product/29190
Wie funktioniert es? Fügen Sie den Indikator zu dem Chart hinzu, den Sie analysieren möchten, und wählen Sie die zu erkennenden Muster aus. Der Indikator zeichnet die erkannten Muster ein. Sie können sich auch per Alarm, App
FREE

Dies ist ein Indikator für "runde Niveaus" mit einem Handelssystemmodul, das auf Marktszenarien in der Nähe psychologisch bedeutsamer "Marktpreise" basiert. Das Modul visualisiert die SL/TP-Niveaus und modelliert die Geschäfte, wenn sie mit den OHLC-Preisen interagieren. Es sammelt Statistiken für den angegebenen Zeitraum und stellt die "Rentabilitätskurve" auf ihrer Grundlage dar, was die Kontrolle der erwarteten Rentabilität der Handelssignale ermöglicht.
Das Handelssystem Der Algorithmus bas

MQLTA Candle Timer ist ein Indikator, der Ihnen die Details über ein Symbol/Paar zeigt und Sie vor dem Schließen einer Kerze warnt. Er wird nicht nur im Swing-Trading verwendet, sondern kann Ihnen helfen, Ihre Strategien zu kennen und vor dem Schließen einer Kerze bereit zu sein.
Wie funktioniert es? Fügen Sie den Indikator einfach zum Chart hinzu und legen Sie die Benachrichtigungsoptionen fest. Sie können eine minimalistische Schnittstelle oder eine vollständige Schnittstelle laden. Der Alarm
FREE
Dieser Indikator basiert auf Ichimoku kynko Hyo, ist aber mit We-Trading Regeln personalisiert.
Ichimoku Trend-Pfeile Wie Sie sehen können, zeigt der Indikator zwei Arten von Pfeilen (Signale) an: Große Pfeile, um den großen Trends zu folgen Kleine Pfeile zum Wiedereinstieg in den Trend, um weitere Trades zu tätigen Mit Ichi-Trend indi können Sie dem Trend des Marktes folgen. Sie können ihn auf dem Forex und auf allen CFDs und mit allen Fimeframes, die Sie mögen, verwenden.
Parameter Die wicht
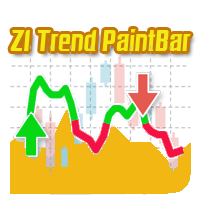
Ein Trendindikator, der auf dem CCI-Indikator basiert. ZI Trend PaintBar Indicator ist eine verbesserte Variante des CCI-Indikators, die den Moment der Trendverfolgung sehr genau anzeigt. Durch die Kombination mit dem CCI-Indikator können diese Vorteile besser genutzt werden: Farbige Candlesticks, die die Trendrichtung basierend auf dem CCI Indikator anzeigen. Messages/Sounds (Benachrichtigungen und Sound-Einstellungen) Mail - aktivieren/deaktivieren Sie den Versand von E-Mails. Alerts - aktivie

Dies ist eine Implementierung des bekannten SuperTrend-Indikators. Mit diesem Indikator können Sie genau die gleichen Werte sehen, die auch von den folgenden SuperTrend Scannern angezeigt werden:
SuperTrend-Scanner SuperTrend-Scanner FREE
Parameter SuperTrendATRPeriod: die Periodeneinstellung für die Berechnung des SuperTrends SuperTrendMultiplier: die Multiplikator-Einstellung für die Berechnung des SuperTrends
FREE
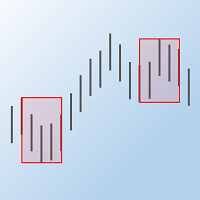
Der Indikator "Max-Min-Kurse" ermittelt die Höchst- und Tiefstkurse zwischen zwei Kerzen innerhalb eines Handelstages und zeigt sie als Rechtecke im Preisdiagramm an.
Parameter des Indikators Startstunde - Stunde der Startkerze Startminute - Minute der Startkerze Endstunde - Stunde der Endkerze Endminute - Minute der Endkerze Typ der rechteckigen Linien - Stil der rechteckigen Linien Rechtecklinien Breite - Breite der Rechtecklinien Rechteck Füllung - füllt das Rechteck mit Farbe Farbe - Farbe

Dieser Scanner zeigt die Trendwerte des bekannten Indikators SuperTrend für bis zu 30 Instrumente und 8 Zeitrahmen an. Sie können sich per MT4, Email und Push-Benachrichtigung alarmieren lassen, sobald sich die Trendrichtung ändert. Dies ist die KOSTENLOSE Version des Indikators: SuperTrend-Scanner Die kostenlose Version funktioniert nur auf EURUSD und GBPUSD!
Wichtige Informationen Wie Sie das Potential des Scanners maximieren können, lesen Sie bitte hier: www.mql5.com/en/blogs/post/718074
Mi
FREE

Dieser Scanner zeigt die Trendwerte auf Basis der Überkreuzungen von zwei gleitenden Durchschnitten für bis zu 30 Instrumente und 8 Zeitrahmen an. Sie können Alarme über MT4, E-Mail und Push-Benachrichtigung erhalten, sobald sich die Trendrichtung ändert. Dies ist die kostenlose Version des Indikators: https://www.mql5.com/en/market/product/29159
Wichtige Informationen Wie Sie das Potential des Scanners voll ausschöpfen können, lesen Sie hier: www.mql5.com/en/blogs/post/718074
Sie haben viele
FREE

Dieser Scanner zeigt die Trendwerte des bekannten Indikators Parabolic SAR für bis zu 30 Instrumente und 8 Zeitrahmen an. Sie können sich per MT4, Email und Push-Benachrichtigung alarmieren lassen, sobald sich die Trendrichtung ändert. Dies ist die KOSTENLOSE Version des Indikators: Fortgeschrittener Parabolic SAR Scanner Die kostenlose Version funktioniert nur auf EURUSD und GBPUSD!
Wichtige Informationen Wie Sie das Potential des Scanners voll ausschöpfen können, lesen Sie bitte hier: www.mql
FREE

Dieser Scanner zeigt die Trendwerte des bekannten Indikators SuperTrend für bis zu 30 Instrumente und 8 Zeitrahmen an. Sie können sich per MT4, Email und Push-Benachrichtigung benachrichtigen lassen, sobald sich die Trendrichtung ändert.
Wichtige Informationen Wie Sie das Potential des Scanners voll ausschöpfen können, lesen Sie bitte hier: www.mql5.com/en/blogs/post/718074
Sie haben viele Möglichkeiten, den Scanner zu nutzen. Hier sind zwei Beispiele: Mit diesem Scanner können Sie problemlos

Dieser Scanner zeigt die Trendwerte auf Basis der Überkreuzungen von zwei gleitenden Durchschnitten für bis zu 30 Instrumente und 8 Zeitrahmen an. Sie können sich per MT4, E-Mail und Push-Benachrichtigung benachrichtigen lassen, sobald sich die Richtung des Trends ändert.
Wichtige Informationen Wie Sie das Potential des Scanners voll ausschöpfen können, lesen Sie bitte hier: www.mql5.com/en/blogs/post/718074
Sie haben viele Möglichkeiten, den Scanner zu nutzen. Hier sind zwei Beispiele: Mit di

Dieser Scanner zeigt die Trendwerte des bekannten Indikators Parabolic SAR für bis zu 30 Instrumente und 8 Zeitrahmen an. Sie können sich per MT4, Email und Push-Benachrichtigung alarmieren lassen, sobald sich die Trendrichtung ändert.
Wichtige Informationen Wie Sie das Potential des Scanners voll ausschöpfen können, lesen Sie bitte hier: www.mql5.com/en/blogs/post/718074
Sie haben viele Möglichkeiten, den Scanner zu nutzen. Hier sind zwei Beispiele: Mit diesem Scanner können Sie problemlos ei
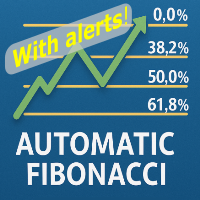
Automatisches Fibonacci mit Alarmen ist ein Indikator, der automatisch ein Fibonacci-Retracement auf der Grundlage der von Ihnen in der Einstellung BarsToScan des Indikators ausgewählten Anzahl von Bars erstellt. Das Fibonacci-Retracement wird automatisch in Echtzeit aktualisiert, sobald neue Höchst- und Tiefstwerte unter den ausgewählten Balken erscheinen. Sie können in den Einstellungen des Indikators auswählen, welche Level-Werte angezeigt werden sollen. Sie können auch die Farbe der Levels a

Es gibt Zeiträume auf dem Markt, in denen der Handel mit hoher Wahrscheinlichkeit unrentabel ist. Dieser Indikator warnt Sie vor solchen Situationen und hilft Ihnen, Ihr Geld und Ihre Zeit zu schonen.
Parameter Erinnert an handelsfreie Zeiten: Verfallswoche - erinnert an die Verfallswoche Consumer Index Day - erinnert einen Tag vor der Veröffentlichung des Consumer Index Day NON FARM - erinnert einen Tag vor der Veröffentlichung von NON FARM Weihnachten - erinnern Sie einen Tag vor Weihnachten
FREE

Ein einfacher Informationsindikator, der die verbleibende Zeit bis zur Eröffnung der nächsten Kerze oder des nächsten Balkens anzeigt.
Über das Konzept des Zeitrahmens Ein Zeitrahmen ist das Zeitintervall, das bei der technischen Analyse der freien Finanzmärkte (das gilt auch für den globalen Währungsmarkt) berücksichtigt wird und in dem sich der Preis und andere Marktdaten ändern. Der kleinste Zeitrahmen ist der sogenannte Tick. Ein Zeitrahmen ist das Zeitintervall, das zur Gruppierung von Kur
FREE

MQLTA Instrument Details zeigt Ihnen in einer einfach zu lesenden Tabelle die Details über das Instrument/Symbol, einschließlich: Bezeichnung Handelsmodus Standard-Kontraktgröße Minimale Größe Maximale Größe Größe Schritt Verwendete Ziffern Tick-Größe Tick-Wert Stop-Level Gebot Brief Spanne
Parameter Name des Indikators zur Erstellung der Objekte Standardfenster beim Öffnen des Indikators Horizontaler Versatz Vertikaler Versatz Wenn Ihnen dieses Tool gefällt, nehmen Sie sich bitte eine Minute Z
FREE

Dieser Indikator visualisiert den Schnittpunkt von zwei gleitenden Durchschnitten im MACD-Oszillator. Er verwendet die Farbe des Histogramms, um zu signalisieren, dass die gleitenden Durchschnitte die Nulllinie des Indikators kreuzen. Der MACD-Indikator (Moving Average Convergence/Divergence) ist ein beliebter Oszillator, der von Händlern auf den Devisen- und Aktienmärkten aktiv genutzt wird, um Trends zu bestimmen und nach Handelssignalen zu suchen. Dieser lineare Indikator ermöglicht es, eine

Dieser Indikator basiert auf einer Kombination von 2 verschiedenen SuperTrend, einem von Oliver Seban entwickelten Trendfolgeindikator. Einige Implementierungen finden Sie auf den folgenden Seiten: https://www.mql5.com/en/code/8268 https://www.mql5.com/en/code/10851 und andere. Der Double ST Indikator kombiniert 2 verschiedene SuperTrends, um die Trendrichtung auf einen Blick zu haben. Geben Sie einfach die Werte für die 2 SuperTrends ein und Sie sehen ein Band mit 3 verschiedenen Farben: rot be
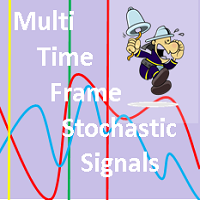
Dieser Indikator basiert auf der Stochastik auf einem oder mehreren Zeitrahmen und auf einem beliebigen Währungspaar (Cross Pair). Der Indikator erzeugt eine Warnmeldung, wenn er ein Kauf- oder Verkaufssignal feststellt. Außerdem zeichnet er einen vertikalen Balken auf dem Preisdiagramm: grün für Kauf oder rot für Verkauf, gelb, wenn er unverändert bleibt. Warnmeldungen und vertikale Balken für KAUF oder VERKAUF werden generiert, wenn die Stochastik für alle gewählten Zeitrahmen konsistent ist ,
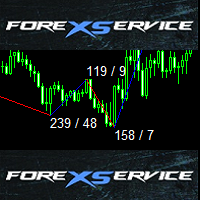
Es handelt sich um einen Standard-ZigZag-Indikator mit einigen coolen Zusatzfunktionen - farbiger Bereich, Anzahl der Pips zwischen Hochs und Tiefs und auch Anzahl der Kerzen zwischen dem Indikatorbereich.
Standard-Variablen des ZigZag-Indikators TiefeZigZag AbweichungZigZag RückschrittZigZag
Bullish-Markt-Variablen lineUpColor - Farbe der Linie lineUpStyle - Linienstil lineUpWidth - Linienstärke textUpColor - Farbe des Textes mit Anzahl der Pips und Kerzen textUpFont - Schriftart des Textes m

DotaScalping ist ein halbautomatisches Handelssystem für Scalping. Der Indikator zeigt empfohlene Zeitpunkte für die Eröffnung von Kauf-/Verkaufstransaktionen als Punkte auf dem Chart an. Die Signale werden auf der Grundlage eines Algorithmus zur Glättung der Preisamplitude generiert. Der Indikator versucht, die Momente der maximalen Preisspitzenwerte genau zu berechnen und erzeugt Signale auf der Grundlage der geglätteten Korrelation. Der Indikator ermittelt die Höchst- und Tiefstkurse und gene
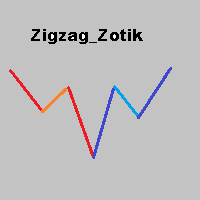
Der Zigzag Zotik-Indikator zeigt die Kursbewegung in Form eines Zickzacks auf der Grundlage der Werte des AO_Zotik-Indikators an. Der Zigzag Zotik-Indikator zeigt die Trendbewegungen und deren Korrekturen an. Der AO_Zotik Indikator besteht aus drei Linien, die sich relativ zu "0" bewegen: "Hauptlinie"; "Unterstützungs- und Widerstandslinie"; "Gleichgewichtslinie". Die "Hauptlinie", die die "Unterstützungs- und Widerstandslinie" kreuzt, zeigt das Ende einer Welle und den Beginn einer anderen an.
Simulator für Risiko / Reward-Verhältnis-Rechner We-RiskReward ist ein MT4-Indikator, der vom We-Trading-Team entwickelt wurde, um eine Order mit dem Risk / Reward-Rechner zu simulieren.
Horizontale Linien Dieser Indikator zeigt Ihnen 3 horizontale Linien, die sind: Offene Linie Take Profit-Linie Stop-Loss-Linie Sie können die Linien verschieben und Sie sehen die R/R- und Lots-Berechnung in Echtzeit. Sie können mit diesem Indikator Long- und Short-Positionen simulieren.
Parameter des Indikator
FREE

Dieser Indikator wurde in Anlehnung an den "Way Of The Turtle" modifiziert. Er erzeugt einen Kanal auf der Grundlage des Eröffnungskurses und der ATR-Werte des aktuellen Balkens. Der Turtle ATR-Kanal kann verwendet werden, um überkaufte und überverkaufte Bedingungen in einem Markt zu identifizieren.
Berechnung oberer Kanal = Eröffnungskurs + r1*ATR unterer Kanal = Eröffnung - r2*ATR Darunter: Open ist der Eröffnungskurs des aktuellen Balkens. ATR ist der ATR-Wert des aktuellen Balkens. r1, r2 s
FREE
Dieses Panel ist für die schnelle visuelle Suche nach Preisaktionsmustern für mehrere Instrumente gleichzeitig gedacht. Es ist möglich, Instrumente hinzuzufügen und zu entfernen. Wenn Sie auf die Schaltfläche "Signal" klicken, können Sie schnell zu dem Chart mit dem identifizierten Muster und Zeitrahmen wechseln. Das Panel sucht nach 8 Candlestick-Mustern: PIN-BAR, EXTERNAL BAR, INSIDE BAR, DOJI, LEVEL, HIGH/LOW OF N BAR, FAKEY, ONE-WAY N BAR. Jedes der Muster oder die Perioden können durch Ankl
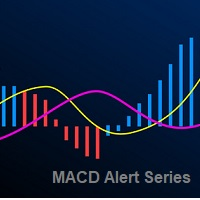
Der MACD-Indikator (Moving Average Convergence Divergence Indicator) ist sowohl ein Trend- als auch ein Momentum-Indikator, der mehrere exponentielle gleitende Durchschnitte verwendet, die auf die Schlusskurse bezogen sind, um Handelssignale zu generieren. Wir haben verschiedene Arten von Warnungen hinzugefügt, um Sie bei Ihrer Suche nach besseren Marktchancen zu unterstützen.
Produktmerkmale E-Mail-Warnung Ton-Benachrichtigung Push-Benachrichtigung (Warnungen können an Ihr Mobiltelefon gesende
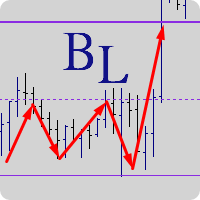
Analysemethode "Kostenbilanz" Erstellt von Trader AFI_man. Der BalanceLines-Indikator stellt die Gleichgewichtsniveaus für ein bestimmtes Zeitintervall dar. Die Gleichgewichtslinie unterteilt das Marktvolumen in Verkäufer (oberhalb des Gleichgewichtsniveaus) und Käufer (unterhalb des Gleichgewichtsniveaus). Wenn bei einer Bewegung der Preis oberhalb des Gleichgewichtsniveaus fixiert wird, kommt ein Moment, in dem die Verkäufer nicht in der Lage sind, die Käufer zurückzuhalten, was zu einem Wachs

Das SFO Trend Racer System ist ein Trendindikator, der vom CEO und Gründer von "Simple Forex Options ", Tevin Marshall , entwickelt wurde. Es dient 6 verschiedene Funktionen in einem. Er zeigt dem Trader sowohl Einstiegs- als auch Ausstiegssignale, sei es ein Take Profit oder ein Stop Loss. Es verwendet auch Trendfilter und Signalbestätigungen, so dass der Händler in der Lage ist, die logischste Entscheidung zu treffen. Trend Racer verwendet verschiedene Filter und spezifische Einstellungen aus

Dieser spezielle Indikator soll ein bestimmtes Problem lösen: Falls die Verbindung zum Server des Brokers unterbrochen wird, sollte man sich merken, wann die Verbindung unterbrochen wurde und wann sie wiederhergestellt wurde. Der Benutzer sieht also die Zeit, zu der keine Verbindung zum Server des Brokers bestand . Auf dem Bildschirm wird eine Warnmeldung angezeigt, die festhält, wann die Verbindung unterbrochen und wiederhergestellt wurde. Natürlich reagiert der Indikator nicht auf leichte Pake

Dieser Indikator berechnet und zeichnet Linien über das Diagramm. Es gibt zwei Arten von Trends: Trend A: Die Linie wird anhand lokaler Tiefststände für Aufwärtstrends und lokaler Höchststände für Abwärtstrends gezeichnet. Trend B: Die Linie wird anhand lokaler Hochs für Aufwärtstrends und lokaler Tiefs für Abwärtstrends gezeichnet. Es gibt einige Bedingungen, die erfüllt sein müssen und über die Parameter geändert werden können (siehe auch Abbildung 4): MinBarAge : die Anzahl der Balken bis zum
FREE

TSO Bollinger Bandit Strategy ist ein Indikator, der auf der Bollinger Bandit Trading Strategy basiert, wie sie im Buch Building Winning Trading Systems with TradeStation von G. Pruitt und J. R. Hill vorgestellt wird. SCANNER ist enthalten . Mit dem Scanner können Sie jetzt einfacher und schneller Handelsmöglichkeiten und Setups finden.
Merkmale Eine komplette Einstiegs- und Ausstiegsstrategie für trendige Märkte. Erhalten Sie E-Mail-/Push-Benachrichtigungen, wenn ein Einstiegssignal auftritt.

Der Momentum-Kanal-Indikator funktioniert auf der Grundlage des täglichen Preisindexes. Der Indikator wird verwendet, um den Paritätspreis zu analysieren. Diese Analyse wird durch Kanäle durchgeführt. Kanäle werden verwendet, um Trendrückkehrpunkte zu finden. Der Indikator verfügt über 3 Kanallinien, nämlich die Linien bei 30, 50 und 70 Punkten. Das Niveau von 70 ist der überkaufte Bereich. Kursbewegungen bei 70 und darüber deuten darauf hin, dass der Chart in naher Zukunft fallen wird. Kursbewe
Die Average Daily Range (ADR) zeigt die dynamischen Niveaus der durchschnittlichen Pip-Spanne eines Paares, gemessen an den täglichen Höchst- und Tiefstwerten über einen bestimmten Zeitraum. Sie können die ADR verwenden, um potenzielle Preisaktionen außerhalb der durchschnittlichen täglichen Bewegung zu visualisieren. Wenn die ADR über dem Durchschnitt liegt, bedeutet dies, dass die tägliche Volatilität höher als gewöhnlich ist . Die ADR kann bei der Festlegung von Zielen für Positionen hilfrei
GUME Simple Entry zeigt die Einstiegspunkte für den Kauf und Verkauf aller Instrumente an, indem es die Marktbewegung analysiert. Es wurde entwickelt, um Einstiegspunkte für jedes Währungspaar und alle Handelsperioden anzuzeigen. Es ist optimiert für M5 für Scalping und M15 und höhere Perioden für den langfristigen Handel. Er ist auch für EURUSD, GBPUSD, GBPJPY, EURJPY und XAUUSD optimiert. Er ist so konzipiert, dass ein farbiger Pfeil nach oben oder unten für ein Kauf- bzw. Verkaufssignal angez

Der Indikator zeigt die Höchst-/Tiefst-/Eröffnungs-/Schlussniveaus aus anderen (und nicht standardmäßigen) Zeitrahmen an – Jahr, 6 Monate, 4 Monate, 3 Monate, 2 Monate, Monat, Woche, Tag, H3-H6-H8-H12 Stunden M45 M90. Sie können auch die Verschiebung für das Öffnen von Kerzen festlegen und virtuelle Kerzen erstellen. „Periodentrennzeichen“ für einen dieser Zeitrahmen sind in Form vertikaler Linien verfügbar. Alarme können für Ausbrüche des aktuellen oder vorherigen Niveaus konfiguriert werden (

Advanced Stochastic Scalper - ist ein professioneller Indikator, der auf dem beliebten Stochastik Oszillator basiert. Advanced Stochastic Scalper ist ein Oszillator mit dynamischen überkauften und überverkauften Niveaus, während diese Niveaus beim Standard-Stochastik-Oszillator statisch sind und sich nicht ändern. Dadurch kann sich der Advanced Stochastic Scalper an den sich ständig verändernden Markt anpassen. Wenn ein Kauf- oder Verkaufssignal erscheint, wird ein Pfeil auf dem Diagramm gezeich
Eine persönliche Umsetzung des berühmten Bollinger-Bänder-Indikators als Trendfolge-Mechanismus, der einen gleitenden Durchschnitt und die Standardabweichung verwendet, um zu definieren, was ein Trend ist und wann er sich ändert. Bollinger Bänder werden normalerweise nur als Überkauft/Überverkauft-Indikator verwendet, aber meiner Meinung nach ist der Handelsansatz vollständiger, wenn man die Trendvariante als Ausstiegsstrategie verwendet. [ Installationsanleitung | Update-Anleitung | Fehlerbeheb
FREE
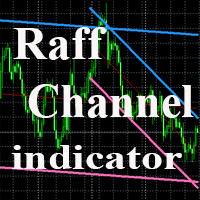
Der Indikator stellt einen Trendkanal nach der Technik von Gilbert Raff dar. Die Kanalachse ist eine Regression erster Ordnung. Die obere und untere Linie zeigen die maximale Entfernung der Close-Linie von der Achsenlinie an. Daher können die obere und die untere Linie als Widerstands- bzw. Unterstützungslinien betrachtet werden. Eine ähnliche Version des Indikators für das MT5-Terminal
In der Regel vollziehen sich die meisten Kursbewegungen innerhalb eines Kanals, wobei die Unterstützungs- ode
FREE

Ein einfaches, aber effektives Hilfsmittel, mit dem Sie sowohl globale als auch lokale Markttrends verfolgen können. Der Indikator kombiniert die Arbeit von zwei Oszillatoren: Stochastik und RSI. Beide Indikatoren können auf einen beliebigen Zeitrahmen eingestellt werden.
Vorteile der Verwendung Multitimeframe - Sie können beide Indikatoren auf die gewünschten Zeitrahmen einstellen. Um die Einstiegspunkte zu erhalten, können Sie das dreifache Bildschirmsystem von Elder verwenden. Hochgradig anp
FREE
Der Signal SASON-Indikator wurde entwickelt, um Handelssignale zu generieren. Er dient dazu, potenzielle Einstiegspunkte für den Handel zu finden. Die Signale werden durch die Analyse einer Reihe von Candlestick-Bewegungen und einer Reihe von Algorithmen gefunden. Dieser Indikator errechnet die Umkehrpunkte des von Ihnen verwendeten Paares. Er hat keine trügerischen Eigenschaften, wie z.B. das Wiedereinfärben.
Regeln und Merkmale Wenn ein Signal eintrifft, empfiehlt es sich, Take-Profit- und St
Heterodyne Heterodyne ist ein Oszillator, der auf dem Stärkeindexindikator (RSI) basiert. Der aktuelle Wert der Indikatorwerte wird mit den maximalen und minimalen Indikatorwerten für den angegebenen Zeitraum verglichen und der Durchschnittswert berechnet. Die Indikatorwerte werden auch mit der Methode des gleitenden Durchschnitts (MA) geglättet. Ein Kaufsignal ist das Überschreiten eines bestimmten Niveaus durch den Indikator von unten nach oben, ein Verkaufssignal ist das Überschreiten eines
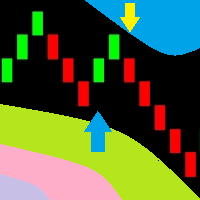
Sie können jetzt die herkömmlichen Kurscharts verwenden, um Renko-Balken anzuzeigen. Dieser Indikator kann Dialogfelder mit Warnungen, Push-Benachrichtigungen an mobile Geräte und E-Mails senden. Sie können diesen Indikator problemlos zur Erstellung von Expert Advisors verwenden, da der Indikator mit Puffern arbeitet.
Parameter des Indikators Renko-Größe, Punkte - Größe der Renko-Balken Pfeilabstand, Punkte - Abstand zu den Signalpfeilen Warnungen - wahr/falsch - Pop-up-Warnungen verwenden, wen

Mit dem MACD Multi Time Frame-Indikator können Sie Divergenzen auf höheren Zeitebenen erkennen, während Sie auf niedrigeren Zeitebenen nach gezielten Einstiegsmöglichkeiten suchen. Diese KOSTENLOSE Version des Indikators funktioniert nur für EURUSD und GBPUSD. Die Vollversion des Indikators finden Sie hier: MACD Multi Time Frame In diesem Blog-Beitrag finden Sie eine KOSTENLOSE ECHTZEIT-MACD-Divergenzanalyse und Tipps, wie Sie die Divergenzen handeln können: ECHTZEIT MACD-Divergenz-Analyse Der M
FREE

Zeigt auf dem Chart ein Histogramm mit zwei gleitenden Durchschnitten. Es ermöglicht das Senden von Alarmen an die MetaTrader-Plattform, wenn die Kreuzungen auftreten. Sie können ihn auf jedem Zeitrahmen verwenden, die Einstellungen der gleitenden Durchschnitte können angepasst werden, ebenso wie das Aussehen und die Farben.
Die Parameter des Indikators sind Periode des schnellen gleitenden Durchschnitts Dauer des langsamen gleitenden Durchschnitts Modus des gleitenden Durchschnitts Gleitender
FREE

Dieser Indikator ist ein origineller Blick auf die Volumina. Es ist bekannt, dass Volumina zeigen die Menge der Käufer und Verkäufer für einen bestimmten Zeitraum. Eine Kerze wird für einen bestimmten Zeitraum verwendet. Die Volumina bei einem Kerzenhoch zeigen die Käufer an. Die Volumina bei einem Kerzentief zeigen die Verkäufer an. Eine offene Kerze zeigt das Delta an. Das Delta gibt an, wer bei einer bestimmten Kerze dominiert hat, Käufer oder Verkäufer.
Eingabeparameter Abstand - Abstand de
FREE

Der Special Trend Oscillator ist ein Indikator zur Erkennung von Trendwechselpunkten und zur Messung der Stärke des aktuellen Trends. Dieser Indikator ist ein anderes Modell des MACD-Indikators. Der Indikator hat zwei Kanäle. Der blaue Kanal ist die obere Linie des Aufwärtstrends. Die rote Kanallinie ist die Untergrenze des Abwärtstrends. Kaufen Sie, wenn die Trendlinie die rote Linie erreicht. Verkaufen Sie, wenn die Trendlinie die blaue Linie erreicht. Unsere beliebten Produkte Super Oszillato

Der Indikator hat die folgenden Eigenschaften Prädiktiver Trend (Histogramm) - er verwendet eine fortschrittliche prädiktive Wahrscheinlichkeits- und Statistikberechnung sowie eine lineare Regression, um den möglichen Trend zu ermitteln. Er muss mit mindestens 3 Zeitrahmen verwendet werden, um eine genauere Ablesung des Trends zu ermöglichen: D1, H4, H1. In einigen (subjektiven) Fällen kann es sinnvoll sein, M5 zu verwenden, um eine genauere Ablesung zu erhalten. Geschwindigkeit (gepunktete Lini

Harmonic Master Scanner ist ein dynamisches Tool, das Tradern hilft, harmonische Muster auf dem Chart zu erkennen und zu zeichnen. Harmonic Master Scanner ist eine Software, die für den MetaTrader 4 entwickelt wurde. Harmonic Master Scanner arbeitet auf der Grundlage des originalen MetaTrader 4 Zigzag-Indikators und der Standard-Elemente für harmonische Muster. Diese Software kann Sie per E-Mail benachrichtigen, wenn ein harmonisches Muster auf einem beliebigen Chart erkannt wird. Der Einstiegsp

Ich empfehle Ihnen, den Blog des Produkts (Handbuch) von Anfang bis Ende zu lesen , damit von Anfang an klar ist, was der Indikator bietet . Dieser Multi-Zeitrahmen- und Multisymbol-Indikator identifiziert doppelte oder dreifache Top/Bottom-Formationen oder einen folgenden Halsausbruch (bestätigtes Top/Bottom). Er bietet Filter für RSI überkauft/überverkauft, Kerzenmuster (Pin Bar, Engulfing, Tweezer, Morning/Evening Star, Three Line Strike) und Divergenzen (MACD, OsMA, Awesome (AO), RSI, CCI,
Dieses Panel ist für die schnelle visuelle Suche nach Preisaktionsmustern für mehrere Instrumente gleichzeitig gedacht. Es ist möglich, Instrumente hinzuzufügen und zu entfernen. Wenn Sie auf die Schaltfläche "Signal" klicken, können Sie schnell zu dem Chart mit dem identifizierten Muster und Zeitrahmen wechseln. Das Panel sucht nach 8 Candlestick-Mustern: PIN-BAR, EXTERNAL BAR, INSIDE BAR, DOJI, LEVEL, HIGH/LOW OF N BAR, FAKEY, ONE-WAY N BAR. Jedes der Muster kann durch Anklicken seines Titels

Chart Time Indicator ist sehr einfach und leicht, aber es kann sehr wichtig sein, die Zeit zu kontrollieren, bevor man einen manuellen Handel eröffnet. Dieser Indikator zeigt die Zeit auf dem Chart zwischen 3 verschiedenen Optionen an.
Eingabeparameter Show Time : Wählen Sie alle Zeitoptionen, die Sie sehen möchten. Lokale Zeit (Personal Computer Time), Server Time (Broker Time) oder GMT Time. Empfehlungen: Verwenden Sie nur einen Chart Time Indicator für jeden Chart.
FREE
Der KFX High and Tight Flag Muster Indikator ist Teil des KFX Pattern Manual Expert Advisor. Der Indikator zeigt das Einstiegsniveau (Ausbruch) mit dem Gewinnziel und dem Stop Loss an. Die Strategie basiert auf dem Buch von Thomas Bulkowski, Enzyklopädie der Chartmuster, zweite Auflage. High and Tight Flags sind das Chartmuster mit der besten Performance sowohl in Bullen- als auch in Bärenmärkten. Sie sind das perfekte Muster für die Trendfolge. Geeignet für jedes Währungspaar, Optionen, Rohstof
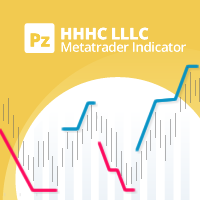
Eine persönliche Implementierung eines berühmten Trendprinzips, bekannt als Higher High, Higher Close, Lower Low, Lower Close (HHHC - HHHL). Es nutzt allein die Preisbewegung, um Trendrichtung, Trendwechsel und Pullback-Zonen zu bestimmen. [ Installationsanleitung | Update-Anleitung | Fehlerbehebung | FAQ | Alle Produkte ] Anpassbarer Ausbruchszeitraum Anpassbare Farben und Größen Es ist nicht-nachmalend und nicht-zurückmalend Er implementiert alle Arten von Alarmen Der Indikator definiert drei
FREE
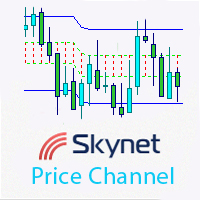
Dieser Indikator zeigt einen äquidistanten Preiskanal an, identifiziert kurzfristige Trends und findet automatisch die besten Niveaus für die oberen und unteren Grenzen des Kanals. Er ist für die wichtigsten Zeitrahmen und Währungspaare optimiert.
Vorteile Visualisierung von kurzfristigen Trends automatische Festlegung der oberen und unteren Kanalgrenzen geeignet für Scalping-Strategien, die auf einem Rebound von den Kanalgrenzen basieren
Parameter smooth - Grenzglättungskoeffizient. Der Stand

Mit diesem System können Sie hochwahrscheinliche Trades in Richtung starker Trends erkennen. Profitieren Sie von Stop-Hunt-Bewegungen, die vom intelligenten Geld initiiert werden!
Wichtige Informationen Wie Sie das Potential des Scanners maximieren können, lesen Sie bitte hier: www.mql5.com/en/blogs/post/718109 Bitte lesen Sie auch den Blog über die Verwendung des Indikators: Professionelles Trading mit starkem Momentum Diese KOSTENLOSE Version des Indikators funktioniert nur auf EURUSD und GBP
FREE
Der MetaTrader Market ist die beste Plattform für den Verkauf von Handelsroboter und technischen Indikatoren.
Sie brauchen nur ein gefragtes Programm für die MetaTrader Plattform schreiben und schön gestalten sowie eine Beschreibung hinzufügen. Wir helfen Ihnen, das Produkt im Market Service zu veröffentlichen, wo Millionen von MetaTrader Benutzern es kaufen können. Konzentrieren Sie sich auf dem Wesentlichen - schreiben Sie Programme für Autotrading.
Sie verpassen Handelsmöglichkeiten:
- Freie Handelsapplikationen
- Über 8.000 Signale zum Kopieren
- Wirtschaftsnachrichten für die Lage an den Finanzmärkte
Registrierung
Einloggen
Wenn Sie kein Benutzerkonto haben, registrieren Sie sich
Erlauben Sie die Verwendung von Cookies, um sich auf der Website MQL5.com anzumelden.
Bitte aktivieren Sie die notwendige Einstellung in Ihrem Browser, da Sie sich sonst nicht einloggen können.