Смотри обучающее видео по маркету на YouTube
Как купить торгового робота или индикатор
Запусти робота на
виртуальном хостинге
виртуальном хостинге
Протестируй индикатор/робота перед покупкой
Хочешь зарабатывать в Маркете?
Как подать продукт, чтобы его покупали
Бесплатные технические индикаторы для MetaTrader 4 - 9

updated hidden market support and resistance. this indicator is made for new current market that has new support and resistance that some traders struggle to see. The indicator works on all timeframes from the 1-minute timeframe to the monthly One Trading tip to use When price is at resistance and the indicator appears wait for a bearish candle to close then enter a sell trade. Same applies for a buy trade when price reaches support level, and the indicator appears wait for the bullish candle
FREE

Линейный график Volume Percentage Line Graph — это индикатор, предназначенный для предоставления информации об объеме данных. Он извлекает информацию об общем объеме для каждой свечи и представляет ее в процентах от общего объема. Индикатор отображает эти данные в виде линий графика в отдельном окне, что позволяет пользователям легко визуализировать битву между покупателями и продавцами. Одной из ключевых особенностей этого индикатора является его способность отображать объем в процентах в в
FREE

Метр точности Введение:
Accuracy Meter - это мощный инструмент для определения% выигрышных стратегий, чтобы показать вам все точки входа и выхода из сделок, такие как этот мета-тестер стратегий, вы можете иметь простой тестер стратегий в качестве индикатора на графике, прикрепить его к разным парам и таймфреймам и выяснить процент точности вашей стратегии, измените стоп-лосс и риск на коэффициент вознаграждения и посмотрите, как он может повлиять на вашу идею торговли Accuracy Meter - это ваш
FREE
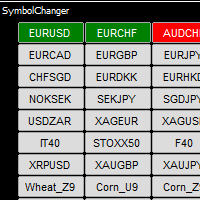
Symbol Chart Changer is an indicator/utility that offers you the option to switch between symbols and timeframes. You can choose any symbol and timeframe on the same chart with just a few clicks. In addition, this indicator also shows the profit of the symbol through the color of the buttons. For MT5: Symbol Chart Changer for MT5 Features
All symbols selected in MarketWatch, that allow you to monitor your favorite instruments on the same chart. Works smoothly on any symbol/instrument, accou
FREE
Highly configurable Williams %R indicator. Features: Highly customizable alert functions (at levels, crosses, direction changes via email, push, sound, popup) Multi timeframe ability Color customization (at levels, crosses, direction changes) Linear interpolation and histogram mode options Works on strategy tester in multi timeframe mode (at weekend without ticks also) Adjustable Levels Parameters:
Williams %R Timeframe: You can set the current or a higher timeframes for Williams %R. William
FREE
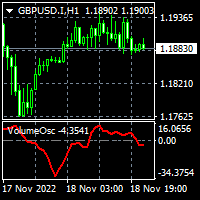
To download MT5 version please click here . The Volume Oscillator measures volume by analyzing the relationship between two Moving Averages. The Volume Oscillator indicator subtracts a fast MA from slow MA. The fast and slow MA periods are configurable via input tab. Volume indicators are an ingredient of trading systems to avoid entry in thin liquidity markets. Having set a threshold on Volume Oscillator you can avoid entering chop. Buffers are available to access via EA.
FREE

ADX Channel - это индикатор, который рисует канал в зависимости от показаний индикатора ADX (Average Directional Movement Index). Канал получается немного похож на Envelopes, однако его линии зависят от волатильности рынка. Сделка на продажу обычно осуществляется, когда цена коснется и отскочит от верхней линии канала, покупка - от нижней. Рекомендуется торговать в то время, когда нет важных новостей. Таймфремы, которые лучше использовать: M5 - H1. Индикатор не предназначен для торговли на таймф
FREE

This tools is design to easily forecast the projection of the current trend through the inputs of Zigzag and get out of the market when the trend do not the ability to maintain it's volatility to go further... the indicator gets the initial and final price from the value of zigzag automatically by adjusting the intdepth of zigzag. You can also switch from Projection to Extension from the inputs tab of indicator.
FREE

This indicator shows the breakeven line level for the total number of open positions of the current symbol with P/L value and total volume. This indicator is helpful to decide the exit level when using a trading grid strategy. The style of the breakeven line is customizable to choose the color, line shape and font size of the positions description. Send mobile notification when crossing a positive P/L target
FREE

+ 2 бонусные стратегии! + Алерты! Рекомендую посмотреть моего советника - Night Zen EA Индикатор объединил в себе наиболее популярные стратегии по скользящим средним: Простое пересечение скользящих средних. Пересечении скользящих средних относительно положения более медленной скользящей средней. 2 бонусные стратегии: Пересечение быстрой скользящей средней с расчетом цен открытия медленной скользящей средней с расчетом цен закрытия с учетом более медленной скользящей средней. (Настройки данной
FREE

A classical MACD indicator where both the MACD line and the Signal line are displayed as lines. The difference between MACD and Signal line is displayed as a histogram. A user can change the color and thickness of histogram lines. So, histogram lines can be grouped into four different groups: positive ascending, positive descending, negative descending and negative ascending. Multi-currency Dashboard for the indicator is available https://www.mql5.com/en/market/product/72354
FREE

This indicator is stand alone version from MP Pivot Levels (All in one) containing Demark's Pivots.
Calculations: PP = X / 4 R1 = X / 2 - LOWprev S1 = X / 2 - HIGHprev Uses: When the pair currency price may change the direction of movement. Possible constraints of support and resistance that creates plateaus for the currency pair prices. Tendency identification by comparing the present prices according to current day's pivot point and also the prior day's pivot points. ___________
FREE

Never miss a trend change again! This indicator uses various calculation methods based on price action to detect changes in the direction of the trend. It can be used on high timeframes (from H1 to D1) and is most suitable for H4 and Daily timeframe. This indicator is compatible with all broker symbols (forex, indices, CFD, commodities, crypto…). It is also possible to open the indicator on several charts to follow several symbols at the same time. In addition, you don't have to stand by your P
FREE

Индикатор использует линии Полос Боллинджера для обнаружения тренда. Очень полезный инструмент для ручной торговли. Кроме того, можно использовать индикатор с ATR в качестве фильтра, а также включить всплывающее уведомление при развороте тренда. Показатели индикатора очень понятны и просты в использовании. Лучше всего индикатор работает на таймфрейме H1.
Параметры советника: BarsCount - количество баров для расчета линии. BBperiod - период полос Боллинджера. BBdeviations - отклонения полос Бол
FREE

Индикатор дает сигналы при пересечении главной и сигнальной линий стохастика (младший стохастик) в сторону тренда, который определяется по двум стохастикам старших таймфреймов (старшие стохастики). Все знают, что стохастик дает точные сигналы в боковом рынке и много ложных сигналов в затяжном тренде. Комбинация двух стохастиков старших таймфреймов очень хорошо отфильтровывает ложные сигналы, показывая основную тенденцию. Индикатор лучше использовать на волатильных инструментах.
Особенности Мла
FREE

Этот индикатор сканирует несколько пар на нескольких таймфреймах в поисках значений RSI и рисует зеленые стрелки вверх для значений перекупленности RSI и красные стрелки вниз для значений перепроданности RSI в режиме реального времени.
Функции • Анимированное построение рядов • Изменяемый размер • Перемещаемый • Минимизируется • Несколько тем панели инструментов • Несколько таймфреймов • Вы можете открыть пару, нажав на нее • Текущая пара графиков отмечена другим цветом • Используйте пары для
FREE

FuturePriceM15 - один из немногих индикаторов, который делает прогноз цены прямо на ценовом графике. Алгоритм расчета индикатора основан на быстром преобразовании Фурье. Имея колебательное поведение цены, функция Фурье прогнозирует ее поведение в дальнейшем. Индикатор устанавливается обычным образом на график с торговым инструментом указанным в переменной symbol с периодом M15 , данный временной период является самым оптимальным для работы с любыми торговыми символами. После установки, индикато
FREE

The Multi-Timeframe High Low Points (MTF High Low Points) indicator is a powerful tool for traders using MetaTrader 4 (MT4) to analyze price movements across different timeframes. This versatile indicator helps traders identify significant support and resistance levels by displaying the highest and lowest price points within a specified number of bars on multiple timeframes simultaneously. Key Features: Multi-Timeframe Analysis: MTF High Low Points allows traders to monitor high and low price le
FREE
Description
The base of this indicator is an ZigZag algorithm based on ATR and Fibo retracement. This indicator is not redrawing in sense that the ZigZag's last shoulder is formed right after the appropriate conditions occur on the market. The shoulder doesn't change its direction afterwards (can only continue). Note: An indicator with advanced possibilities is also available.
Indicator input parameters
The input parameters allow to change the sensitivity of the ZigZag. ATR period ATR mul
FREE
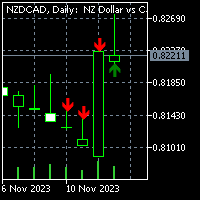
For MT5 version please click here . Introduction Most traders use candle patterns as a confirmation tool before entering a trade. As you know there are lots of candle patterns out there. However I realized most of them can be generalized in simple rules. So I developed my own candle pattern(Although I cannot say for sure this is mine). pattern description The pattern consists of three consecutive candles. This is true for most of the patterns out there (considering there is a confirmation nec
FREE

The product Divergence Mom Stoch Adx Bears Bulls is designed to find the differences between indicators and price. It allows you to open orders or set trends using these differences. The indicator has 4 different divergence features.
Divergence types Class A Divergence Class B Divergence Class C Divergence Hidden Divergence
Product Features and Rec ommendations There are 5 indicators on the indicator Indicators = Momentum Stochastic Adx Bears Bulls 4 different divergence types are used
FREE

BinaryFortune - индикатор, разработан и адаптирован специально для торговли краткосрочными бинарными опционами. Алгоритм индикатора, прежде чем выдать сигнал анализирует множество факторов. Устанавливается индикатор обычным способом. Сам индикатор состоит из информационного окна, где отображается имя торгового инструмента, уровни поддержки и сопротивления, непосредственно сам сигнал ( BUY , SELL или WAIT ). Появление торгового сигнала сопровождается также звуковым сигналом и окном Alert. Преиму
FREE
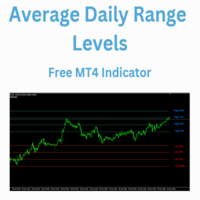
The Average Daily Range Levels indicator shows the ADR levels on the chart as if they were supports and resistances and is updated daily.
By default the indicator uses the 5-day average of the daily range. There are several strategies that suggest that these levels can be used to determine where the price can bounce and it is often said that the price can typically move 75% of the ADR.
In future versions I may add alerts at each level
Can you suggest any changes?
Greetings!
FREE

Индикатор, отображает на одном графике две различных пары, предназначен для упрощения отображаемой информации, Способен работать практически со всеми доступными в терминале инструментами (не только валютными парами, но и металлами, сырьем). Особенность использования для визуального метода корреляции для любых валютных пар SubSymbol. Валютная пара выводится на экран цветными свечами. Это та самая коррелируемая пара. Mirroring. Вспомогательная валюта. Средствами индикатора отражается два тип
FREE
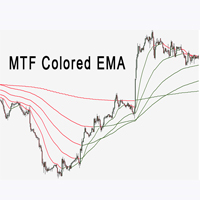
Индикатор Multi Time Frame EMA очень помогает в определении направления тренда. Это может быть отличным дополнением к вашей существующей стратегии или новой основой. Мы, люди, можем принимать лучшие решения, когда лучше видим визуально. Поэтому мы разработали его, чтобы показать разные цвета для восходящих и нисходящих трендов. Каждый может настроить его так, как ему удобно. Мы можем установить индикатор Ema для всех таймфреймов на графике.
Indikator Multi Time Frame EMA ochenʹ pomogayet v op
FREE

Если вам нравится этот проект, оставьте 5-звездочный обзор. Следуйте на instagram: borelatech Как институционалы торгуют большими объемами, для них не должно пытаться
защищать свою позицию на определенных процентных уровнях. Эти уровни будут служить естественной поддержкой и устойчивостью, которую вы
можете использовать
либо войти в торговлю или быть в курсе возможных опасностей против вашей
позиции. Этот осциллятор покажет вам вариацию процент для: День. Неделя. Месяц. Квартал. Год. В под
FREE

*This is tradingview bot converted to mql4*
The UT Bot Alert Indicator is an advanced technical analysis tool designed to help traders optimize their trading performance. This innovative indicator is based on the proven UT Bot system, which utilizes multiple indicators to deliver accurate signals that can help traders make better decisions. The UT Bot Alert Indicator provides a range of features that can help you stay on top of market trends and capitalize on opportunities. Here are some of i
FREE
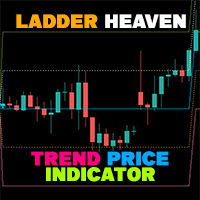
If you have difficulty determining the trend as well as entry points, stop loss points, and take profit points, "Ladder Heaven" will help you with that. The "Ladder Heaven" algorithm is operated on price depending on the parameters you input and will provide you with signals, trends, entry points, stop loss points, take profit points, support and resistance in the trend That direction.
Helps you easily identify trends, stop losses and take profits in your strategy!
MT5 Version: Click he
FREE

Фрактальная дивергенция - это скрытая дивергенция , построенная на фракталах Билла Вильямса. Бычья фрактальная дивергенция представляет собой комбинацию из двух нижних фракталов, последний из которых расположен ниже предыдущего, и при этом две свечи справа от минимума последнего фрактала имеют минимумы выше уровня предыдущего фрактала (см. скриншот 1). Медвежья фрактальная дивергенция - это комбинация из двух соседних верхних фракталов, последний из которых расположен выше, чем предыдущий верхни
FREE

Индикатор R Inside Bar для Metatrader 4 предоставляет простые в использовании уровни ценового прорыва на основе внутренних баров.
Он работает на чистом ценовом действии и не перерисовывается, а всплывает в главном окне графика MT4 в виде двух цветных горизонтальных линий выше и ниже фактического внутреннего бара.
Зеленая горизонтальная линия действует как сопротивление, а красная — как поддержка.
Идея длинной и короткой торговли Открывайте ордер на покупку, если свеча закрывается выше зел
FREE

This indicator calculates gann support and resistance prices with use gann pyramid formulation and draw them on the chart. And If you want, Indicator can alert you when the current price arrive these pivot levels. Alert Options: Send Mobil Message, Send E-mail, Show Message and Sound Alert Levels: S1, S2, S3, S4, S5, R1, R2, R3, R4, R5 Inputs: GannInputPrice: Input price for gann pyramid formulation. GannInputDigit: How many digit do you want to use for calculation formula. (The number and the
FREE

Basic Fibonacci Calculation Indicator
shows Trend, Stoploss, Profit 1,2,3, will show you your daily Highs and your Daily Lows , it will also show you where it expects the price to move to. best time frame is H1 or higher .
For a better system that also includes my Non-repaint Indicator please check out my paid Fibo Indicator https://www.mql5.com/en/market/product/82323
FREE

FREE TopClock Indicator: This indicator is an Analog Clock That Shows: Local Time Of Pc or Time Of Broker Server or sessions(Sydney -Tokyo London -NewYork)Time or custom Time( with GMT -Base) this can shows Candle Time Remainer with Spread live. You can run this indicator several times for different times and move it to different places on the chart. If you would like, this indicator can be customized for brokers and their IB based on customer needs. For more information contact us if you
FREE
First of all, it is worth highlighting here that this Trading Indicator is Non Repainting, Non Redrawing and Non Lagging, which makes it ideal for manual trading. Never repaint and recalculate Once an arrow appears it never disappears, the signal comes at the opening of the new candle You will now be more profitable with this indicator You can do swing trading or scalping trading The indicator helps you identify the trend Can be optimized across all pairs and time frames Blue arrow is for buyin
FREE

You can find full version here: Harmonic Pattern Scanner MT4 Harmonic Pattern Scanner MT5 Introduction Harmonic Patterns are best used to predict turning point. Harmonic Patterns give you high win rate and high opportunities for trade in during one day. This indicator detects the best and successful patterns base on Harmonic Trading books by Mr. Scott M.. Main Features Detect the best and most successful patterns : Gartley, Bat, Crab, Butterfly, Cypher, Shark, Alt_Bat, Deep_Crab Easy-
FREE

The MACD 2 Line Indicator is a powerful, upgraded version of the classic Moving Average Convergence Divergence (MACD) indicator.
This tool is the embodiment of versatility and functionality, capable of delivering comprehensive market insights to both beginner and advanced traders. The MACD 2 Line Indicator for MQL4 offers a dynamic perspective of market momentum and direction, through clear, visually compelling charts and real-time analysis. Metatrader5 Version | How-to Install Product | How-t
FREE

The indicator is a 15-minute signal indicator for all types of traders. Meaning, you could make lots of profits trading two different signals in one indicator.
NOTE: Both indicators are channels for achieving the same result. RED ARROW -- Sell Signal BLUE ARROW -- Buy Signal
Purchase now to be part of our community. We offer standard chart setups for both novice and intermediate traders. Trade with ease!
FREE
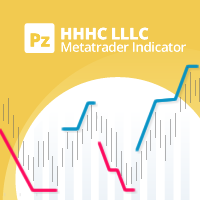
Пользовательская реализация известного трендового принципа "более высокий максимум - более высокая цена закрытия и более низкий минимум - более низкая цена закрытия" (higher high, higher close, lower low, lower close: HHHC - HHHL). Индикатор использует движение цены для определения направления тренда, его смены и зон отката. Настраиваемый период прорыва Настраиваемые цвета и размеры Не перерисовывается, не меняет значений Доступны все типы алертов. Отображает три ценовые зоны: Зоны на покупку от
FREE

Check my p a id tools they work perfect please r ate Adjustable PIN BAR indicator is usefull tool alowing to search for pin bars you wish to find on the price chart, it has 2 parameters to filter out what type of pin bars you wish to search for: 1) MinTailProc 75% (default) which means to show pin bars that has minimum size of the Nose (Tail) as 75% of full candle size. If Upper Nose (Tail) size of the candle is minimum 75% of the candle size fully than candle is painted in RED. If Lower Nose
FREE

Индикатор вычисляет и рисует линии на графике. Два типа тренда: Тренд A: линия отрисовывается по локальным минимумам для восходящих трендов и по локальным максимумам - для нисходящих. Тренд Б: линия отрисовывается по локальным максимумам для восходящих трендов и по локальным минимумам — для нисходящих. Нужно, чтобы ситуация полностью удовлетворяла нескольким условиям, которые можно настроить во входных параметрах (см. также рис. 4): MinBarAge : количество баров до последней базовой точки линии н
FREE

С помощью индикатора можно 1 Выявлять тренд и идти за большим и малым трендом прокладывая линии. Когда цена выходит из коридора линий, то с большой вероятностью цена пойдёт до следующей линии и развернётся на ней.
2 Долгострочно - Прокладывать линии по центрам фракталов, индикатор может выявлять фрактал второй точки ( Number bars analysis). Зачастую цена может приблизиться к линии даже через неделю или месяц и можно открывать сделку на разворот. Если волна прошла широкая и мы хотим поймать разв
FREE

Sometimes a trader needs to know when a candle will close and a new one appears to make the right decisions, this indicator calculates and displays the remaining of current candle time . It is simple to use, just drag it on the chart. Please use and express your opinion, expressing your opinions will promote the products. To see other free products, please visit my page.
FREE
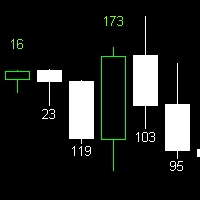
Candle Size Indicator Explore the candle size using this convenient indicator. It works across various timeframes, providing valuable insights for technical analysis. Key Features: Display the size of the candle after configuring the indicator. Compatible with all timeframes. The size of the candle is a significant metric in technical analysis, offering insights into market strength and volatility. This indicator enables clear and accurate visualization of candle sizes on your chart. Utilize thi
FREE

R Chimp Scalper — отличный торговый инструмент как для форекс-скальперов, так и для внутридневных трейдеров.
Сигналы этого скальперского индикатора очень четкие и легко читаемые.
Он рисует зеленые и красные бары выше и ниже нулевого уровня в отдельном торговом окне: Зеленые столбцы выровнены выше нулевого уровня, что указывает на бычий тренд скальперов. Красные столбцы выровнены ниже нулевого уровня, что свидетельствует о медвежьем тренде скальперов. Показания индикатора выше нулевого уровн
FREE

Волатильность под контролем. Индикатор показывает оптимальную глубину для установки целей внутри дня и на среднем тренде. Также он строит опорные зоны для предполагаемой глубины коррекции. В качестве сопровождения отображаются ключевые уровни структуры по нескольким таймфреймам. Для расчёта используются классические индикаторы волатильности ATR & ADX на фиксированных таймфреймах. В расчётах учитывается спред, и если рынок слабо волатилен вы увидите предупреждение о риске. Можно менять цвет всех
FREE

Эта система поможет найти высоковероятностные сделки в направлении сильных трендов. Возможность заработать прибыль появляется с помощью поиска завершения движения в одну сторону.
Важная информация Для максимального использования потенциала сканера прочитайте полное описание (на английском языке): www.mql5.com/en/blogs/post/718109 Использование индикатора описано в записи в логе (на английском): Professional Trading With Strong Momentum Бесплатная версия индикатора работает только на парах EURU
FREE
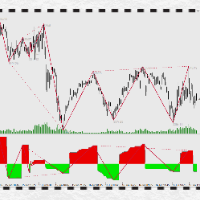
万能背驰指标简介(DivergenceLines) 注意注意,这个指标不能单独运作,对以下两个指标有依赖,请确保先获得以下两个指标后才购买本指标! 1) 动力之梯(PowerTrapezoid) (力度评估副图指标,本指标) 2) 万能分段(LinesSegment) (线段划分主图指标) 。 3)万能背驰(DivergenceLines,本指标) (比较力度背离主图指标)。 指标原理: 通过获取动力之梯指标的筹码堆积值,依照万能分段指标为依据,对同向线段向前回朔,进行一一对比,当后面线段力度比前面力度小时,定义为背驰(背离),背驰的两个高点(或两个低点)之间可以连接一条背驰线,当某个高点(或低点)连接的背驰线越多,这个点就构成了多个单级别背驰区间套。
FREE

Индикатор фрактал - один из основных в различных стратегиях. Индикатор Volume Fractals расширил функциональность стандартной версии, получил настройки фильтрации фракталов и отображение объемных фракталов, где объемный фрактал - это экстремум не только по цене, но и максимум по объему.
Применение Установка стоп-лоссов Сигнал на разворот Установка отложенных ордеров на пробой фрактала
Настройки Bars of history - количество баров графика, для которых рисуется индикатор Left side minimum bars -
FREE

Индикатор Blahtech Moving Average - модифицированная версия стандартного индикатора Moving Average. Он также дополнен настраиваемыми оповещениями, разделителями периодов и другими возможностями настройки. 50-дневная и 200-дневная скользящие средние широко применяются инвесторами и трейдерами, а прорывы вверх и вниз от линий MA считаются значимыми сигналами.
Основные особенности До трех таймфреймов Настраиваемые переменные для вычислений Настраиваемые оповещения и сообщения Дополнительные перио
FREE

Индикатор предназначен для определения максимумов и минимумов на рынке. Максимумы и минимумы определяются фрактально, то есть рынок сам создает алгоритм и структуру индикатора, в отличие от ZigZag, в котором имеется жесткий алгоритм, влияющий на конечный результат. При помощи данного индикатора, можно получить иное представление ценового ряда, выявить закономерности, которые сложно найти на стандартных графиках и таймфреймах. Индикатор не перерисовывается, но работает с небольшой задержкой. Для
FREE

STOCH AND RSI ALERT https://www.mql5.com/en/users/earobotkk/seller#products (I have created a dashboard from this product, please take a look by clicking here ) (I have also created an EA from this product, NOW user can go automation, click here ) P/S: If you like this indicator, please rate it with 5 stars in the review section, this will increase its popularity so that other users will be benefited from using it. This indicator notifies and draws an arrow on the chart whenever the main sto
FREE

EZ Risk Reward Ratio — это простой в использовании индикатор MT4, который позволяет пользователю автоматически изменять соотношение риска и вознаграждения для открытой сделки, просто перетаскивая линии тейк-профита или стоп-лосса в желаемые позиции на любом графике. Соотношение риска и вознаграждения отображается в любом углу, и его можно изменить, просто перетащив линии TP и SL. Сначала поместите индикатор EZ Risk Reward Ratio на график MT4, где должна быть размещена сделка. Во-вторых, откройте
FREE
RaysFX Trade Info Ciao a tutti, sono entusiasta di presentarvi il nostro ultimo indicatore, RaysFX Trade Info . Questo strumento è stato progettato per fornire informazioni dettagliate sulle vostre operazioni di trading direttamente sul vostro grafico MT4. Caratteristiche principali Informazioni in tempo reale : RaysFX Trade Info fornisce informazioni in tempo reale sulle vostre operazioni aperte e chiuse. Potete vedere il profitto in punti, in valuta e in percentuale. Personalizzabile : L’in
FREE

Индикаторы для трендовых!
Торговая система, построенная на трех скользящих средних. Торгуйте по тренду и позвольте прибыли расти. Necessary for traders: tools and indicators Waves automatically calculate indicators, channel trend trading Perfect trend-wave automatic calculation channel calculation , MT4 Perfect trend-wave automatic calculation channel calculation , MT5 Local Trading copying Easy And Fast Copy , MT4 Easy And Fast Copy , MT5 Local Trading copying For DEMO Easy And Fast Copy , M
FREE

The XR Gartley Pattern MT4 is an indicator which displays and alerts Gartley pattern detected on the candlestick chart. It also displays potential trade with calculated Take Profit and Stop Loss, Timeframe H1. After purchasing XR Gartley Pattern, you can immediately download this indicator from the MT4-MT5 Market and start using it because all features are set to default, is not necessary to change any parameter. In addition, we have created a private group for customers who have purchased one
FREE

Indicator automatically draw bullish and bearish engulfing without any rules. Bearish and Bullish engulf is well known area for supply and demand area marking. This indicator can be used in any strategy that required supply demand zone. Show Last Engulf : Enable this option to show unfresh engulfing Candle to calculate : set 0 will load all history bar and can use up more memory Bearish Engulfing Colour : Pick any colour that suit Bearish Engulfing Colour : Pick any colour that suit
-Use thi
FREE
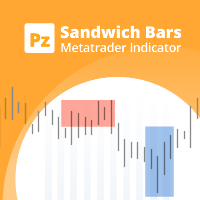
Данный индикатор определяет паттерны Sandwich Bars по нескольким диапазонам, весьма надежные паттерны пробоя. Просто и эффективен в использовании Настраиваемые диапазоны баров Настраиваемый выбор цвета В индикаторе предусмотрены визуальные/почтовые/push/звуковые уведомления. Индикатор не перерисовывается и не рисует на истории Паттерн Sandwich состоит из одного бара, поглощающего несколько прошедших баров, пробивая и отклоняя весь ценовой диапазон. Синяя рамка - бычий пробой Красная рамка - медв
FREE

Индикатор отображает в виде стрелок пересечение индикатора Скользящая Средняя Осциллятора (Moving Average of Oscillator, OsMA) нулевого уровня. В индикаторе есть уведомление при появлении сигнала - всплывающее окно (Alert), отправка на EMail.
Параметры Fast EMA Period - Быстрое EMA – скользящая средняя от цены, экспоненциального типа, с коротким периодом. Slow EMA Period - Медленное EMA – тоже экспоненциальная скользящая средняя рыночной цены, но уже с более длинным периодом. Signal SMA Period
FREE
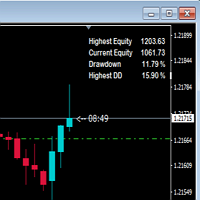
This indicator shows drawdown based on highest equity. Usually drawdown is used to show performance of a trading account especially when someone participate in a trading contest. If drawdown exceed a determined number, the contest account will be disqualified. So, I hope, this indicator will warn us in maintaining the drawdown and the account still be saved.
FREE

Screener Breakout Congestion: Have you ever missed a trading opportunity because you were not looking at the chart of that market in that specific time frame? Here is this screener to help you identify congestion breakouts in the markets you want to follow in the different time frames required. Once you have identified the markets (forex, indices, CDF) and the different time frames (1M, 5M, 15M, 30M, 1H, 4H, Daily), the screener is represented by several buttons that change colour when the conge
FREE

All traders should know the trend before making their decision when placing the buy or sell orders. The first step always starts with supply and demand , rising and falling channels , trend lines, engulfing candles etc. All the above contribute to what is called “Price Action” and that is the best and most reliable way in trading and catching the trend and making profits, without stress. The Investment Castle Trend Line Indicator will automatically draw the trend lines on the MT4 for you. An
FREE

Поведение разных валютных пар взаимосвязано. Индикатор Visual Correlation позволяет на 1 графике отображать разные инструменты с сохранением масштаба. Вы можете определить положительную, отрицательную корреляцию или ее отсутствие. Некоторые инструменты начинают движение раньше остальных. Такие моменты можно определить при наложении графиков. Для отображения инструмента на графике в поле Symbol необходимо ввести его название. Версия для МТ5 https://www.mql5.com/ru/market/product/109155
FREE

Реализация индикатора рыночного цикла описанного Раджи Хорнер в книге "FOREX на 5 часов в неделю: как зарабатывать трейдингом на финансовом рынке в свободное время" . Текущее состояние рынка можно определить посредством анализа угла наклона экспоненциальной скользящей средней (EMA) работающей на периоде 34 бара. Если наклон EMA определяется как направление часовой стрелки на циферблате: от 12 до 2 часов, следует считать, что присутствует восходящая тенденция; от 2 до 4 часов, рынок консолидирует
FREE

The ADX Indicator is known to be used to determine the trend direction. Not only that, but it also has deviation (+DI and -DI) that determine the direction of the trend as well. The role of the indicator is to spot the trend and its direction and generate signals accordingly.
Indicator Settings: - ADX period : default is 14 periods (it works best with the timeframe H1). - Signal Width : the size of signals arrows. - Signal Distance : the distance of the signal arrow from the candle. - Signal c
FREE
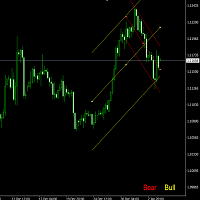
This indicator judges current trend, with Linear regression and the angle. Each parameters setting contents below. Period Period from current
Angle The angle of judging the trend
Width of Lines Width of Linear regression lines* Font size Font size of display text
Lines&Text colour Colour of display lines and test
* This parameter judges that if lines spreads too wide, there is no trend.
FREE
BinaryPin - индикатор, разработан и адаптирован специально для торговли краткосрочными бинарными опционами. Алгоритм индикатора, прежде чем выдать сигнал анализирует множество факторов, такие как волотильность рынка, ищет патерн PinBar, расчитывает вероятность успеха при совершении сделки. Устанавливается индикатор обычным способом. Сам индикатор состоит из информационного окна, где отображается имя торгового инструмента, значение вероятности совершения успешной сделки, непосредственно сам си
FREE

This indicator will show yesterday and today high low, very useful to understand the market sentiment. To trade within the range/ break out. Previous day low- can act as support- can used for pull back or break out Previous day high- can act as resistance- can used for pull back or break out The previous day high low breakout strategy refers to the day trading technique that provides traders with multiple opportunities to go either long or short . The main idea is to identify the trend in its m
FREE

This indicator is an addition to "Trend Edges."
The "Trend Edges histogram" indicator determines whether the trend is rising or falling. It is suitable for any time frame (tested on DAX).
Find a trending pair, index or CFD. Additionally :
-Sound alert on trend change.
-Alert Notification
-Alert Notification on your mobile phone Check my other indicators.
FREE

This indicator plots in the candles the divergence found in the selected indicator and can also send a notification by email and / or to the cell phone.
Works on all TIMEFRAMES. Meet Our Products
He identifies the divergences in the indicators:
Relative Strength Index (RSI); Moving Average Convergence and Divergence (MACD); Volume Balance (OBV) and;. iStochastic Stochastic Oscillator (STOCHASTIC).
It is possible to choose the amplitude for checking the divergence and the indicator has
FREE

Мультитаймфреймовый индикатор фракталов, который показывает фрактальные точки старшего таймфрейма на младших таймфреймах.
Параметры Fractal_Timeframe : старший таймфрейм для фракталов. Maxbar : максимальное количество свечей для вычислений. Up_Fractal_Color, Up_Fractal_Symbol, Down_Fractal_Color, Down_Fractal_Symbol : настройки цветов и стилей фрактальных точек. Extend_Line : рисовать горизонтальную линию из предыдущей фрактальной точки до перекрывающей ее свечи или до указанной длины. Extend_
FREE
MetaTrader Маркет - лучшее место для продажи торговых роботов и технических индикаторов.
Вам необходимо только написать востребованную программу для платформы MetaTrader, красиво оформить и добавить хорошее описание. Мы поможем вам опубликовать продукт в сервисе Маркет, где его могут купить миллионы пользователей MetaTrader. Так что занимайтесь только непосредственно своим делом - пишите программы для автотрейдинга.
Вы упускаете торговые возможности:
- Бесплатные приложения для трейдинга
- 8 000+ сигналов для копирования
- Экономические новости для анализа финансовых рынков
Регистрация
Вход
Если у вас нет учетной записи, зарегистрируйтесь
Для авторизации и пользования сайтом MQL5.com необходимо разрешить использование файлов Сookie.
Пожалуйста, включите в вашем браузере данную настройку, иначе вы не сможете авторизоваться.