Konstenfreie technische Indikatoren für den MetaTrader 4 - 16

X-axis lines prevail in grid manner, ruled by Average True Range. There’s an inevitable change in specific periods of time of this matter! The Average True Range (ATR) indicator is not directly based on volume. Instead, it measures volatility in price movements. It’ll stretch, expand, shrink, and evolve with 4 timely choices of grid states! MATR means “multiplying average true range” in which grandeurs the grid pip-distant levels, seeming to grasp a wave of perfectly synched parameters in ac
FREE
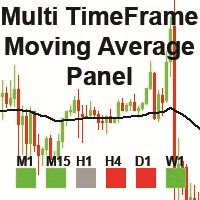
The "MTF Moving Average Panel" indicator is more of a helping tool than an indicator, it serves to help traders to spot the trend direction without having to change the timeframe and check all timeframes. It is best used with other indicators and signals, to help filter the signals according the trend based on multiple timeframes.
Indicator inputs : - Moving Average period : The period for the Moving Average. Default is set to 50 periods. - Moving Average method : The method of calculation of
FREE
The purpose of this new version of the MT4 standard indicator provided in your platform is to display in a sub-window multiple timeframes of the same indicator. See the example shown in the picture below. But the display isn’t like a simple MTF indicator. This is the real display of the indicator on its timeframe. Here's the options available in the FFx indicator: Select the timeframes to be displayed (M1 to Monthly) Define the width (number of bars) for each timeframe box Alert pop up/sound/ema
FREE

FXDragunov.MyThemes. Forex Chart Color Themes.
Chart templates are responsible for chart layout and for contents of technical indicators applied to them.
Chart templates are used: When customizing an opened chart window. When customizing settings of a new chart window. When customizing a chart opened via the “New chart” window.
Original code by FXDragunov Indonesia
FREE
Waddah Attar Statistical Predictor
This indicator show you the Statistical Forecast for any symbol. it depends on a history data . the result show on a new day and still with no change until end of the day . with this indicator you can : know the main direction . know the range of the movement . know high and low in the current day . use indicator levels in any expert you made to auto trade .
Preferably used with main symbols like EURUSD, GBPUSD, AUDUSD, NZDUSD, USDJPY, USDCHF, USDCAD, Gold,
FREE

CoralDash is a simple symbol shortcut dashboard. The Symbol List has many presets to choose from: Market Watch Open Orders Current Chart Majors A custom list Clicking the symbol has two available actions Set the current chart symbol Filter the list of symbols shown in the dashboard based on one currency (e.g., see all EUR pairs) Click the "PAIR" cell in the header to toggle between the two available actions Click the symbol cell to apply the action For the filter, click the left side to selec
FREE

This indicator shows the strength of each currency compared to the US dollar by calculating the rate of change in price over a specified time period. When you open the indicator, you'll see a list of different currencies on the price chart. Each currency will have a numerical value indicating its strength level compared to the US dollar, where: If the value is higher than the US dollar, it will be displayed in green, meaning that currency is stronger than the dollar. If the value is lower than
FREE

Quante volte ti è capitato di aver bisogno di avere a grafico i livelli chiave di una candela chiusa del time frame precedente? Con PastProjection potrai far disegnare i livelli di Apertura, Chiusura, Massimo e Minimo della candela chiusa al time frame superiore scelto. I livelli sono spesso importanti e diventano supporti o resistenze, o entrambi. La prima volta che vengono raggiunti spesso fanno reagire la quotazione. I pattern su questi livelli sono spesso più efficaci. Tali livelli sono sign
FREE
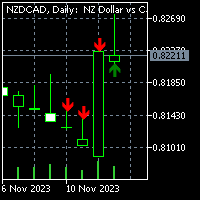
For MT5 version please click here . Introduction Most traders use candle patterns as a confirmation tool before entering a trade. As you know there are lots of candle patterns out there. However I realized most of them can be generalized in simple rules. So I developed my own candle pattern(Although I cannot say for sure this is mine). pattern description The pattern consists of three consecutive candles. This is true for most of the patterns out there (considering there is a confirmation nec
FREE

The indicator finds strong trend movements of a currency pair over the specified number of bars. It also finds correction to this trend. When the trend is strong enough, and the correction becomes equal to the values specified in the parameters, the indicator generates a signal. You can set different correction values, while the best suiting are 38, 50 and 62 (Fibonacci levels). In addition, you can configure the minimum length of trend, the number of history bars for search and other parameters
FREE

Targets is an indicator to determine potential turning points , targets are calculated to determine levels in which the sentiment of the market could change from "bullish" to "bearish." This indicator can be used in any timeframe and any currency pair: IN CASE YOU DON'T SEE THE INDICATOR WHEN YOU ADD IT TO YOUR CHARTS JUST OPEN THE INDICATOR MENU AND CLOSE THE MENU AGAIN PLEASE TAKE NOTICE: For best results use this indicator as an extra tools after you have completed your regular analysis an
FREE

Having trouble marking where the various forex sessions start and end? Or perhaps your strategy requires you trade only in a specific session, then this is for you.
The session indicator shades the session you require in a certain color so that you can identify it easily. The sessions shown include: London session, New York session, Asian Session, Asian - London overlap and London - New York Overlap.
Difference source give varying time ranges for the various session, mostly differing by not
FREE

This is a standard moving average indicator. I have added a quick control panel in the bottom left corner for it. When multiple different parameters of this indicator are simultaneously enabled, the control panel can quickly switch between different parameters of the indicator, making it easier to observe multiple indicators simultaneously Parameter description: Indicator ID: The unique ID of the indicator. When starting multiple instances, this ID must be unique and cannot be duplicated. Contro
FREE

Supertrend Moving Average A combination of Supertrend and Moving Average to create a converging trade setup Input parameters: signal mode: set it to true if you want to plug it into STAT (Signal Tester and Trader) arrow shift: distance between fast EMA line to arrow on chart turn on moving average signal for converging setup supertrend period ATR multiplier Moving average period Averaging method Pricing You can find the best setting for 4 hour EURUSD on this video
FREE

After 7 years I decided to release some of my own indicators and EAs for free.
If you find them useful please Show support with a 5-star rating! Your feedback keeps the free tools coming! See other my free tools as well here
_________________________________ Volume Moving Average (Volume MA) Indicator for Advanced Forex Market Analysis Introducing the Volume Moving Average (Volume MA) Indicator, meticulously developed in MQL4, a pivotal tool for enhancing your forex trading str
FREE

Sweep Trend Der Indikator markiert auf dem Chart in Form eines Rechtecks volatile Teile der Kursbewegung gemäß den festgelegten Einstellungen.
Beschreibung der Einstellungen TrendPips - Filterwert in Punkten TrendBars - Filterwert in Anzahl Balken signal_shift - Verschiebung relativ zum aktuellen Balken um eine angegebene Anzahl von Perioden nach hinten, für Signale CountBars - die Anzahl der Balken zur Anzeige des Indikators Color_1 - eine der Farben der abwechselnden Rechtecke Color_2 - di
FREE

Traditional RSI is one of the most popular and must-known indicator that every traders would use. In this combination, we use two RSI period with smoothed factor to smooth the RSI lines for better results. Besides, bottom of Indicator is the Trend-filter display in different colors in order to let Traders identify the trends much easier Grey : Sideway market Light-Blue : Weak UP-Trend Blue : Strong UP-Trend Light-Red : Weak DOWN-Trend Red : Strong DOWN-Trend Signal: Blue-Arrow
FREE

This indicator provides common shapes as drawing object options. The shapes are rotatable, resizable, draggable, and will keep their proportions (according to their handle trendline) across different chart scales. Multiple drawings are supported.
Shapes: Square Rhombus
Triangle (quadrilateral & isosceles) Circle (grid, overlapped grid, flexi grid, rotatable grid, concentric circles) Features: rays (all object edges will be rays) show/hide each individual drawing type, or all delete last drawn
FREE

This indicator determine price volatility using correlation between Price and Time. WARNING: Not suitable for 1M timeframe, you would not see any lines in this frame!
How to Use:
More closer the indicator's value to 0, the price is considered more volatile. When reversal is started, the indicator's value would be rise or fall significantly. During a strong trend, the indicator's value would be closer to 1 or -1, depends on current trend. Entry Signal:
BUY SIGNAL: Indicator crosses 0.2 from
FREE
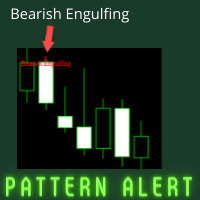
Welcome to pattern alert indicator page. This indicator designed for alerting purpose of Bullish and Bearish engulfing pattern alert. This stuff is suitable for 1 hour, 4 hour and 1 day time frame. high winning ratio is tested. Buy Alert: when the bullish engulfing pattern alert is noticed. Sell Alert: when the bearish engulfing pattern alert is noticed. See the attached screenshots for more clarity. Happy trading !!! Open Account (Get $15 cash back for each and every 1 lot trades has done) : ht
FREE

Rua Pinbar This is an indicator to help you quickly identify pinbar candles in the chart. Can be used on any currency pair and any time frame you want. This indicator is often used to determine entry points. You can refer to the product here: https://www.mql5.com/en/users/phamruacoder/seller
A product of Ruacoder Get code indicator and robot (EA) as required.
FREE

Tester Periods is the useful indicator for visual strategy tester which extend chart periods. Its designed for the trading utility Trade Shell (included Trade Shell SMC ).
Run the Trade Shell on the visual tester. Then put the Tester Periods indicator on the chart. If you wanna see timeframes M1, M5, M10, M15 , for example, then you have to run visual tester on M1 and to define multipliers like that: TimeFrame_Periods_Multiplier = 1,5,10,15 If you wanna see timeframes M5, M20, M30, H1, fo
FREE
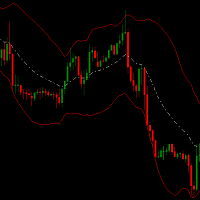
Channel hero indicator is a special channel which helps you to detect oversold/ overbought areas. It can be a complementary indicator for your strategy.
It can be combined with bollinger bands . When price breaks above bollinger bands and upper channel hero band is above bollinger band and also
the white line (middle channel hero line) is above middle BB then this point has big possibility to go up. A good closing point can be when middle channel hero line cross below middle bollinger band
FREE

This Dashboard is free to download but is dependent on you owning the Advanced Trend Breaker . Get the indicator here: https://www.mql5.com/en/market/product/66335
The Dashboard will show you on a single chart all the timeframes (M1 to Monthly) with their own status for the indicator: Advanced Trend Breaker
all time frame and all symbol: smart algorithm detects the trend,Support and resistance, filters out market noise and find breaker of entry signals!!!
!!!
How to unders
FREE
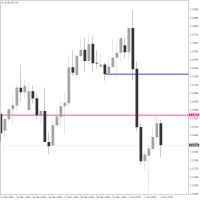
Crosshair Levels : Free version of Object Synchronizer. ** No synchronization of objects among grouped charts and no group chart features supported in this version. Are you bored to save and load template many times for the same symbol for many chart time frames? Here is the alternative. With this indicator, you enjoy creating 3 objects. All objects that you created/modified always are moved easily with clicking the object, moving cursor to the point you wanted and clicking again). Supported
FREE

Dieser Indikator ändert kontinuierlich die Farbe der Kerzenränder und -körper sowie die Farbe der Volumen in Echtzeit. Der Indikator ist einfach zu bedienen. Die Farbpalette ist vielfältig. Da es sich bei diesem Produkt um eine grafische Lösung handelt, ist es schwierig, seine Funktionsweise in Textform zu beschreiben; es ist einfacher, wenn man es herunterlädt. Der Indikator eignet sich für Blogger, die ein schönes Bild eines Charts für die Videobearbeitung erstellen wollen, oder für Händler,
FREE

The SDX Chart is a free additional indicator which can be used in combination with SDX Dashboard .
Features Ability to review the history of each symbol and time frame. Ability to change symbols and time frames with one click. Works perfectly in combination with SDX Dashboard and helps you to understand the system better. Settings
MA Period - number of periods for the calculation of the moving average and the standard deviation. Number of Bars - how far back to draw the indicator. Buttons Siz
FREE
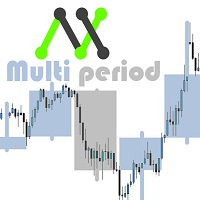
Mit diesem anpassbaren Indikator werden Sie in der Lage sein, andere Zeitrahmen neben dem üblichen zu beobachten. Auf diese Weise werden Sie das allgemeine Umfeld, in dem sich der Preis bewegt und wahrscheinlich ihre Effektivität besser sein wird, besser kennen lernen. *Es ist wichtig, dass der Zeitrahmen im Indikator größer ist als der in Metatrader festgelegte. Ich werde bald mehr Indikatoren kostenlos teilen. Wenn Sie irgendwelche spezifischen Ideen eines Indikators haben, die Sie haben möcht
FREE

Pattern Explorer is a reliable tool for applying all the power of the most popular Japanese Candlestick Patterns . It uses Machine Learning algorithms to confirm all the patterns. What is the most impressive thing about it? Select Take Profit and Stop Loss and click on “Backtest your strategy” button to backtest your strategy in real time and to see according to your selection: Total signals Testable signals (signals that are reliable to be tested) Profitable signals (%) Loss signals (%) Total p
FREE
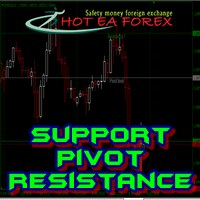
How To Trade
Execute your trades in 3 Easy Steps!
Step 1: Trade Setup Entry Buy = If daily open market Above Line PIVOT or can Price has touched and closed the candle above Resistance1. Entry Sell = If daily open market Under Line PIVOT or can Price has touched and closed the candle above Support1. Step 2: Set Stop Loss Stop loss BUY ----> You can set stop loss on Line Pivot or Support1. Stop loss SELL ----> You can set stop loss on Line Pivot or Resistance1. Step 3: Set Take Profit Take pro
FREE

Hier sind mehrere Indikatoren, die zusammenarbeiten. Es funktioniert im Grunde mit gleitenden Durchschnitten und verschiedenen Ebenen von ATR, die einen dynamischen Kanal schaffen, durch den der Preis entwässert wird. Wie ich immer empfehle, sollten Sie es versuchen, bevor Sie es live verwenden, damit Sie verstehen, wie es funktioniert. Das Markteintrittssignal ist ähnlich wie bei anderen MA-Indikatoren, aber mit diesem haben Sie auch eine grafische Analyse des Moments, wenn der Trend gefunden w
FREE

There are time periods in the market, when trading is highly likely to be unprofitable. This indicator warns you about such non-trading situations and helps you preserve your money and time.
Parameters Remind about non-trading periods: Expiration week - remind about the expiration week Consumer index day - remind a day before the release of Consumer index day NON FARM - remind a day before the release of NON FARM Christmas - remind a day before Christmas New Year Days 25.12 - 15.01 - remind ab
FREE

The selective pin bar is designed to identify reversals. To use the selective pin bar effectively, traders typically look for Strong Rejection: The tail of the pin bar should extend significantly beyond the surrounding price action. It indicates that there was a sharp rejection of higher or lower prices during the trading period. A strong rejection suggests that the market sentiment may be changing.
FREE

The Trend Finding Channels indicator was developed to help you determine the trend direction by drawing channels on the graphical screen. It draws all channels that can be trending autonomously. It helps you determine the direction of your trend. This indicator makes it easy for you to implement your strategies. The indicator has Down trend lines and Up trend lines. You can determine the price direction according to the multiplicity of the trend lines. For example , if the Down trend lines s
FREE

Ska ZigZag Line indicator determines the overbought and oversold regions within a trend. The indicator determines the overbought region by the candlestick high and the oversold region by the candlestick low in a form of a line. To utilize the full strategy i recommend using "Ska ZigZag Line" together with "Ska ZigZag BuySell". NOTE: This indicator is a line based indicator. HOW TO USE: Sell Signal; Place a sell trade when the Ska ZigZag BuySell indicator arrow appear on top of the Ska ZigZag Lin
FREE

Active Price Lines
Indicator gives you full custom control over the Bid and Ask price lines, both color and style. Color control is also customizable based on increased or decreased price by the tick.
Options include: Show both the Bid line and the Ask line Set unique color for each Set unique line style for each Set unique color for increased price (by the tick) Show only Bid line Show only Ask line
Rider Capital Group
FREE

Wicks UpDown Target GJ
Wicks UpDown Target GJ is specialized in GJ forex pairs.
Choppy movement up and down on the opening range every day. Trading breakouts on London session and New York session is recommended.
Guideline Entry Strategy Idea:
Step 1 - Breakout Forming (Warning! Trade on London Session and New York Session) Step 2 - Breakout Starting (Take Action on your trading plan) Step 3 - Partial Close your order & set breakeven (no-risk) Step 4 - Target complete Step 5 - Don't tr
FREE

This indicator shows ratios between extremes on the chart. You can specify your own ratios (e.g. Fibonacci).
Parameters Most important Density - how much in details to search ratios in extremes. Bigger number means less details, smaller number means more details. Base unit is 1 bar on the chart. History - how far to go in history while searching. When you set -1, the indicator processes all bars from history. Base unit is 1 bar on the chart. Range - how far search ratios from given extreme. Ba
FREE

This tools is design to easily forecast the projection of the current trend through the inputs of Zigzag and get out of the market when the trend do not the ability to maintain it's volatility to go further... the indicator gets the initial and final price from the value of zigzag automatically by adjusting the intdepth of zigzag. You can also switch from Projection to Extension from the inputs tab of indicator.
FREE

Simple indicator that shows external ( outside ) bars. In certain cases, external bars can be seen as strong trend bars instead of range bars. This can be observed when a with-trend external bar occurs at a reversal from a strong trend. It will help you notice more easily different patterns like - Inside-outside-inside, Inside- Inside -inside, outside - Inside -outside, etc. Works perfectly with my other free indicators Internal bar and Shadows
Inputs: How many history bars to calculate on l
FREE

Moving Average Convergence Divergence (MACD) combined with Traders Dynamic Index (TDI) Input parameters: signal mode: true if you want to plug it into STAT (Signal Tester and Trader) arrow shift: distance between TDI line to arrow on chart middle band: use middle band (middle bolinger band) signal filter price line: use 50 price line signal filter RSI period RSI price method volatility period moving average RSI period moving average signal period moving average method use MACD indicator fast MAC
FREE

TILLSON MOVING AVERAGE Auch bekannt als TMA- oder T3-Indikator. Es ist ein gleitender Durchschnitt , der EMA und DEMA in seiner Formel verwendet und mit einer Binomialerweiterung 3. Grades berechnet wird . Vorteile; 1- fehlerhaften Signale , die in anderen gleitenden Durchschnitten angetroffen werden ( kontinuierliches Zick zag ) wurde so weit wie möglich reduziert. 2- verhinderte die Verzögerungen , die bei klassischen gleitenden Durchschnitten zu beobachten sind . 3- Sehr erf
FREE

The MACD_stopper_x2 indicator shows where the trend has a tendency to stop or reverse. It uses the standard MACD indicator and a proprietary formula for processing data obtained from MACD. There are 2 types of stop/reversal signals: Small cross - probability of a trend stop/reversal is 70-80%; Large cross - probability of a trend stop/reversal is 80-80%; If there are open trades (for example, BUY) on the symbol the indicator is attached to, and the BUY trend ends, the indicator sends push notifi
FREE
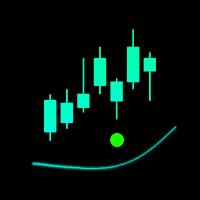
The indicator is designed for fast scalping. The principle of operation of the indicator is based on the direction of the Moving Average.
The period and sensitivity of the Moving Average can be adjusted for yourself in the indicator settings. I recommend watching my advisor - Night Zen EA
Subscribe to my telegram channel, link in my profile contacts. Advantages of the indicator: The free version is full, there are no additional purchases The arrows are not redrawn, the signal comes after
FREE
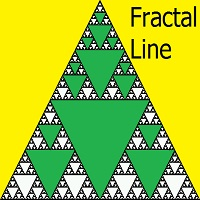
This indicator draws lines based on the standard Fractals indicator. Once a fractal is broken up or down, the indicator generates an alert, sends an email notification and a push message to your mobile phone.
User Inputs History - the number of bars in history for calculation. Color Up Fractal - the color of the upper fractal line. Color Down Fractal - the color of the lower fractal line. Width - the line width. Alerts - alert. EmailAlerts - email notification. NotificationAlert - push notific
FREE

The GTAS BSI is an indicator designed to provide the trend direction and buy/sell signals, using combination of momentum indicators. This indicator was created by Bernard Prats Desclaux, proprietary trader and ex-hedge fund manager, founder of E-Winvest.
Description The BSI indicator is represented as a histogram under the price chart. +100 (green) value indicates a bullish trend. -100 (red) value indicates a bearish trend. When the BSI turns to +100 (green), it gives a potential buy signal. W
FREE
Индикатор Free Pro Level предназначен для автоматического построения уровней поддержки и сопротивления. Преимущества индикатора: подходит как для опытных трейдеров, так и для новичков; простота в использовании; уровни не перерисовываются; вероятность реакции цены при касании уровня более 80%; бесплатный. Индикатор Free Pro Level имеет всего 5 пунктов входных параметров: Минимальная длина свечи в пунктах по 5 знаку - основной параметр, на основании которого происходит анализ и поиск уровней по
FREE

This indicator is designed to detect the best of all candlestick reversal patterns: Three Line Strike . According to the bestselling author and candlestick guru Thomas Bullkowski, this pattern has a winning percentage between 65% and 84% . This FREE Version of the Scanner scans only EURUSD and GBPUSD. The full version of the scanner can be found here: Three Line Strike Scanner 30 Instruments This indicator scans for you up to 30 instruments (forex, indices or commodities) on up to 8 timeframes.
FREE
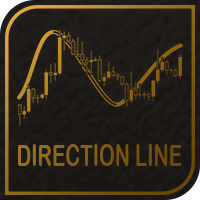
The Direction Line indicator shows you if the current market is in a up trend or uf ut's in a down trend. The sensitivity of the trend calculation ist customizable. You can adjust it till it fit's your strategy. Even as a beginner is this indicator easy to use and you'll see every trend.
Key Features of Direction Line Real-time trend calculations of all time frames Graphical Interface Identical calculation for all time frames Customizable trend sensivity No repainting
Settings / Inputs
Sen
FREE

Wenn Sie dieses Projekt mögen, hinterlassen Sie eine 5-Sterne-Bewertung. Folgen Sie instagram: borelatech Der Handel mit großen Volumina erfordert, dass wir mehrere Instrumente/Charts
betrachten
neue Möglichkeiten zu finden, wird dieser Indikator Ihnen helfen, indem Sie
spezifische
Ebenen durch das Vielfache einer Anzahl oder deren Suffix und aktualisieren sie
automatisch
als sich der Preis ändert, eine Aufgabe, die sonst mühsam wäre. Zum Beispiel, auf GBPUSD, könnten Sie 4 Instanzen de
FREE

!!! In [CodeBase] habe ich den Mql4-Indikatorcode veröffentlicht. Laden Sie den Code kostenlos herunter!!! (Sie müssen den Code beim Update des Terminals anpassen).
Dieser Indikator ist ein Werkzeug für Trader. Es zeigt die Bewegung der Stochastik in allen Perioden und Symbolen: М1, М5, М15, М30, Н1, Н4 jede Minute (die Zeitskala von aktuell bis -240 Minuten, d.h. die letzten 4 Stunden).
Step_Stoch überwindet den Nachteil stochastischer Indikatoren - Lagging. Zum Beispiel kann ein Anstieg
FREE

3 strategies with RSI! Alerts! Signal freshness check! The indicator is based on the classic RSI. I recommend watching my advisor - Night Zen EA It includes 3 strategies: Entry of the RSI indicator into the overbought zone (for buy trades) / oversold (for sell trades) Exit of the RSI indicator from the overbought zone (for sell trades) / oversold (for buy trades) Touching the overbought limit (for sell trades) / oversold (for buy trades) The indicator provides alerts. To enable them in the s
FREE

This scanner shows the trend values of the well known indicator SuperTrend for up to 30 instruments and 8 time frames. You can get alerts via MT4, Email and Push-Notification as soon as the direction of the trend changes. This is the FREE version of the indicator: SuperTrend Scanner The free version works only on EURUSD and GBPUSD!
Important Information How you can maximize the potential of the scanner, please read here: www.mql5.com/en/blogs/post/718074
With the following FREE indicator you
FREE

This indicator is an utility for have always under control, how much time is left at the end of the bar setted.
The utility show on the lower right of the chart, the countdown to the end.
When the remaining seconds is = to the seconds set in the input, the color of remaining seconds on chart, change color and play a warning sound to warn you that the bar is about the end. When the remaining seconds is < to the seconds set in the input, the utility play a beep to warn you that the bar is in
FREE

MP Gradient Adaptive RSI oscillator uses AMA with the basic RSI to cover the retracements with minimum lag. Trigger line crossing the oscillator will provide an entry point for trader.
Settings: RSI period: period of the oscillator Sensitivity of the oscillator: controls the sensitivity of the oscillator to retracements, with higher values minimizing the sensitivity to retracements. RSI applied price: source input of the indicator Number of bars to draw: is used when the Fill Type option is n
FREE
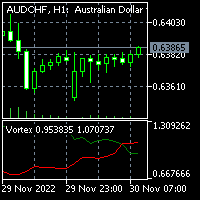
To download MT5 version please click here . - This is vortex indicator. - It is used to detect trend strength and direction. - It consists of two line(buffers). ==> VIM and VIP - There are three types of signals related to this indicator: 1. crossing VIM and VIP 2. threshold on distance between VIP and VIM 3. VIP above VIM vice versa. - This is a non-repaint indicator with light processing.
FREE

Are you tired of having many open charts and watching many different currency pairs? MCTSI will monitor the strengths of 56 currency pairs and show you the best pairs to trade, no more guessing which currency is stronger/weaker, no more trading a pair that is not moving positively. This is the BASIC version. MCTSIP is the more advanced version and can be found here: https://www.mql5.com/en/market/product/20994 You may have many charts open trying to determine the best currency pair to trade on
FREE

TrendFinder VolumeI are Colored candlesticks showing the trend based on Volume and Slope of Trend
This indicator will give you the color change on the next bar on the confirmation candle and will never repaint Lime Green = Possible Buy (Volume up), Teal Green = Bullish Weak (Volume Decreasing), Red = Possible Sell (Volume up) , Orange = Bearish Weak (Volume Decreasing)
TrendFinder Volume is optimize to trade on any market and to be used trending and None trending markets. For best results us
FREE

The indicator based on (Williams` Percent Range) analyzes the signal line touches along the channel walls and forms zones for deciding on the direction of the price movement. For convenience, an alert function is built in. You can also enable and disable the desired zones. Several indicators with different settings can be used on one chart. This will help you choose the best strategy.
FREE

Indotrend is a Smart indicator to detects the Trend and also view support & resistance, multiple timeframe to get validate the trend. it can be use for Forex,Index,Metal,Stock and Crypto. Parameters: Alerts - show popup alert message on Metatrader Hi Lo H1 Timeframe - Show LIne Hi/Low Price base on H1 timeframe Show Fibonaci level - Show Fibonaci retracement level
Show Support Resistance, - Show Support & Resistance H1 timeframe.
FREE
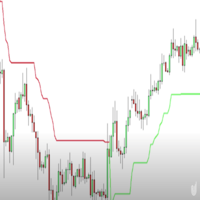
Simple SuperTrend indicator, similar to that of TradingView's.
It has buffers for buy and sell signal, if you want to integrate this into an EA.
It helps traders easily identify trends by providing clear buy and sell signals based on price movements. Designed for simplicity, it’s easy to use and integrates well with various trading strategies, making it a great option for traders of all levels.
Happy trading!
FREE

Moving Average Rainbow Stack: Free: Single Currency & Single Timeframe MA Stack Very useful for finding current and higher timeframe trends. Best suited for long term trend based trading. Use fewer MAs for quick scalping. And not suitable during low volatility. Only use during high volatility and steady trending markets. Use this to enhance your existing Trend based strategies to find best trends.
Read detailed description https://abiroid.com/product/abiroid-ma-stack Available MTF and Scanner
FREE

Lampropeltis is a trend indicator. The algorithm of calculation is based on data from the standard indicators included in the MT4 package and interpretation of patterns formed by these indicators. The settings include a minimum set of parameters: Slow MA - slow MA period; Slow MA method - slow MA smoothing method; Fast MA - fast MA period; Fast MA method - fast MA smoothing method. Change of the signal color to red indicates the possibility of opening a Sell order. Change of the signal color to
FREE

EMA Above Below Bid price Технический индикатор в помощь трейдеру. Данный индикатор, показывает расположение пяти ЕМА,
пяти средних скользящих, относительно цены формирующей японские свечи или бары (цена Bid ).
О понятии ЕМА.
Скользящая средняя (moving average, MA) — это дополнительная линия на графике цены актива.
Внешне она повторяет график цены, но с небольшим запозданием и более гладко, без колебаний. Основные характеристики:
1. Показывает тренды. Если скользящая устрем
FREE
This indicator allows to hide Volume (on all MT4 timeframes) from a date define by the user with a vertical line (Alone) or a panel (with "Hidden Candles"). The color of each bar depends if this one is higher or lower of the previous bar. Indicator Inputs: No inputs for this indicator Information on "Volume" indicator is available in this post: https://www.mql5.com/en/forum/134260 ************************************************************* Hey traders!! Give me your feeds! We are a commun
FREE

Nach 7 Jahren habe ich beschlossen, einige meiner eigenen Indikatoren und EAs kostenlos zu veröffentlichen.
Wenn Sie sie nützlich finden, bitte Zeigen Sie Unterstützung mit einer 5-Sterne-Bewertung! Ihr Feedback hält die kostenlosen Tools am Laufen! Sehen Sie sich auch meine anderen kostenlosen Tools hier an
_________________________________ %B-Indikator für erweiterte Forex-Analyse Der in MQL4 geschickt programmierte %B-Indikator ist ein dynamisches Werkzeug , das darauf abzi
FREE
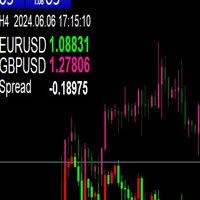
This indicator can be used to add a candle chart of another variety to the chart of the current variety.
1. The chart height will be adjusted automatically
2. If you switch the current icon period, the K of another variety will also switch to the corresponding period
3. In the upper left corner of the chart, the current cycle, the current time, and the current price and spread of the two targets will be displayed.
4. When switching cycle, due to a large number of data retrieval, it wi
FREE

Auto ZZ SR Indicator
This indicator automatically draws trend lines using ZigZag top and bottom points. The more ZigZag tops/bottoms that are used, the greater the number of possible combinations. Therefore, the more possible trend lines can be drawn. And vice versa too. The fewer ZigZag tops/bottoms that are used, the lower the number of possible combinations. And therefore, the fewer the possible trend lines can be drawn. The indicator constantly updates the trend lines on the chart as the ma
FREE

Indicator support for only: Entry Point to Trend Pro Link indicator support : https://www.mql5.com/en/market/product/70867
Supports all currency pairs declared in the definition. Help investors do not need to open many charts. Notice the DEAL: multiple time frames confluence M15, H1, H4.
Entry Point to Trend Pro The indicator helps investors to identify the earliest and perfect reversal point. Easy to make decision to trade with the trend Price action trading. support resistance
FREE
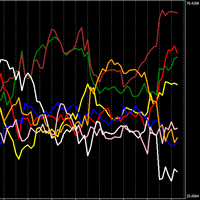
Leistungsstarker Indikator, der die Stärke der einzelnen Währung anzeigt.
Je höher er ist, desto stärker ist die Währung, umgekehrt, je niedriger er ist, desto schwächer ist sie.
Handelsstrategie N1: Eröffnen Sie eine Position bei Linienkreuzungen. Wenn eine Linie nach oben und die andere nach unten kreuzt, eröffnen Sie eine Position bei der Währung, die steigt.
Handelsstrategie N2: Eröffnen Sie eine Position durch den Kauf der stärksten Währung und den Verkauf der schwächsten Währung.
FREE
MetaTrader Market - der einzige Shop, in dem man Handelsroboter als Demoversion herunterladen und testen sowie anhand historischer Daten optimieren kann.
Lesen Sie die Beschreibung und Bewertungen anderer Kunden über das gewünschte Produkt, laden Sie es direkt ins Terminal herunter und erfahren Sie, wie man einen Handelsroboter vor dem Kauf testet. Nur bei uns können Sie ein Programm testen, ohne dafür zu bezahlen.
Sie verpassen Handelsmöglichkeiten:
- Freie Handelsapplikationen
- Über 8.000 Signale zum Kopieren
- Wirtschaftsnachrichten für die Lage an den Finanzmärkte
Registrierung
Einloggen
Wenn Sie kein Benutzerkonto haben, registrieren Sie sich
Erlauben Sie die Verwendung von Cookies, um sich auf der Website MQL5.com anzumelden.
Bitte aktivieren Sie die notwendige Einstellung in Ihrem Browser, da Sie sich sonst nicht einloggen können.