Conheça o Mercado MQL5 no YouTube, assista aos vídeos tutoriais
Como comprar um robô de negociação ou indicador?
Execute seu EA na
hospedagem virtual
hospedagem virtual
Teste indicadores/robôs de negociação antes de comprá-los
Quer ganhar dinheiro no Mercado?
Como apresentar um produto para o consumidor final?
Indicadores Técnicos Grátis para MetaTrader 4 - 5

Full Stochastic - is Stochastic Oscillator which displays all three essential lines: %K Slow K %D Standard Stochastic Oscillators displays only Slow K and %D.
Why it is important to analyze all three lines in SO? Standard SO users must choose if they want to use fast or slow SO. In case of fast SO traders set the slowing parameter typically to 1 or 2, or if they want to use slow SO, they set the slowing parameter usually to 3 or more. With Full Stochastic you can have both!
Full Stochastic P
FREE

CyberZingFx Trend Reversal Indicator - your go-to solution for accurate and reliable trend reversal signals. With its unique trading strategy, the indicator offers you Buy and Sell Arrow signals that do not repaint, making it a reliable tool for catching Swing Highs and Swing Lows.
SCROLL DOWN TO VIEW SCREENSHOTS AND WATCH VIDEO ________________________________________________________________ Trading using CyberZingFx Trend Reversal is Simple Using the CyberZingFx Trend Reversal Indicator is e
FREE

Round Numbers Levels indicator for MT4 Round Numbers indicator is a simple but useful indicator to draw 00 and 50 price levels in your chart.
These levels act as supports and resistances, and therefore should be taken into account when trading.
These levels can be used as profit targets or entry points.
Inputs of the indicator are:
TGridColor00: color to be used for xx00 levels GridStyle00: line style to be used for xx00 levels GridWidth00: line width to be used for xx00 levels GridCol
FREE

This indicator is based on Guppy's GMMA Strategy. And shows arrows when GMMA lines cross up or down. To have this indicator and get alerts for Multiple Timeframes and multiple Pairs you can check out the demo of this GMMA Trend Scanner indicator: https://www.mql5.com/en/market/product/38747
About GMMA In Brief:
GMMA attempts to identify trends by combining two groups of moving averages with differing time periods: The long-term EMAs (30, 35, 40, 45, 50, and 60) the behaviors of investors tha
FREE

Current indicator shows the trading sessions for the major financial centres: London New York Tokyo Sydney There are available two types of displaying zones: in sub window below the chart and on the chart. When the subwindow is selected, the sessions are shown in the form of bars. If the sessions are shown on the main chart, they are displayed in the form of lines at the open price of the session that may also act as a support and resistance for further price action during the trading day. The
FREE

"Capture the sleeping and waking alligator." Detect trend entrance/exit conditions - this indicator can also be tuned according to your trading style. You can adjust a confidence parameter to reduce false positives (but capture less of the trend). This is based on a modification of the Alligator indicator by Bill Williams, an early pioneer of market psychology. 2 main strategies: either the " conservative" approach to more frequently make profitable trades (at a lower profit), or the " high r
FREE

MA Crossover Arrows is a simple indicator that draws arrows and alerts when two moving averages crossover.
Supported types of moving averages Simple Exponential Smoothed Linear Weighted
Supported Price types Close Open High Low Median Price (HL/2) Typical (HLC/3) Weighted Close (HLCC/4) When the fast moving average crosses above the slow moving average, a green up arrow will appear on the chart. When the fast moving average crosses below the slow moving average, a red down arrow will appear
FREE

This indicator is an original view on volumes. It is known that volumes show the amount of buyers and sellers for a certain period of time. A candle is used a period of time. Volumes at a candle High show the buyers. Volumes at a candle Low show the sellers. A candle Open shows the Delta. Delta indicates who was dominant on a given candle, buyers or sellers.
Input parameters Distance - distance of the volumes text from High and Low. Font size - text font size. The indicator provides levels tha
FREE
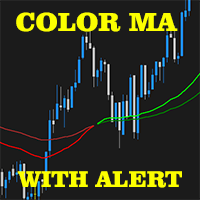
2 EMA Color Alerts Indicator is a powerful tool for any trader looking to stay on top of market movements. By using exponential moving averages (EMAs), this indicator can provide early warning signals for potential market reversals and trend changes. One of the key features of the 2 EMA Color Alerts Indicator is its customizable alerts. With this feature, traders can set their own parameters for receiving alerts, such as the EMA periods and the type of alert (e.g. sound, pop-up, email). This al
FREE

This is the free version of the Supply&Demand + Trendline + Trend tool. This version works only with EURCHF! You find the full version here: https://www.mql5.com/en/market/product/67274
PAAIOS stands for Price Action All In One Solution. And that is the purpose of the Indicator. It should give you a tool to improve your trading decisively because you get the crucial information at a glance. The indicator simplifies the search for strong signals. It shows trend lines, demand and s
FREE

Introduction RSI divergence is a main technique used to determine trend reversing when it’s time to sell or buy because prices are likely to drop or pick in the charts. The RSI Divergence indicator can help you locate the top and bottom of the market. This indicator finds Regular divergence for pullback the market and also finds hidden RSI Divergence to show continuing trend. This indicator shows divergence on the RSI that is a strong hint for an excellent entry point and finds immediately with
FREE

This Indicator was used on EA Advanced Fibo levels . Indicator is designed to trade for most popular Fibonacci strategy that's completely automated. It automatically identifies and show Entry levels included Support/ Resistance Zones , according to the time zone candle by Fibonacci levels. As well as the traditional Fibonacci tool also included. However, it is very user friendly rather than default available one. On the other hand one more tool included. It automatically identifies real Suppo
FREE

Bouncing Bollinger tells the trader when the market is about to reverse using 3 candlestick formations as well as the Directional Movement Index Indicator.
When the previous candle has dipped into the upper or lower Bollinger Band and a candle signal appears along with DMI showing un-volatile a signal occurs showing possible reversal ahead. Features :
A practical way of recognising when a new reversal is about to occur. Choose your favourite signal color. Send alerts to either your PC,
FREE
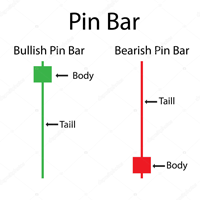
Pin bar pattern is characterized by a long upper or lower wick with a small body relative to the size of the wick with little to no lower or upper shadows. Pin bars are not to be traded in isolation , but need to be considered within the larger context of the chart analysis. A pin bar entry signal, in a trending market, can offer a very high-probability entry and a good risk to reward scenario.
Inputs MinimumTailPips- Minimum size of Tail in pips; TailBodyCandle- means how many times Tail gre
FREE

This indicator analyzes price action patterns and helps you to make positive equity decisions in the binary options market. [ Installation Guide | Update Guide | Troubleshooting | FAQ | All Products ] Easy to trade Trade both call and put options No crystal ball and no predictions The indicator is non-repainting The only strategy suitable for binary options is applying a mathematical approach, like professional gamblers do. It is based on the following principles: Every binary option represents
FREE

ZigZag Fibo Retracement Indicator Optimize Your Trading Strategy! Are you seeking to optimize your trading strategy in the financial markets? Explore the unique features of the ZigZag Fibo Retracement Indicator, a powerful tool designed to help you identify potential support and resistance levels based on the combination of ZigZag patterns and Fibonacci ratios. Integration of ZigZag Patterns and Fibonacci: The ZigZag Fibo Retracement Indicator combines the effectiveness of ZigZag patterns, helpi
FREE

This is an implementation of the well known SuperTrend Indicator. With this indicator you can see exactly the same values which will be alerted by the following SuperTrend Scanners:
SuperTrend Scanner SuperTrend Scanner FREE
Parameters SuperTrendATRPeriod: the period setting for the calculation of the SuperTrend SuperTrendMultiplier: the multiplier setting for the calculation of the SuperTrend
FREE

This indicator finds Three Drives patterns. The Three Drives pattern is a 6-point reversal pattern characterised by a series of higher highs or lower lows that complete at a 127% or 161.8% Fibonacci extension. It signals that the market is exhausted and a reversal can happen. [ Installation Guide | Update Guide | Troubleshooting | FAQ | All Products ] Customizable pattern sizes
Customizable colors and sizes
Customizable breakout periods Customizable 1-2-3 and 0-A-B ratios
It implements visua
FREE

Necessary for traders: tools and indicators Waves automatically calculate indicators, channel trend trading Perfect trend-wave automatic calculation channel calculation , MT4 Perfect trend-wave automatic calculation channel calculation , MT5 Local Trading copying Easy And Fast Copy , MT4 Easy And Fast Copy , MT5 Local Trading copying For DEMO Easy And Fast Copy , MT4 DEMO Easy And Fast Copy , MT5 DEMO "QQ cooperativa: 556024" "Cooperação wechat: 556024" "Cooperative email: 556024@qq.com" Reco
FREE

SPREADEX e' un indicatore per MT4 e MT5 che indica la distanza dell'ASSET dal GP. il GP e' il prezzo del vero valore dell'ASSET sottostante ottenuto per stima. Il GP e' come una calamita, attira il prezzo dell'ASSET con alta probabilita' ed all'interno della stessa giornata di trading. Quindi SPREADEX indica quali sono gli asset piu distanti dal GP al momento in tempo reale. Fornendo un punto di vista al TRADER su quali asset concentrarsi e cercare eventuali segnali di inversione dei prezzi per
FREE

O indicador mostra os níveis redondos no gráfico. Eles também são chamados de níveis psicológicos , bancários ou de jogador principal. Nestes níveis, há uma verdadeira luta entre touros e ursos, o acúmulo de muitas ordens, o que leva ao aumento da volatilidade. O indicador se ajusta automaticamente a qualquer instrumento e período de tempo. Quando o nível 80 é rompido e testado, nós compramos . Quando o nível 20 é rompido e testado, nós vendemos . A meta é 00. Atenção. Dev
FREE
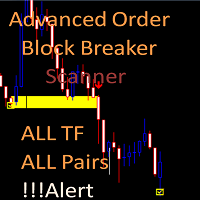
Advanced Order Block Breaker Scanner
This Scanner is free to download but is dependent on you owning the advance order block breaker indicator. Need to purchase the indicator here: https://www.mql5.com/en/market/product/59127
MT5 version: https://www.mql5.com/en/market/product/62769
The Scanner will show you on a single chart all the timeframes (M1 to Monthly) with their own status for the indicator: advance order block breaker Scan all time frame and all symbol: breaker's smart al
FREE

This indicator identifies swing highs and swing lows in the price chart by comparing the Highs and lows of each candle to a specified number of candle before and after it. Once it has identified the swing highs and swing lows, it can use them to determine potential support and resistance levels. A support level is formed when the price drops and bounces back up from a swing low, indicating that there is buying pressure at that level. A resistance level is formed when the price rises and reve
FREE

The market profile indicator provides with an X-Ray vision into market activity, outlining the most important price levels, value area and control value of the daily trading session. [ Installation Guide | Update Guide | Troubleshooting | FAQ | All Products ] Easy to understand and use Understand market dynamics easily Automatic timeframe selection Identify zones of trading value and discard others It is useful in all market conditions Effective for any trading strategy It implements three color
FREE
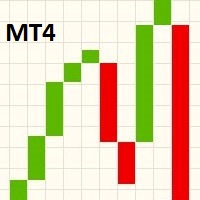
Este indicador mostra um gráfico de Ruptura de Linha no gráfico principal. Para visualizar o gráfico de Ruptura de Linha, você deve alterar o gráfico principal para exibição em linha, em seguida, mudar nas Propriedade (F8), a configuração da cor do "gráfico de linhas" para "None". Em relação a rolagem, zoom +/- ou alterar o par/período do gráfico, o indicador irá redimensionar os blocos na próxima escala para atender a área principal de visualização do gráfico. Gráficos de Ruptura de Linhas foi
FREE

INFOPad é um painel de informações que cria informações sobre o par de moedas selecionado no terminal MetaTrader 4. Existem 5 funções deste indicador: Mostra a informação principal e principal sobre o símbolo selecionado: Pergunte BID, Spread, Stop Nível, Swap, Tick valor, Comissão preços; Mostra os alvos futuros do alvo do SL e do alvo do TP (o número de pontos do stop loss estabelecido e toma o lucro, a quantia em dólar); Mostra o lucro recebido pelos períodos: Hoje, Semana, Mês, Ano, Lucro t
FREE
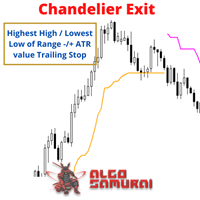
Developed by Chuck LeBeau, the Chandelier Exit indicator uses the highest high / lowest low -/+ a multiple of the ATR value to draw trailing stop lines (orange under buys, magenta over sells) that advance with the trend until the trend changes direction.The value of this trailing stop is that it rapidly moves upward in response to the market action. LeBeau chose the chandelier name because "just as a chandelier hangs down from the ceiling of a room, the chandelier exit hangs down from the high
FREE
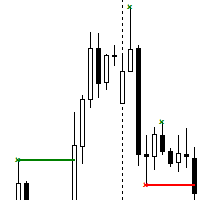
The Contraction/Expansion Breakout Indicator for MetaTrader 4 (MT4) is a powerful tool crafted to identify and signal the breakout of bullish and bearish contraction or expansion formations within financial markets. Utilizing advanced algorithmic calculations, this indicator assists traders in recognizing significant price movements that frequently accompany these formations, providing valuable insights for strategic trading decisions. Key Features: Contraction and Expansion Identification: The
FREE

Heikin Ashi is Japanese for "average bar", and may make it easier for you to identify trends. Our version of this popular indicator adjusts the size of the candles based on the zoom level of your chart, making it appear more naturally just like the traditional candlesticks. The colors are selected based on the color scheme you use on your charts, but can be customized anyway you would like. You may also choose whether to display only the Heikin Ashi candles, or show the other selected chart as w
FREE

The Supertrend draws a line following the current trend.. Green Line under the candle means a likely bullish trend Red Line above the candle means a likely bearish trend
How to trade with SuperTrend indicator Buy when the Supertrend Green line is below the price, Sell when the Supertrend Red line is above the price. It is strongly suggested to use this indicator in a trending market.
Parameters Multiplier - the lower it is and the more sensitive is the line, meaning it will follow the price
FREE
MTF Engulfing Zones is a user-friendly indicator designed for effortlessly spotting engulfing patterns across diverse time frames.
MTF Engulfing Zones indicator was specifically designed to complement an existing strategy discussed on Forex Factory. The indicator is part of a broader strategy, and its functionality is best understood in the context of that strategy. For more details, I recommend visiting this [ link ]
The tool offers the convenience of customizable alarms, allowing you to re
FREE

This Weis Wave Volume indicator is a tool to help traders identify the current price trend. Understanding volume can provide insight into a market's behavior to help you determine its overall health. The most important rule is this: volume precedes price. Typically, before a market price moves, volume comes into play. It has 2 main colors histogram which are green and red. – Green indicates an upward wave. The more the price increases, the bigger the green volume gets. – The red color shows a d
FREE

RoundNumbers indicator is a simple and powerful psychological price levels. Trader usually use these levels as a Support and Resistance (SnR). Indicator Input: Levels - Numbers of levels drawn on chart. Default 30 levels. BoxSize - Box size drawn on each levels, indicate buffers around levels. Default value 1pips (10point) above and below each levels. ZoneSize - Distance between each levels, default value 10pips (100point). Style & Colours - User inputs customization.
For MT5 version, please r
FREE

O indicador Candle_Timer_and_Spread mostra em um gráfico o tempo até o final da vela e a porcentagem de variação do preço junto com o spread para os símbolos selecionados.
O cronômetro para o tempo até o final da vela no período atual e a variação do preço como uma porcentagem em relação ao preço de abertura do dia está localizado por padrão no canto superior direito do gráfico. O painel mostra o spread e a variação percentual do preço atual em relação à abertura do dia para os símbolos selec
FREE

The "FX Holy Grail" indicator is a powerful tool designed to identify significant market trends while also providing shorter-term signals for potential buy or sell opportunities, particularly suited for scalping strategies. In addition to its primary trend identification function, the indicator incorporates shorter-term trend signals tailored for scalping purposes. These signals are designed to pinpoint opportune moments for entering or exiting trades within the context of the trend identified
FREE

Tired of plotting trendlines? The PZ TrendLines indicator applies a mechanical approach to the construction of trend lines for you! [ Installation Guide | Update Guide | Troubleshooting | FAQ | All Products ] It can draw up to 18 trendlines Trendlines can be optionally based on fractals Each line represents a breakout level Each trendline can be broken or rejected Configurable amount of lines Configurable colors
Support I am happy to provide free products but given my limited time, they come
FREE

A professional tool for trading - the divergence indicator between the RSI and the price, which allows you to receive a signal about a trend reversal in a timely manner or catch price pullback movements (depending on the settings). The indicator settings allow you to adjust the strength of the divergence due to the angle of the RSI peaks and the percentage change in price, which makes it possible to fine-tune the signal strength. The indicator code is optimized and is tested very quickly as par
FREE
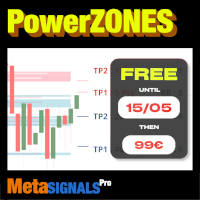
Zona estratégica tocada 3,4 ou 5 vezes que magnetizará o preço >> TP1/TP2/TP3 em pontos ou valor de acordo com as PowerZONES >> Verificar visualmente a segurança do seu rácio Risco/Recompensa Indicador não repintável e não atrasado | deal para trading manual e automatizado | adequado para todos os activos e todas as unidades de tempo Oferta por tiempo limitado >> 50% OFF Após a compra, por favor contacte-me neste canal para obter as definições recomendadas
Características
1. PowerZONES D
FREE

Informative & optimized Zigzag, Accumulated volume, Price change A rewrite of the traditional zigzag tool with new additions. Features:- Optimized code Displays accumulated volume between peaks Displays price change between peaks Usage:- Identify trend swings Identify high volume swings Compare price changes between swings Drawing Fibonacci tool on strong price change or high volume swings
FREE

Gorilla Channel VZ é um indicador de canal, finalizado com base em muitos anos de observações.
O indicador de negociação de Sinais pode ser usado como um indicador que exibe um canal de tendência e como uma das fontes de sinais de entrada, sujeito a filtragem adicional. Com a abordagem adequada, pelo menos 80% de transações bem-sucedidas.
Principais características do Gorilla Channel VZ: Funções analíticas
Pode ser usado em qualquer par de moedas e timeframe; O indicador não é redesenhad
FREE
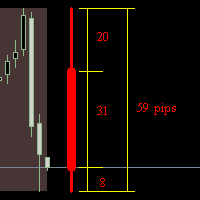
The indicator 'draws' a daily, weekly or monthly candlestick on the current chart. Shows in points the sizes of the upper and lower shadows, the body and the entire candlestick. Real time work. Works in the strategy tester. Indicator parameters: How_much_to_show - how many blocks to show. Block_period - block period (day / week / month) Shift - shift from the edge of the chart in bars. language - language selection.
FREE
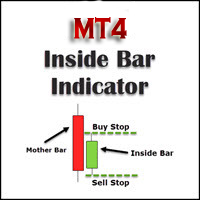
This inside bar indicator MT4 is suitable if you are doing inside bar trading. So what this MT4 inside bar indicator does is identifies inside bars for you as they form on your charts. Inside bar is a famous trading pattern in which the bar carry higher low and lower high compared with the previous bar, also known as mother bar. With, a lesser time frame like the 1 hour chart, daily inside bar chart will sometimes appears to be similar to a triangle pattern.
Inputs AlertOn - enable alerts Ema
FREE

Com este indicador, você sentirá total liberdade, não precisará mais procurar água em uma negociação por horas e adivinhar os níveis de stop loss e take profit. Agora tudo ficou simples. Este sistema é inspirado em duas estratégias populares na época: o Turtle System e o PVRSA. Peguei o melhor dos dois mundos e fiz esse maravilhoso indicador.
Regras de negociação: Uma barra vermelha significa aumento de volume e você precisa procurar uma oportunidade para entrar no mercado Se houver um sinal
FREE

The indicator synchronizes eight types of markings on several charts of one trading instrument.
This indicator is convenient to use in conjunction with "Multichart Dashboard" or other similar assistant that allows you to work with several charts at the same time.
"Multichart Dashboard" can be found under the link on my youtube channel.
Settings:
enable vertical line synchronization
enable horizontal line synchronization
enable Trend Line synchronization
enabling Fibonacci Retracement
FREE

This indicator is a personal implementation of the famous Traders Dynamic Index, which uses RSI, moving averages and volatility bands to find trends, reversals and price exhaustions. However, this particular implementation supports not only RSI, but also CCI, Stoch, AO, AC, Momentum, WPR, Demarker, RVI and ATR. It is suitable for scalping, day trading, and swing trading and aims to provide a full picture of the current market conditions. [ Installation Guide | Update Guide | Troubleshooting | FA
FREE

Are you tired of drawing trendlines every time you're analyzing charts? Or perhaps you would like more consistency in your technical analysis. Then this is for you. This indicator will draw trend lines automatically when dropped on a chart. How it works Works similar to standard deviation channel found on mt4 and mt5. It has 2 parameters: 1. Starting Bar 2. Number of bars for calculation The starting bar is the bar which drawing of the trend lines will begin, while the number of bars for c
FREE

The Supreme HmaSignal indicator is an indicator for trend trading , its main character is the hull moving average colored line , and secondary is buy and sell arrows , arrows are fair but the main focus is on the colored hma , this indicator does not repaint or back paint or delay its signals. if you like this indicator please check my Supreme Trendhisto: here , and my Supreme Diamond indicator : here
Parameters: HMA Period HMA Smoothing HMA Price (close/open) Signal Period (Arrows)
FREE

The indicator displays crossing zero level by Moving Average of Oscillator (OsMA) in the form of arrows. The this is a multi-timeframe indicator, and it displays signals from other timeframes. The indicator notifies about a signal by means of a pop-up Alert window, or sending notification to e-mail.
Parameters Time-frame - select timeframe to show indicator signals. Fast EMA Period - fast EMA. This is an exponential moving average from a price with a short period. Slow EMA Period - slow EMA. T
FREE

DONCHIAN CHANNEL DC É um indicador de tendência desenvolvido pela “Richard Donchian”, composto por 3 camadas, o canal superior, o canal inferior e o canal do meio. Ele é criado no Canal Donchian traçando os preços mais altos e mais baixos alcançados no período passado no gráfico de preços. Também é usado para medir a volatilidade do mercado, pois é um canal de expansão/contração de acordo com o aumento/diminuição da volatilidade dos preços. Method 0; Desenho do indicador do canal Donchian. Sinai
FREE

Goichi Hosada ( founder of Ichimoku ) in his development of Ichimoku, spent 4.5yrs of his study just on number theory. He studied pretty much every Eastern and Western theory under the sun, and eventually settled upon 3 basis numbers that he not only made the basis of Ichimoku theory, but underlined all of reality. NOTE: I have an interesting follow up story to tell about this so remind me to discuss it later. The three numbers he made as the basis for Ichimoku were 9, 17 and 26. So the idea t
FREE
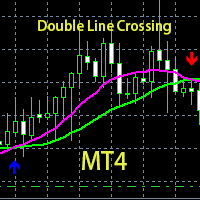
his is a custom indicator based on double-average crossing and arrow marking.
Make multiple lists when blue arrows appear up.
Make a blank list when the red arrow appears down.
When the pink line crosses the green line upwards, the pink line is above, the green line is below, the golden fork appears, and the blue arrow appears.
When the pink line crosses down through the green line, the pink line is below, the green line is above, a dead fork appears, and a red arrow appears.
This is a
FREE
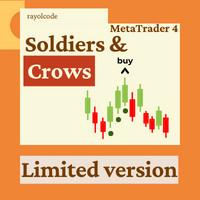
This indicator accurately identifies and informs market reversals and continuation patterns by analyzing and signaling the Three White Soldiers / Three Black Crows pattern. User-friendly interface and multi-asset compatibility Fully customizable parameters and colors Does not repaint Can be easily convert its signals into an Expert Advisor. Full support granted.
FOR MT4 FULL VERSION: CLICK HERE
What is the Three White Soldiers / Three Black Crows price action pattern The Three White Soldi
FREE
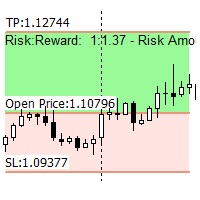
This is a useful tool to plan a trade risk to reward visually. The indicator is very simple to use with minimum settings. Long or Short You can use the indicator for both long and short positions.
Lot Size Calculator You can also use this indicator as a lot size calculator. If you set the risk amount the indicator will calculate the lot size for you based on the stop loss line. You do not need to calculate the lot size manually. Free Version Free versions works fully on EURUSD pair. For oth
FREE

RaysFX StepMA+Stoch Caratteristiche Principali Adattabilità: Il nostro indicatore RaysFX StepMA+Stoch è progettato per adattarsi alle mutevoli condizioni di mercato. Utilizza l’Average True Range (ATR) per misurare la volatilità del mercato e regolare di conseguenza le sue strategie di trading. Precisione: L’indicatore genera segnali di trading quando la linea minima incrocia la linea media. Questi segnali sono rappresentati come frecce sul grafico, fornendo punti di ingresso e di uscita chiar
FREE

Just another plain Super Trend indicator.
On this one i have added another buffer (on index 2) which can be used on EA; the values is -1 to identify a bearish trend while for bullish trend the value is 1.
Here a code snippet:
int trend = ( int ) iCustom ( NULL , Timeframe, "SuperTrend" , Period , Multiplier, 2 , 1 ); It work on every timeframe.
If you need help to integrate it on your EA, don't hesitate to contact me.
FREE

A representação duma vela Heikin Ashi padrão tem um valor de abertura equivalente a uma média móvel exponencial (EMA) do Preço Total , do qual o valor de alfa do EMA é fixo em 0,5 (equivalente a um período EMA de 3,0). Nesta versão dinâmica, o período pode ser alterado para qualquer valor que se queira usar, o que também permite uma análise aproximada de vários períodos de tempo ou o uso dum valor baixo ou alto como uma espécie de stop-loss . O cruzar do preço real de fechamento sobre o valor de
FREE

What is Ikoku Kairi Band?
It is an oscillator indicator that combines Kairi Relative Index with Bollinger Band and displays signals with possible position entry points. It is meant to be used to trade against the trend, so it is perfect for scalping in a range market. It shouldn’t be used in a trend market. It will display arrow signals at possible entry points for buy and sell position. You can be notified when they appear with, push, alert or email notifications. You can customise the indica
FREE

Os níveis matemáticos de Murray são baseados nas observações de Gann e em sua teoria da quadratura dos preços. Segundo Gann, o preço oscila em 1/8 da faixa. Esses 1/8 nos permitem obter diferentes níveis de resistência e suporte para um determinado gráfico, que possuem características próprias. Após um rompimento de -2 ou +2 níveis ou quando a volatilidade diminui, eles são reconstruídos. Você pode escolher o período de exibição (histórico atual ou inteiro). Todas as linhas são desenhadas por m
FREE

Most of the time, market reversals / pull backs usually follow volume and price spikes thus these spikes could be the first indication of an exhaustion and possible reversal/pullback. High volume Turns is an indicator that scans the market for price and volume spikes around over-bought/over-sold market conditions. These spikes when spotted serves as the first indication of reversal/pullback.
Note : Though it seems ok now but this is a system that is still under development. We have made it p
FREE

This is one of the most popular and highly rated volatility index (VIX) indicators on the market. It provides the same readings as the VIX does for stock indexes. However, this indicator works across all asset classes. VIX Fix Finds Market Bottoms. This indicator is not for inexperienced traders. Use it for day and swing trading. MT5 Version - https://www.mql5.com/en/market/product/112284
Bernard Baruch summed it out best: "Markets fluctuate." The Chicago Board Options Exchange (CBOE) Vola
FREE

As you know, the price always moves in a certain channel and when the price goes out of the channel, it always tends to return back to the trading channel The Ind Channel Exit indicator will help you not to miss the price going out of the channel It can show an alert or send a message to the terminal on your smartphone that the next bar has closed above or below the channel levels It has a minimum number of settings and the main parameter is the Channel Multiplier , which determines the width o
FREE

O indicador exibe gráficos minimizados de qualquer símbolo em qualquer período de tempo. O número máximo de gráficos exibidos é 28. Os gráficos podem ser localizados na janela principal e inferior. Dois modos de exibição: velas e barras. A quantidade de dados exibidos (barras e velas) e os tamanhos dos gráficos são ajustáveis. Parâmetros: Corner - exibe o canto inicial (selecionado da lista) CandleMode - modo de exibição: verdadeiro - velas, falso - barras ShowLastBid - ativa / desativa a última
FREE

O indicador de tendência AI é um indicador comercial inovador criado usando tecnologias avançadas de rede neural para determinar com precisão a direção da tendência nos mercados financeiros. Este indicador fornece aos traders uma ferramenta de tomada de decisão intuitiva e informativa, baseada em uma análise aprofundada da dinâmica dos preços.
Características principais:
Rede Neural para Previsão de Tendências: O indicador de tendências de IA usa uma poderosa rede neural treinada em uma gra
FREE
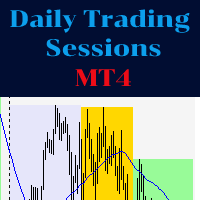
The indicator represents the session boxes for the Asian, European and American sessions. It is possible to change the time of each session, such as color. It is also possible to disable the display of each session. You will find in input parameters variables to modify time sessions in format hh:mm and the color of boxes of each sessions. If you need some implementations please contact me.
FREE

This trend scanner indicator is using two main indicators to identify trends. Frist the EMAs to provide a view on Bullish / Bearish momentum. When the shorter EMA (calculated off more recent price action) crosses, or is above, the slower moving EMA (calculated off a longer period of price action), it suggests that the market is in an uptrend. Second the Stochastic RSI, When RSI is < 20 it is considered oversold, and when > 80 it is overbought. These conditions suggests that momentum is very str
FREE

This indicator will detect harmonic patterns that are drawn on the chart by manual and automatic methods. You can see user manual from this link: https://www.mql5.com/en/blogs/post/719257 There is a free version (it detect only Gartley and Nenstar Patterns) to try this product. You can buy the full MT4 version from: https://www.mql5.com/en/market/product/104689
Notes When you use this indicator and change the settings, add indicators like Moving Average or Bollinger Bands, this indicator will
FREE

Introducing ICT Reaction Levels, a reliable indicator designed to plot key levels on your chart. Unlike classical support and resistance, these levels are derived from significant highs and lows observed on higher timeframes, such as the weekly and monthly periods. The indicator provides a valuable tool for traders seeking to identify critical price levels based on historical price reactions.
ICT Reaction Levels analyzes price action on the specified timeframe, using special inputs to determi
FREE

MP Candle Countdown indicator with a progress bar is a tool used in technical analysis that displays the time remaining until the current candlestick on a chart closes, along with a progress bar that shows visually the amount of time that has elapsed since the candlestick opened. This indicator can be helpful for traders who use candlestick charting to make trading decisions, as it provides both a visual representation of the time left until a candlestick closes and an indication of how much ti
FREE
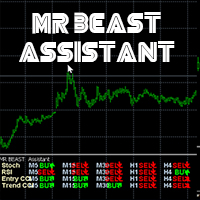
MRBEAST Assistant El indicador MR BEAST Assistant para MetaTrader es un indicador multitemporal que se basa en tres indicadores estándar: el oscilador estocástico, el RSI (Índice de Fuerza Relativa) y el CCI (Commodity Channel Index). Muestra las direcciones de la tendencia actual para los marcos temporales M1, M5, M15, M30, H1, H4, D1, W1 y MN1. Cuando se sigue un indicador de este tipo se tiene una visión clara de las tendencias en todos los marcos temporales importantes. No imp
FREE

Flow Trend BLACK FRIDAY: 50% DISCONT > OLD PRICE 100$ > NOW 50$
Flow trend is designed to detect the market trend with special calculation and a combination of Bolinger band and statistical moving period
to detect the market trend without frequency change and fault.
This indicator is designed with simple parameters to use fast and easy and helpful tools to trade in a pure direction and set your SL/TP with this indicator cloud system.
FREE
Saiba como comprar um robô de negociação na AppStore do MetaTrader, a loja de aplicativos para a plataforma MetaTrader.
O Sistema de Pagamento MQL5.community permite transações através WebMoney, PayPay, ePayments e sistemas de pagamento populares. Nós recomendamos que você teste o robô de negociação antes de comprá-lo para uma melhor experiência como cliente.
Você está perdendo oportunidades de negociação:
- Aplicativos de negociação gratuitos
- 8 000+ sinais para cópia
- Notícias econômicas para análise dos mercados financeiros
Registro
Login
Se você não tem uma conta, por favor registre-se
Para login e uso do site MQL5.com, você deve ativar o uso de cookies.
Ative esta opção no seu navegador, caso contrário você não poderá fazer login.