Regardez les tutoriels vidéo de Market sur YouTube
Comment acheter un robot de trading ou un indicateur
Exécutez votre EA sur
hébergement virtuel
hébergement virtuel
Test un indicateur/robot de trading avant d'acheter
Vous voulez gagner de l'argent sur Market ?
Comment présenter un produit pour qu'il se vende bien
Indicateurs techniques gratuits pour MetaTrader 4 - 5

The indicator analyzes the price structure of fractals and identifies possible reversal points of market dynamics. Perfect when used in combination with other types of indicators.
Advantages:
Works on all instruments and timeseries, Doesn't redraw its results, Customizable colors of indicator elements, Works well with any trending strategy, Adjusting the strength of fractals.
MT5 version -> HERE / Our news -> HERE
Strategy:
AW Flexible Fractals is an indicator that indicates si
FREE

FALCON ZONES , OPORTUNIDADES EN EL MERCADO PARA COMPORAR O VENDER
Características Destacadas: Identificación de Patrones de Velas: Reconoce una amplia gama de patrones de velas, desde patrones simples hasta formaciones más complejas. Proporciona una visión completa de la psicología del mercado encapsulada en las velas. Alertas Personalizadas: Configura alertas a medida para los patrones de velas que más te interesan o que se alinean con tu estrategia. Recibe notificaciones instantáneas cuando
FREE

The Pivot Indicator is a vital tool for technical analysis used by traders in the financial markets. Designed to assist in identifying potential reversal points or trend changes, this indicator provides valuable insights into key levels in the market. Key features of the Pivot Indicator include: Automatic Calculations: The Pivot Indicator automatically calculates Pivot Point, Support, and Resistance levels based on the previous period's high, low, and close prices. This eliminates the complexity
FREE
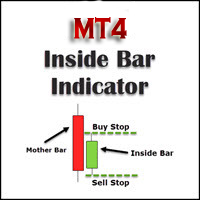
This inside bar indicator MT4 is suitable if you are doing inside bar trading. So what this MT4 inside bar indicator does is identifies inside bars for you as they form on your charts. Inside bar is a famous trading pattern in which the bar carry higher low and lower high compared with the previous bar, also known as mother bar. With, a lesser time frame like the 1 hour chart, daily inside bar chart will sometimes appears to be similar to a triangle pattern.
Inputs AlertOn - enable alerts Ema
FREE

This indicator calculates buy and sell signals by using MACD indicator on two timeframes. MACD is a trend-following showing the relationship between two moving averages of the closing price. The MACD is calculated by subtracting the 26-period Exponential Moving Average (EMA) from the 12-period EMA.The result of that calculation is the MACD line. A nine-day EMA of the MACD called the "signal line".
This indicator has 2 modes to calculate the buy/sell signals: - MACD crosses 0 line - MACD cro
FREE

The Trade by levels indicator is designed to automatically determine the formation of a model for entering the market on the chart of the selected instrument.
Definitions: ⦁ BFl is the bar that formed the level. ⦁ BCL1 and BCL2 bars, confirming the level.
The graphical model: ⦁ levels high\low the bars BFL and BCL1 must match the accuracy to the point ⦁ there can be any number of bars between BFL and BCL1. ⦁ between BCL1 and BCL2 intermediate ba
FREE

Ce conseiller expert ne fait aucune transaction, mais il scanne l'ensemble des symboles de votre surveillance du marché et scanne chaque action une par une dans des délais différents et à la fin, il vous montre quel symbole dans quel délai a une puissante bougie engloutissante.
De plus, vous pouvez définir une période MA et une limite RSI haute et basse, et il vous montre quels symboles dans quel délai vont franchir la moyenne mobile ajustée, et quel symbole dans quel délai va franchir la lim
FREE

This indicator is a simple trend line indicator.
The upper trend line is the highest price of 60 past candlesticks, the highest price of 30 past candlesticks,
The bottom line is the trend line that connects the lowest price of 60 past candlesticks and the lowest price of 30 past candlesticks.
*The color of the trend line is white.
Notes
This indicator is created with the above configuration, so if the highest and lowest prices of the past 60 candlesticks and 30 candlesticks are the s
FREE
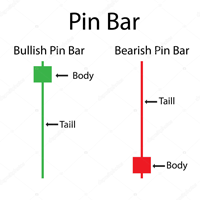
Pin bar pattern is characterized by a long upper or lower wick with a small body relative to the size of the wick with little to no lower or upper shadows. Pin bars are not to be traded in isolation , but need to be considered within the larger context of the chart analysis. A pin bar entry signal, in a trending market, can offer a very high-probability entry and a good risk to reward scenario.
Inputs MinimumTailPips- Minimum size of Tail in pips; TailBodyCandle- means how many times Tail gre
FREE
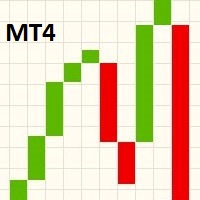
This indicator displays a Line Break chart in the main chart window. To view the line break chart on its own, change the main chart window to display a Line Chart and then change the "Line chart" color to "None" in the F8 properties dialog. When scrolling, zooming in/out or changing the chart pair/timeframe, the indicator will resize the blocks on the next tick to fit the main chart viewing area. Line Break charts were invented in Japan and are similar to Point & Figure and Renko charts. A Japan
FREE

Heikin Ashi is Japanese for "average bar", and may make it easier for you to identify trends. Our version of this popular indicator adjusts the size of the candles based on the zoom level of your chart, making it appear more naturally just like the traditional candlesticks. The colors are selected based on the color scheme you use on your charts, but can be customized anyway you would like. You may also choose whether to display only the Heikin Ashi candles, or show the other selected chart as w
FREE

Notre indicateur fournira un filtre de propagation pour surveiller la propagation de plusieurs paires simultanément et également un compte à rebours de la minuterie de bougie affiche le temps restant avant la fermeture de la barre actuelle et la formation d'une nouvelle barre.
OFFRE À DURÉE LIMITÉE : Tous nos indicateurs premium sont disponibles pour seulement 50$, en accédant à notre blog MQL5 vous trouverez tous les détails de nos indicateurs premium. Cliquez ici.
Principales caractéristi
FREE
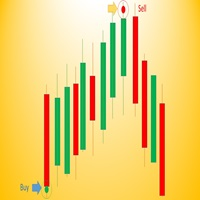
Wave Entry Alerts In Gold is a custom indicator developed by Azad Gorgis for MetaTrader 4. This indicator is designed to provide alerts based on ZigZag patterns, specifically tailored for trading on the Gold (XAU/USD) symbol.
Key Features: - Chart Window Indicator: The indicator is designed to be displayed on the main chart window. - Arrow Signals: The indicator generates arrow signals on the chart, indicating potential reversal points based on ZigZag patterns. - Customizable Parameters: Trad
FREE

Necessary for traders: tools and indicators Waves automatically calculate indicators, channel trend trading Perfect trend-wave automatic calculation channel calculation , MT4 Perfect trend-wave automatic calculation channel calculation , MT5 Local Trading copying Easy And Fast Copy , MT4 Easy And Fast Copy , MT5 Local Trading copying For DEMO Easy And Fast Copy , MT4 DEMO Easy And Fast Copy , MT5 DEMO "Cooperative QQ:556024" "Cooperation wechat:556024" "Cooperative email:556024@qq.com" Strong
FREE

Full Stochastic - is Stochastic Oscillator which displays all three essential lines: %K Slow K %D Standard Stochastic Oscillators displays only Slow K and %D.
Why it is important to analyze all three lines in SO? Standard SO users must choose if they want to use fast or slow SO. In case of fast SO traders set the slowing parameter typically to 1 or 2, or if they want to use slow SO, they set the slowing parameter usually to 3 or more. With Full Stochastic you can have both!
Full Stochastic P
FREE

This comprehensive technical indicator calculates and plots up to 3 moving averages with 3 different periods. By employing three moving averages of distinct lookback periods, the trader can confirm whether the market has indeed experienced a change in trend or whether it is merely pausing momentarily before resuming its prior state. SX Golden MA Pack for MT5 is available here . The shorter the moving average period, the more closely it tracks the price curve. When a security initiates an upt
FREE

The Supertrend draws a line following the current trend.. Green Line under the candle means a likely bullish trend Red Line above the candle means a likely bearish trend
How to trade with SuperTrend indicator Buy when the Supertrend Green line is below the price, Sell when the Supertrend Red line is above the price. It is strongly suggested to use this indicator in a trending market.
Parameters Multiplier - the lower it is and the more sensitive is the line, meaning it will follow the price
FREE
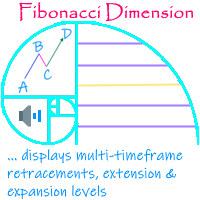
'Fibonacci Dimension' indicator allows display of preset or user-defined multi-timeframe Fibonacci levels. It automatically takes the previous high and low for two user-defined timeframes and calculates their Fibonacci retracement levels. It also considers the retraced level to draw the expansions on every change of price. A complete visual dimension in multiple timeframes allows deriving profitable strategies for execution. The functionalities included are: Provides an option to consider a pres
FREE

This indicator will detect harmonic patterns that are drawn on the chart by manual and automatic methods. You can see user manual from this link: https://www.mql5.com/en/blogs/post/719257 There is a free version (it detect only Gartley and Nenstar Patterns) to try this product. You can buy the full MT4 version from: https://www.mql5.com/en/market/product/104689
Notes When you use this indicator and change the settings, add indicators like Moving Average or Bollinger Bands, this indicator will
FREE

BIG CANDLE ALERT https://www.mql5.com/en/users/earobotkk/seller#products P/S: If you like this indicator, please rate it with 5 stars in the review section, this will increase its popularity so that other users will be benefited from using it. This indicator draws a bullish and bearish vertical line inside a candle whenever the size of a candle body exceeds the minimum size specified in the input. INPUT Bullish Candle Color: choose the color of your choice. Bearish Candle Color: choose the co
FREE

This indicators automatically draws the support and resistances levels (key levels) for you once you've dropped it on a chart. It reduces the hustle of drawing and redrawing these levels every time you analyse prices on a chart. With it, all you have to do is drop it on a chart, adjust the settings to your liking and let the indicator do the rest.
But wait, it gets better; the indicator is absolutely free! For more information: https://youtu.be/rTxbPOBu3nY For more free stuff visit: https
FREE

CyberZingFx Trend Reversal Indicator - your go-to solution for accurate and reliable trend reversal signals. With its unique trading strategy, the indicator offers you Buy and Sell Arrow signals that do not repaint, making it a reliable tool for catching Swing Highs and Swing Lows.
SCROLL DOWN TO VIEW SCREENSHOTS AND WATCH VIDEO ________________________________________________________________ Trading using CyberZingFx Trend Reversal is Simple Using the CyberZingFx Trend Reversal Indicator is e
FREE

Note: This is an Arrows Only Indicator. Get paid scanner or free TDI extra indicators here: https://abiroid.com/product/tdi-sharkfin-arrows-and-scanner/
About:
This is a TDI Arrow Indicator for finding the Shark Fin Pattern. It will show an arrow in the current bar if RSI sharkfin is finished forming in previous bar.
What is Shark Fin TDI Pattern?
Upper Shark Fin: In TDI Indicator when Green RSI breaks above a certain level and also breaks upper Volatility band and then breaks below that
FREE

MA Crossover Arrows is a simple indicator that draws arrows and alerts when two moving averages crossover.
Supported types of moving averages Simple Exponential Smoothed Linear Weighted
Supported Price types Close Open High Low Median Price (HL/2) Typical (HLC/3) Weighted Close (HLCC/4) When the fast moving average crosses above the slow moving average, a green up arrow will appear on the chart. When the fast moving average crosses below the slow moving average, a red down arrow will appear
FREE

Have you ever wanted to be able to catch a trend just as it is beginning? This indicator attempts to find the tops and bottoms of a trend. It uses in-built indicators and studies their reversal patterns. It cannot be used on its own it requires Stochastic(14) to confirm signal. Red for sell, Blue for buy. There are no parameters required just attach to a chart and it is ready to go. Check out other great products from https://www.mql5.com/en/users/augustinekamatu/seller A Winning Trading Stra
FREE

Introducing ICT Reaction Levels, a reliable indicator designed to plot key levels on your chart. Unlike classical support and resistance, these levels are derived from significant highs and lows observed on higher timeframes, such as the weekly and monthly periods. The indicator provides a valuable tool for traders seeking to identify critical price levels based on historical price reactions.
ICT Reaction Levels analyzes price action on the specified timeframe, using special inputs to determi
FREE

L'indicateur Candle_Timer_and_Spread affiche sur un graphique le temps jusqu'à la fin de la bougie et le pourcentage de variation de prix ainsi que le spread pour les symboles sélectionnés.
Le minuteur pour le temps jusqu'à la fin de la bougie sur la période actuelle et la variation du prix en pourcentage par rapport au prix d'ouverture du jour est situé par défaut dans le coin supérieur droit du graphique. Le panneau affiche l'écart et la variation en pourcentage du prix actuel par rapport à
FREE
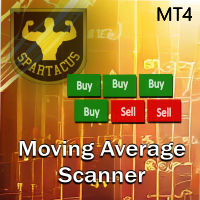
Moving Average Scanner est un scanner multi-timeframe parfait pour voir en un coup d'oeil la tendance sur plusieurs unité de temps sans changer de graphique. Il peut utiliser jusqu’à 4 moyennes mobiles de votre choix sur 9 unité de temps. Il est entièrement paramétrable et peux être déplacer n'importe où sur le graphique par simple "glisser déposer". Les moyennes mobiles sont paramétrables en 4 méthodes de calcul différentes. Vous pouvez également définir des alertes en fonction du nombres de m
FREE

VWAP and Moving Average A combination of Supertrend and Moving Average to create a converging trade setup Input parameters: signal mode: set it to true if you want to plug it into STAT (Signal Tester and Trader) arrow shift: distance between fast EMA line to arrow on chart turn on moving average signal for converging setup VWAP period MA period MA averaging method MA pricing method upper level limit ( VWAP ) lower level limit ( VWAP ) You can find the best setting for 4 hour EURUSD on this v
FREE
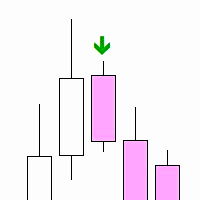
"Inside Bar PA" is a technical indicator designed to determine the inner bars on the chart. An internal bar is a bar or candle, the maximum and minimum of which are completely contained in the previous bar. This may signal a potential reversal or continuation of the trend, depending on the context.
Features: Automatic detection of internal bars. Visual marking of internal bars with arrows on the chart. The ability to adjust the distance of the mark from the bar. How to use: Attach the indicat
FREE

As you know, the price always moves in a certain channel and when the price goes out of the channel, it always tends to return back to the trading channel The Ind Channel Exit indicator will help you not to miss the price going out of the channel It can show an alert or send a message to the terminal on your smartphone that the next bar has closed above or below the channel levels It has a minimum number of settings and the main parameter is the Channel Multiplier , which determines the width o
FREE
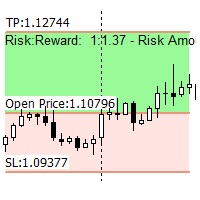
This is a useful tool to plan a trade risk to reward visually. The indicator is very simple to use with minimum settings. Long or Short You can use the indicator for both long and short positions.
Lot Size Calculator You can also use this indicator as a lot size calculator. If you set the risk amount the indicator will calculate the lot size for you based on the stop loss line. You do not need to calculate the lot size manually. Free Version Free versions works fully on EURUSD pair. For oth
FREE

This indicator analyzes price action patterns and helps you to make positive equity decisions in the binary options market. [ Installation Guide | Update Guide | Troubleshooting | FAQ | All Products ] Easy to trade Trade both call and put options No crystal ball and no predictions The indicator is non-repainting The only strategy suitable for binary options is applying a mathematical approach, like professional gamblers do. It is based on the following principles: Every binary option represents
FREE

Session Killzone Indicator
Indicator that helps you to identify the killzone times of both London and NewYork sessions which usually is the most times for high volatility and taking liquidity from the market. Killzone times are configurable through indicator parameters. The indicator adjusts the range of the killzones based on the daily trading range.
FREE

Update: For those who want to manually backtest this indicator, check this tool https://www.mql5.com/en/market/product/59248
The indicator will help make your calculation of stop loss easier as it will be visually aiding you in choosing where to put your stoploss level on the chart by calculating the current value of ATR indicator. For those who are unfamiliar with ATR, it is a useful indicator to calculate stoploss for trend following strategy. If volatility is high, ATR stoploss level will b
FREE

Introduction RSI divergence is a main technique used to determine trend reversing when it’s time to sell or buy because prices are likely to drop or pick in the charts. The RSI Divergence indicator can help you locate the top and bottom of the market. This indicator finds Regular divergence for pullback the market and also finds hidden RSI Divergence to show continuing trend. This indicator shows divergence on the RSI that is a strong hint for an excellent entry point and finds immediately with
FREE

The market profile indicator provides with an X-Ray vision into market activity, outlining the most important price levels, value area and control value of the daily trading session. [ Installation Guide | Update Guide | Troubleshooting | FAQ | All Products ] Easy to understand and use Understand market dynamics easily Automatic timeframe selection Identify zones of trading value and discard others It is useful in all market conditions Effective for any trading strategy It implements three color
FREE
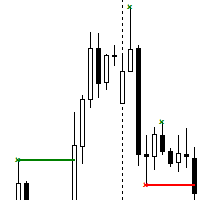
The Contraction/Expansion Breakout Indicator for MetaTrader 4 (MT4) is a powerful tool crafted to identify and signal the breakout of bullish and bearish contraction or expansion formations within financial markets. Utilizing advanced algorithmic calculations, this indicator assists traders in recognizing significant price movements that frequently accompany these formations, providing valuable insights for strategic trading decisions. Key Features: Contraction and Expansion Identification: The
FREE

The " Countdown Candle Timer " indicator is a visual tool for the MetaTrader 4 platform that displays an accurate countdown of the time remaining until the next candle on the chart. It provides real-time information about the remaining duration of the current candle, allowing traders to track time precisely and optimize their trading decision-making. The indicator can be customized in terms of color, font size, and position on the chart, providing flexibility and convenience to the user. You can
FREE

Niveaux institutionnels / Niveaux bancaires ... Niveaux psychologiques / Théorie des quartiers.
Cet indicateur dessinera automatiquement aux niveaux "000, 200, 500 et 800", ce que je connais sous le nom de "niveaux institutionnels", OU, peut également dessiner les niveaux "000, 250, 500 et 750", sur le graphique.
Selon l'endroit où vous avez appris la théorie du trading au niveau institutionnel / des trimestres, vous les connaissez peut-être sous des noms différents. L'idée de base est ess
FREE

L'Average True Range ( ATR ) est une mesure de la volatilité du marché sur un certain nombre de jours. Il ne faut pas s'attendre à un mouvement de continuation important lorsque le prix a atteint la fin de la fourchette. On considère alors que le marché est à court de carburant. Si le cours n'a pas atteint la limite, il dispose encore d'une marge de mouvement. La formule de l'indicateur vous permet de calculer les niveaux High-Low à la fois globalement et individuellement. Vous pouvez également
FREE

Cet indicateur est une méthode d'analyse de marché basée sur l'article "Formule mathématique pour les prédictions de marché" écrit par W.D. Gann en fonction du carré de neuf et du carré de 144 méthodes.
Manuel de l'Utilisateur: Add Your review And contact us to get it
Vous pouvez acheter la version complète MT5 à partir de :
https://www.mql5.com/en/market/product/28669
Vous pouvez tester gratuitement sur MT4 :
https://www.mql5.com/en/market/product/15316
Ce produit peut dess
FREE

A professional tool for trading - the divergence indicator between the RSI and the price, which allows you to receive a signal about a trend reversal in a timely manner or catch price pullback movements (depending on the settings). The indicator settings allow you to adjust the strength of the divergence due to the angle of the RSI peaks and the percentage change in price, which makes it possible to fine-tune the signal strength. The indicator code is optimized and is tested very quickly as par
FREE

Three Bar Break is based on one of Linda Bradford Raschke's trading methods that I have noticed is good at spotting potential future price volatility. It looks for when the 1st bar's High is less than the 3rd bar's High as well as the 1st bar's Low to be higher than the 3rd bar's Low. This then predicts the market might breakout to new levels within 2-3 of the next coming bars. It should be used mainly on the daily chart to help spot potential moves in the coming days. Features :
A simple meth
FREE

This Indicator was used on EA Advanced Fibo levels . Indicator is designed to trade for most popular Fibonacci strategy that's completely automated. It automatically identifies and show Entry levels included Support/ Resistance Zones , according to the time zone candle by Fibonacci levels. As well as the traditional Fibonacci tool also included. However, it is very user friendly rather than default available one. On the other hand one more tool included. It automatically identifies real Suppo
FREE

This indicator represents a genuine momentum oscillator according to the true definition of "Momentum", and as realised by the techniques of digital filtering. ( Note : download a complete set of true momentum oscillators here ). A scholarly paper on the subject by the current developer can be found here , but in this description we shall borrow only the minimum of conceptual and mathematical framework needed. In the process, we expose some long-held myths about indicators supposedly measurin
FREE

Introducing the Consecutive Green/Red Candle Alert Indicator for MT4 - Your Trend Spotting Companion! Are you ready to take your trading to the next level? We present the Consecutive Green/Red Candle Alert Indicator, a powerful tool designed to help you spot trends and potential reversals with ease. Whether you're a new trader looking for clarity in the market or an experienced pro seeking additional confirmation, this indicator is your trusted companion. Key Features of the Consecutive Green/Re
FREE

En avez-vous assez de perdre du temps à essayer de calculer la valeur totale de vos lignes TP et SL sur les graphiques Metatrader ? Ne cherchez plus, nous avons la solution qu'il vous faut. Nous vous présentons notre indicateur gratuit MT4 qui vous permet de suivre facilement le total SL et TP de vos positions sur n'importe quel coin de votre écran. Avec des paramètres X-Y personnalisables et des options de couleurs, vous pouvez personnaliser votre écran pour qu'il corresponde à votre style de t
FREE

SPREADEX e' un indicatore per MT4 e MT5 che indica la distanza dell'ASSET dal GP. il GP e' il prezzo del vero valore dell'ASSET sottostante ottenuto per stima. Il GP e' come una calamita, attira il prezzo dell'ASSET con alta probabilita' ed all'interno della stessa giornata di trading. Quindi SPREADEX indica quali sono gli asset piu distanti dal GP al momento in tempo reale. Fornendo un punto di vista al TRADER su quali asset concentrarsi e cercare eventuali segnali di inversione dei prezzi per
FREE

Recommended on M15 and higher timeframes
Sends alerts and notifications when the zone is create
Sends alerts and notifications if zones are retested
You will see the trading zones and identify the most profitable points to open positions. The indicator marks the supply and demand zones.
With this show you will now make profitable trades that will set the trends.
Shows all support and resistance zones.
Can work in all time zones.
No need to mess with complicated settings, all setti
FREE

The Chart Overlay indicator displays the price action of several instruments on the same chart allowing you to evaluate how differently currency pairs fluctuate relative to each other. [ Installation Guide | Update Guide | Troubleshooting | FAQ | All Products ]
Find overbought or oversold currency pairs easily Plot up to six currency pairs overlayed on the same chart Display inverted symbols if necessary Adapt to chart size, zoom and timeframe Automatic price level calculation Customizable p
FREE

L'indicateur affiche des graphiques minimisés de n'importe quel symbole de n'importe quelle période. Le nombre maximum de graphiques affichés est de 28. Les graphiques peuvent être situés à la fois dans la fenêtre principale et dans la fenêtre inférieure. Deux modes d'affichage : bougies et barres. La quantité de données affichées (barres et bougies) et la taille des graphiques sont réglables. Paramètres: Corner - afficher le coin de départ (sélectionné dans la liste) CandleMode - mode d'afficha
FREE

Round Numbers Levels indicator for MT4 Round Numbers indicator is a simple but useful indicator to draw 00 and 50 price levels in your chart.
These levels act as supports and resistances, and therefore should be taken into account when trading.
These levels can be used as profit targets or entry points.
Inputs of the indicator are:
TGridColor00: color to be used for xx00 levels GridStyle00: line style to be used for xx00 levels GridWidth00: line width to be used for xx00 levels GridCol
FREE
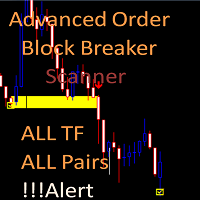
Advanced Order Block Breaker Scanner
This Scanner is free to download but is dependent on you owning the advance order block breaker indicator. Need to purchase the indicator here: https://www.mql5.com/en/market/product/59127
MT5 version: https://www.mql5.com/en/market/product/62769
The Scanner will show you on a single chart all the timeframes (M1 to Monthly) with their own status for the indicator: advance order block breaker Scan all time frame and all symbol: breaker's smart al
FREE
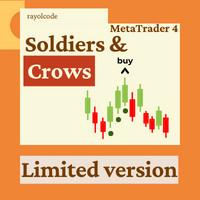
This indicator accurately identifies and informs market reversals and continuation patterns by analyzing and signaling the Three White Soldiers / Three Black Crows pattern. User-friendly interface and multi-asset compatibility Fully customizable parameters and colors Does not repaint Can be easily convert its signals into an Expert Advisor. Full support granted.
FOR MT4 FULL VERSION: CLICK HERE
What is the Three White Soldiers / Three Black Crows price action pattern The Three White Soldi
FREE

Two Period RSI compares long-term and short-term RSI lines, and plots a fill between them for improved visualization. Fill is colored differently according to an uptrend (short period RSI above long period RSI) or a downtrend (short period RSI below long period RSI). Short-term RSI crossing long-term RSI adds a more robust trend confirmation signal than using single period RSI alone. This is a small tool to help visualize and confirm RSI trends. We hope you enjoy! Looking for RSI alerts? You can
FREE

This indicator displays buy or sell signals according to Bill Williams' definition of the Trading Zone. [ Installation Guide | Update Guide | Troubleshooting | FAQ | All Products ] Easy to use and understand Avoid trading flat markets Deterministic indicator with clear rules The indicator is non-repainting It implements alerts of all kinds It has straightforward trading implications. A blue arrow is a buy signal A red arrow is a sell signal According to Bill Williams trading in the zone helps to
FREE

**Product Description: Awesome Supply Demand**
**Overview:** Awesome Supply Demand is a specialized software platform designed to assist traders and market analysts in identifying supply and demand zones in the financial markets. With its advanced features, the platform enables users to observe Fail to Return (FTR) and Flag Limit (FL) patterns efficiently, facilitating more accurate and data-driven decision-making.
**Key Features:**
1. **Supply and Demand Zone Identification:** The pla
FREE
The MACD 2 Line Indicator is a powerful, upgraded version of the classic Moving Average Convergence Divergence (MACD) indicator.
This tool is the embodiment of versatility and functionality, capable of delivering comprehensive market insights to both beginner and advanced traders. The MACD 2 Line Indicator for MQL4 offers a dynamic perspective of market momentum and direction, through clear, visually compelling charts and real-time analysis.
Metatrader5 Version | All Products | Contac
FREE

The most Flexible & Reliable Trend-Based Fibonacci indicator by Safe Trading. This indicator helps you calculate Trend-Based Fibonacci levels base on the main and retracement trends to predict future price . If you just looking for a simple Fibonacci Retracement indicator, please use this Free indicator .
### FEATURES ### Auto-calculate up to 7 Trend-Based Fibonacci levels on adjustable frame. Adjust Fibonacci levels as your need. Adjust the start and the end of calculated frame in indicato
FREE

This indicator is an original view on volumes. It is known that volumes show the amount of buyers and sellers for a certain period of time. A candle is used a period of time. Volumes at a candle High show the buyers. Volumes at a candle Low show the sellers. A candle Open shows the Delta. Delta indicates who was dominant on a given candle, buyers or sellers.
Input parameters Distance - distance of the volumes text from High and Low. Font size - text font size. The indicator provides levels tha
FREE

Bouncing Bollinger tells the trader when the market is about to reverse using 3 candlestick formations as well as the Directional Movement Index Indicator.
When the previous candle has dipped into the upper or lower Bollinger Band and a candle signal appears along with DMI showing un-volatile a signal occurs showing possible reversal ahead. Features :
A practical way of recognising when a new reversal is about to occur. Choose your favourite signal color. Send alerts to either your PC,
FREE

The Supreme HmaSignal indicator is an indicator for trend trading , its main character is the hull moving average colored line , and secondary is buy and sell arrows , arrows are fair but the main focus is on the colored hma , this indicator does not repaint or back paint or delay its signals. if you like this indicator please check my Supreme Trendhisto: here , and my Supreme Diamond indicator : here
Parameters: HMA Period HMA Smoothing HMA Price (close/open) Signal Period (Arrows)
FREE

MT5 Version Fibonacci Bollinger Bands MT4 Fibonacci Bollinger Bands is a highly customizable indicator that shows areas of support and resistance. This indicator combines the logic for the Bollinger Bands with the Fibonacci level. Fibonacci Bollinger Bands is the first indicator in the market that allows the user to 100% customize up to 12 Fibonacci levels, the Moving Average type and the price data source to use for the calculations. This flexibility makes the Fibonacci Bollinger Bands easi
FREE

"Five Minute Drives" indicator that is designed to be used in the 5 minute timeframe. One of its most important advantages is that it shows the general trend in the upper time frames when looking at the 5-minute timeframe. Therefore, when opening positions in the 5 minute timeframe, when it is in line with the trends in the upper timeframes, you are less likely to be upside down. If you can evaluate breakout/breakdown opportunities between the curves on the graphic screen with your geometric per
FREE

This Weis Wave Volume indicator is a tool to help traders identify the current price trend. Understanding volume can provide insight into a market's behavior to help you determine its overall health. The most important rule is this: volume precedes price. Typically, before a market price moves, volume comes into play. It has 2 main colors histogram which are green and red. – Green indicates an upward wave. The more the price increases, the bigger the green volume gets. – The red color shows a d
FREE

Check my p a id tools they work perfect please r ate Here is an Upgraded version with Bonus Ea in case of purchase it costs 30$ only and you get Ea as Bonus: https://www.mql5.com/en/market/product/96835 This indicator is experimetal, it shows TMA channel arrows with Volatility filter built in to avoid lagging. Try to experiment with it, search for better conditions of use. It is possible to adjust different timeframes for TMA and for Volatility filter Same time on the current chart, so it ma
FREE

Ce produit est conçu pour afficher les sessions de trading de 15 pays en fonction du fuseau horaire de votre serveur de courtier et de divers modes d'affichage en fonction des paramètres souhaités pour éviter la congestion des graphiques et la possibilité de définir une session avec l'heure souhaitée par l'utilisateur.
Le soleil ne se couche jamais sur le marché des changes, mais son rythme danse au rythme de séances de trading distinctes. Comprendre ces sessions, leurs chevauchements et leur
FREE

L'indicateur montre des niveaux ronds sur le graphique. Ils sont également appelés niveaux psychologiques, niveaux de banque ou niveaux des principaux acteurs. À ces niveaux, il y a une véritable lutte entre les haussiers et les baissiers, une accumulation de nombreux ordres, ce qui entraîne une volatilité accrue. L'indicateur s'adapte automatiquement à tout instrument et à toute période. Si le niveau 80 est cassé puis testé, il faut acheter. Si le niveau 20 est cassé puis testé, vendre. L'obje
FREE

Tired of using the same technical indicators? The "Tekno RSI" is an innovative tool designed to make the interpretation of the Relative Strength Index (RSI) more intuitive and accessible to traders of all levels. It displays the RSI as a 3-color histogram, providing a clear and intuitive visual representation of market conditions.
1)Key Features 3-Color Histogram: RSI is a versatile indicator providing insights into market direction and potential reversal points. However, when analyzing the ch
FREE
Le MetaTrader Market est le meilleur endroit pour vendre des robots de trading et des indicateurs techniques.
Il vous suffit de développer une application pour la plateforme MetaTrader avec un design attrayant et une bonne description. Nous vous expliquerons comment publier votre produit sur Market pour le proposer à des millions d'utilisateurs de MetaTrader.
Vous manquez des opportunités de trading :
- Applications de trading gratuites
- Plus de 8 000 signaux à copier
- Actualités économiques pour explorer les marchés financiers
Inscription
Se connecter
Si vous n'avez pas de compte, veuillez vous inscrire
Autorisez l'utilisation de cookies pour vous connecter au site Web MQL5.com.
Veuillez activer les paramètres nécessaires dans votre navigateur, sinon vous ne pourrez pas vous connecter.