MetaTrader 4용 무료 기술 지표 - 5

Stochastic RSI Indicator - Master the Art of Timing Elevate your trading game with the "Stochastic RSI Indicator." This powerful tool marries the Stochastic oscillator with the Relative Strength Index (RSI), offering precise insights into market dynamics. It's your key to mastering the art of timing in trading. About the Indicator : The Stochastic RSI Indicator combines two robust indicators - Stochastic and RSI - to provide traders with an exceptional tool for identifying entry and exit points
FREE

The Penta-O is a 6-point retracement harmonacci pattern which usually precedes big market movements. Penta-O patterns can expand and repaint quite a bit. To make things easier this indicator implements a twist: it waits for a donchian breakout in the right direction before signaling the trade. The end result is an otherwise repainting indicator with a very reliable trading signal. The donchian breakout period is entered as an input. [ Installation Guide | Update Guide | Troubleshooting | FAQ | A
FREE

Description: This indicator draw ZigZag Line in multiple time frame also search for Harmonic patterns before completion of the pattern.
Features: Five instances of ZigZag indicators can be configured to any desired timeframe and inputs. Draw Harmonic pattern before pattern completion. Display Fibonacci retracement ratios. Configurable Fibonacci retracement ratios. Draw AB=CD based on Fibonacci retracement you define. You can define margin of error allowed in Harmonic or Fibonacci calculations
FREE

HiLoTren IQ7 — 스마트 시장 경계 및 피벗 매핑 AI 정밀도로 거래 수준을 정의하세요.
HiLoTren IQ7은 피벗 포인트 , 저항(R1~R3) , 지지(S1~S3) 구역을 차트에 자동으로 표시하는 지능형 피벗 기반 지표 입니다.
시장 경계, 반전 구역, 추세 지속 수준을 식별하기 위한 명확한 시각적 프레임워크를 제공하며, 이는 모두 실시간으로 계산됩니다. 주요 특징 자동 피벗 엔진 - 일일 피벗과 R/S 레벨을 즉시 계산합니다. 동적 존 시각화 - 존 컬러링이 적용된 적응형 지지/저항선. 모든 기호에서 작동합니다 . 외환, 금, 암호화폐 및 지수가 지원됩니다. 플러그 앤 플레이 설정 - 구성이 필요 없는 간편함. 제한 및 정지 주문에 적합 - 가격이 반응하기 전에 높은 확률의 진입 구역을 시각화합니다. IQ7 거래 생태계의 일부 Combine HiLoTren IQ7 with:
OSC HiLoTren IQ7 — t
FREE

스캘퍼를 위한 VWAP
세션 인식 VWAP 라인으로 빠르고 정확한 스캘핑을 수행합니다. ️ 입력 (MT4/MT5) Enable_Hourly_VWAP: 시간별 VWAP 활성화. Enable_Asia_VWAP: 아시아 세션 VWAP 활성화. Enable_Europe_VWAP: 유럽 세션 VWAP 활성화. Enable_NA_VWAP: 북미 세션 VWAP 활성화. Enable_Extended_VWAP: 연장 세션 VWAP 활성화. Enable_Daily_VWAP: 일일 VWAP 활성화. 아시아 세션(GMT) Session_Asia_Start_Hour: 아시아 세션 시작 시간. Session_Asia_End_Hour: 아시아 세션 종료 시간. 유럽 세션(GMT) Session_Europe_Start_Hour: 유럽 세션 시작 시간. Session_Europe_End_Hour: 유럽 세션 종료 시간. 북미 세션(GMT) Session_NA_Start_Hour: 북미 세션 시작 시간. Ses
FREE
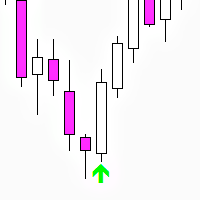
Three Bar Reversal (MT4) — free indicator Three Bar Reversal is a simple and effective MetaTrader 4 indicator that detects the classic three-bar reversal candlestick pattern with additional filtering based on ATR and candle body sizes.
Arrows are displayed on the last closed candle of the pattern, and push notifications are also sent. An automated trading robot Three Bar Reversal EA has been developed based on this indicator. The indicator works on all currency pairs and timeframes but pe
FREE
Этот индикатор является уникальным в своём роде, больше всего подходит для скальпинга на XAUUSD а также для торговли на более старших таймфреймах!
Уведомление сообщит самые важные точки входа, поэтому следует торговать по тренду. Идеален для скальпинга! The Best Trend Signals - трендовый мультивалютный индикатор, может использоваться на любых финансовых инструментах валюта, криптовалюта, металлы, акции, индексы. Рекомендуемый тайм-фрейм M15, M30, H1, H4, D1.
Как торговать с помощью индикатора
FREE
Overview
The TTM Squeeze indicator helps identify low volatility periods (squeeze) that often precede price breakouts. It uses Bollinger Bands (BB) and Keltner Channels (KC) to determine when the market is "coiling" and ready to move. Configuration Guide Volatility Settings The indicator uses Bollinger Bands to measure market volatility. When BBs are inside Keltner Channels, a squeeze is detected. The squeeze suggests the market is consolidating and may soon break out. True Range Option Optiona
FREE

Necessary for traders: tools and indicators Waves automatically calculate indicators, channel trend trading Perfect trend-wave automatic calculation channel calculation , MT4 Perfect trend-wave automatic calculation channel calculation , MT5 Local Trading copying Easy And Fast Copy , MT4 Easy And Fast Copy , MT5 Local Trading copying For DEMO Easy And Fast Copy , MT4 DEMO Easy And Fast Copy , MT5 DEMO Advanced Bollinger Bands:
1. The Bollinger rail will change color with the direction"
2. The
FREE
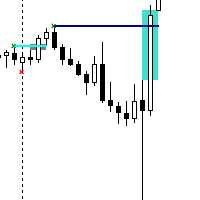
The Contraction/Expansion Breakout Indicator for MetaTrader 4 (MT4) is a powerful tool crafted to identify and signal the breakout of bullish and bearish contraction or expansion formations within financial markets. Utilizing advanced algorithmic calculations, this indicator assists traders in recognizing significant price movements that frequently accompany these formations, providing valuable insights for strategic trading decisions. Key Features: Contraction and Expansion Identification: The
FREE

Info Plus is a simple tool that displays the current status on an asset class. The information displayed by Info Plus includes: Bid Price The high and low of the day. Candle time left. Current spread. Selected timeframe. Asset class selected (Symbol). Pip value. Open Positions. Total pips booked. Pips per trade. Session times (they may not be accurate and are subject to changes). Date and time.
How it Works When loaded onto any chart, Info Plus automatically gets the following parameters: Bid P
FREE

Murray 의 수학적 수준은 Gann의 관찰과 가격의 직각도 이론을 기반으로 합니다. Gann 에 따르면 가격은 범위의 1/8로 움직입니다. 이 1/8을 사용하면 고유한 특성이 있는 특정 차트에 대해 다양한 저항 및 지지 수준을 얻을 수 있습니다. -2 또는 +2 수준의 돌파 후 또는 변동성이 감소한 후 재구축됩니다. 표시할 기간(현재 또는 전체 기록)을 선택할 수 있습니다. 모든 선은 버퍼를 통해 그려집니다. Blog-Link - Murrey Math Trading with UPD1 .
입력 매개변수.
Period - 계산 범위. History - 기록(현재/전체). Bars Count - 라인 길이.
Visual Button - 버튼 표시(활성화/비활성화). Corner - 버튼 앵커 각도. X indent - 픽셀의 수평 패딩. Y indent - 픽셀의 수직 패딩.
Label Visual - 디스플레이 레벨 레이블. Label Font Size - 글꼴
FREE

VWAP 크로스오버 신호 지표 for MetaTrader 4
VWAP 크로스오버 신호 지표로 정밀한 트레이딩을 열어보세요!
VWAP 크로스오버 신호 지표로 당신의 트레이딩 전략을 한 단계 끌어올리세요. 이 MetaTrader 4용으로 설계된 강력하고 직관적인 도구는 정확성과 명확성을 요구하는 트레이더를 위해 만들어졌습니다. 이 맞춤형 지표는 거래량 가중 평균 가격(VWAP)을 활용하여 차트에 직접 실행 가능한 매수 및 매도 신호를 제공합니다. 데이 트레이더, 스캘퍼, 스윙 트레이더에게 이상적인 이 지표는 높은 확률의 진입 및 청산 지점을 쉽게 식별할 수 있게 도와줍니다. 주요 기능: 동적 VWAP 계산: 사용자 지정 가능한 기간(기본값: 14)을 기반으로 VWAP를 계산하여 거래량으로 가중된 평균 가격을 정확히 반영합니다. 명확한 시각적 신호: 가격이 VWAP를 상향 돌파하면 녹색 상향 화살표와 "매수" 레이블이 표시되고, 하향 돌파하면 빨간색 하향 화살표와 "매도" 레이블이
FREE

This indicator displays buy or sell signals according to Bill Williams' definition of the Trading Zone. [ Installation Guide | Update Guide | Troubleshooting | FAQ | All Products ] Easy to use and understand Avoid trading flat markets Deterministic indicator with clear rules The indicator is non-repainting It implements alerts of all kinds It has straightforward trading implications. A blue arrow is a buy signal A red arrow is a sell signal According to Bill Williams trading in the zone helps to
FREE
Heikin Ashi Binary – 이진(2값) 표시 시각적 트렌드 지원 인디케이터 개요 Heikin Ashi Binary는 MetaTrader에서 Heikin Ashi 트렌드 정보를 이진(두 가지 색상 블록) 형식으로 서브윈도우에 표시하는 인디케이터입니다.
기존의 캔들 차트 대신, 상승(양봉)과 하락(음봉) 상태를 간단한 색상 블록으로 나타냅니다.
이로써 트렌드의 지속이나 반전을 빠르게 시각적으로 파악할 수 있습니다. 본 인디케이터는 수동 트레이딩, EA(자동매매), 바이너리 옵션의 트렌드 필터로 활용할 수 있습니다.
표준 Heikin Ashi와 스무딩(평활) Heikin Ashi 모드를 선택할 수 있으며, 시장 상황과 트레이딩 스타일에 맞게 조정할 수 있습니다. 주요 기능 서브윈도우 표시: 메인 차트와 별도로 트렌드 상태 확인 2가지 Heikin Ashi 모드: 표준과 평활(Smoothed) 지원 2단계 평활화: Smoothed 모드에서 두 개의 이동평균 기간 설정 가능 이진(
FREE
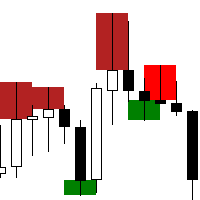
The "Rejection Block" MetaTrader 4 Indicator is a powerful tool designed to assist traders in identifying and visualizing rejection candlestick patterns, commonly referred to as rejection blocks. These patterns play a crucial role in market analysis as they often signify potential reversals or continuations in price movements. Key Features: Rejection Block Detection: The indicator meticulously scans price data to identify instances of rejection candlestick patterns. These patterns typically feat
FREE

UT Bot Alerts — Sistema de Trailing Stop baseado em ATR Conversão fiel do lendário indicador "UT Bot Alerts" de QuantNomad do TradingView para MQL5 e MQL4. Conceito original de HPotter, implementação inicial de Yo_adriiiiaan, versão Pine Script v4 com alertas de QuantNomad (Vadim Cissa) — um dos desenvolvedores quantitativos mais seguidos no TradingView com mais de 100 mil seguidores. O script original acumulou mais de 1,1 milhão de visualizações e 35.500 favoritos no TradingView, tornando-o um
FREE
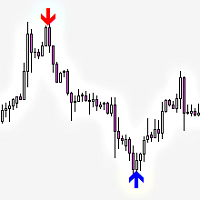
Railway Tracks Pattern — Reversal Pattern Indicator Railway Tracks Pattern is an indicator that automatically detects a powerful two-candle reversal pattern on the chart. It looks for two candles with opposite directions (bullish and bearish), similar in size, and with minimal wicks — a clear sign of momentum shift. How it works: The first candle is strong and directional. The second candle moves in the opposite direction and is of similar size. Both candles have small shadows (wicks). The
FREE

Matrix Arrow Indicator Multi Timeframe Panel MT4 는 Matrix Arrow Indicator MT4 를 위한 무료 추가 기능이자 훌륭한 자산입니다. 5개의 사용자 맞춤형 타임프레임과 총 16개의 수정 가능한 기호/기기에 대한 현재 매트릭스 화살표 표시기 MT4 신호를 보여줍니다. 사용자는 Matrix Arrow Indicator MT4 로 구성된 10개의 표준 표시기를 활성화/비활성화할 수 있습니다. Matrix Arrow Indicator MT4 에서와 같이 10개의 모든 표준 지표 속성도 조정 가능합니다. 매트릭스 화살표 표시기 다중 시간 프레임 패널 MT4는 16개의 수정 가능한 기호 버튼 중 하나를 클릭하여 첨부된 현재 차트를 변경할 수 있는 옵션도 제공합니다. 이렇게 하면 다른 기호 간에 훨씬 빠르게 작업할 수 있고 다시는 거래 기회를 놓치지 않을 수 있습니다.
이 무료 Matrix Arrow Indicator Multi Timef
FREE

How To Use
Check out this post for detailed description on All Indicator extras and template: https://www.mql5.com/en/blogs/post/758259
The Best Heiken Ashi System is a simple trading system for trading based only two indicators for generate signals: Heiken ashi smoothed and Vqzz indicator multi-timeframe. The system was created for scalping and day trading but can also be configured for higher time frames. As mentioned, the trading system is simple, you get into position when the two indica
FREE

MidPrice_A — The Hidden Power of the Market in a Single Number Looking for a way to see the true market direction without noise, lag, or overloaded charts?
MidPrice_A is a minimalistic yet powerful tool that reveals the pure price impulse , based on a professional market movement logic. What does MidPrice_A do? Unlike traditional indicators that rely on closing prices and often lag behind, MidPrice_A analyzes the candle mid-price and measures how far the market has actually shifted over the last
FREE

This indicator finds Three Drives patterns. The Three Drives pattern is a 6-point reversal pattern characterised by a series of higher highs or lower lows that complete at a 127% or 161.8% Fibonacci extension. It signals that the market is exhausted and a reversal can happen. [ Installation Guide | Update Guide | Troubleshooting | FAQ | All Products ] Customizable pattern sizes
Customizable colors and sizes
Customizable breakout periods Customizable 1-2-3 and 0-A-B ratios
It implements visual/s
FREE

전일 종가 및 바 이동을 위한 MetaTrader 인디케이터! 전일 종가 및 바 이동 인디케이터는 기술적 분석과 거래 결정을 향상시키기 위해 개발된 도구입니다. 이 인디케이터를 사용하면 어떤 바의 개방가, 고가, 저가, 종가에 대한 상세한 정보를 얻어 시장 움직임에 대한 정확하고 포괄적인 분석이 가능합니다. 현재 타임프레임 내에서 다른 타임프레임을 적용할 수 있는 기능을 상상해보세요. 전일 종가 및 바 이동 인디케이터를 사용하면 이 놀라운 기능을 손쉽게 사용할 수 있습니다! 전일 종가가 서포트와 저항으로서의 중요성은 거래자 커뮤니티에서 널리 인정되고 있습니다. 이제 이 도구를 사용하여 이전 종가에서 가격이 멈춘 수준을 명확하고 정확하게 파악하여 매수 및 매도 결정에 유용한 정보를 얻을 수 있습니다. 인디케이터를 차트에 적용하면 시각적으로 매력적으로 강조된 전일 개방가, 고가, 저가, 종가의 중요한 정보에 즉시 액세스할 수 있습니다. 또한 바 이동을 조정하여 MetaTrader의 어떤
FREE

The Supreme HmaSignal indicator is an indicator for trend trading , its main character is the hull moving average colored line , and secondary is buy and sell arrows , arrows are fair but the main focus is on the colored hma , this indicator does not repaint or back paint or delay its signals. if you like this indicator please check my Supreme Trendhisto: here , and my Supreme Diamond indicator : here
Parameters: HMA Period HMA Smoothing HMA Price (close/open) Signal Period (Arrows)
FREE
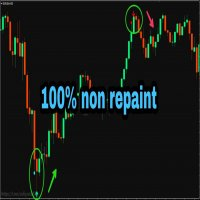
PLEASE NOTE You can customize the settings of K_period value, the oversold and the overbought value is customizable. You can change it as per your requirement. The accuracy will change as per your settings.
100% Non repaint indicator
Pre-alert (get ready) signals
Non-delay indications
24/7 signals
100% No lag
No recalculating The arrows wont repaint even if the signal fails, or you refresh or restart the mt4 Indicator is based on simple crossover strategy of main line and signal line of St
FREE

Standard RSI uses a fixed smoothing factor. Every bar gets the same weight whether the market is trending cleanly or chopping sideways. That is why most RSI signals fail during consolidation. Mystical RSI measures how chaotic price action is on every bar using the Fractal Dimension Index and dynamically adjusts its smoothing in real time. When the market trends, it reacts fast. When the market chops, it slows down and filters out noise. No manual adjustment needed. How It Works The indicator
FREE

VR 그리드 표시기는 사용자 정의 설정으로 그래픽 그리드를 생성하도록 설계 되었습니다. 표준 그리드 와 달리 VR 그리드는 원형 레벨 을 구축하는 데 사용됩니다. 사용자의 선택에 따라 라운드 수준 사이의 단계는 임의적일 수 있습니다. 또한 VR Grid는 다른 인디케이터나 유틸리티와는 달리 기간이 바뀌거나 단말기를 재부팅해도 그리드의 위치 를 유지합니다. 설정, 세트 파일, 데모 버전, 지침, 문제 해결 등은 다음에서 얻을 수 있습니다. [블로그]
다음에서 리뷰를 읽거나 작성할 수 있습니다. [링크]
버전 [MetaTrader 5] 수직 수준 은 실제 시간 간격을 기준으로 하며 누락 또는 존재하지 않는 기간은 무시 합니다. 따라서 레벨 사이의 단계는 사용자가 선택한 값과 엄격하게 일치합니다. VR 그리드 표시기를 사용할 때 트레이더는 모든 수준에서 스타일 , 수직선 및 수평선의 색상 및 두께를 변경할 수 있습니다. 이를 통해 금융 상품의 라운드 수준 을 제어할 수 있습니다. 라운
FREE

표시기는 표시된 정보를 단순화하도록 설계된 하나의 차트에 두 개의 서로 다른 쌍을 표시합니다.
터미널에서 사용 가능한 거의 모든 금융상품(통화쌍뿐만 아니라 금속 및 원자재)에 대한 작업이 가능합니다. 모든 통화쌍에 대한 시각적 상관관계 방법을 사용하는 기능 하위심볼. 통화 쌍은 색깔 있는 양초와 함께 화면에 표시됩니다. 이것은 동일한 상관 쌍입니다. 미러링. 보조 통화. 이 지표는 두 가지 유형의 상관관계를 반영합니다.
설정
하위 기호 = "USDCHF"; BullBarColor = 주황색빨간색; BearBarColor = 노란색; 색상 GridColor = 흰색; 미러링 = 거짓;
The indicator displays two different pairs on one chart, designed to simplify the displayed information, Capable of working with almost all instruments a
FREE

The popular "SuperTrend" indicator is a technical analysis tool designed to help identify trend direction and potential entry or exit points in financial markets. This indicator is built upon the Average True Range (ATR) , which gauges market volatility based on price ranges. It is available for free on other platforms, and this should be no exception! Common Use Cases The SuperTrend is typically utilized in three primary ways: Trend Identification: When the price is trading above the indicator
FREE
UzFx-Total TP'SL & Timer-MT4 지표는 모든 개시 및 보류 중인 거래에 대한 총 이익실현(TP) 및 손절(SL) 값을 실시간으로 추적하도록 설계되었습니다. 또한 현재 캔들이 마감되기까지 남은 시간을 표시하는 캔들 카운트다운 타이머를 포함합니다.
주요 기능:
모든 활성 거래 및 대기 주문으로부터 예상 총 수익과 손실을 자동 계산합니다. 현재 캔들 마감까지 남은 시간을 표시하여 트레이더가 진입 및 청산을 효율적으로 관리할 수 있도록 돕습니다. 사용자가 가독성을 높이기 위해 텍스트 색상, 글꼴 크기 및 위치를 구성할 수 있습니다. 차트를 복잡하게 하지 않는 단순하고 가벼운 디자인입니다.
사용자 입력: 테이크 프로핏 및 스탑 로스 표시 색상 선택. 캔들 타이머 텍스트 색상을 맞춤 설정합니다. 글꼴 크기와 차트 상의 위치를 조정합니다. 사용 사례:
각 주문을 수동으로 확인하지 않고도 위험 및 보상 수준을 빠르게 파악하고자 하는 트레이더에게 이상적입니다. 정확한 거
FREE
This is a powerful, session-aware breakout indicator designed for serious traders who thrive on volatility and structure. Engineered for precision, it identifies high-probability breakout zones during the London and New York trading sessions—where the market moves with intent. Key Features: Session Range Detection
Automatically detects and highlights the key price range of London and New York sessions. Breakout Confirmation
Identifies breakout candles after the session range, with cl
FREE

TPSpro 리스크 관리자 패널은 현재 계정 상태를 파악하고자 하는 사용자에게 편리한 도구입니다. 이 패널은 당사의 리스크 관리 시스템의 일부이며, 더욱 강력한 TPSpro 리스크 관리자 제품에 통합되어 있습니다.
패널은 각각 유용한 정보를 담고 있는 세 개의 열로 구성되어 있습니다. 첫 번째 열에는 현재 월 초 기준 계좌 정보가 표시되며, 전체 수익률이 백분율로, 입금 통화가 함께 표시됩니다. 두 번째 열에는 설정에서 지정한 일일 위험도가 표시됩니다. 세 번째 열에는 현재 계좌 상태가 표시됩니다.
벌칙 항목에는 벌칙 시간(일일 최대 손실액이 두 배로 늘어나는 경우)이 표시됩니다. TPSpro 리스크 관리자 패널은 다중 통화 지표입니다. 단일 통화 쌍 차트에 적용해야 합니다! 이 패널은 유연한 외관 설정 기능을 제공하므로 누구나 최적의 색상, 글꼴 크기 등을 선택할 수 있습니다. 정보 패널에는 다음과 같은 사용자 지정 가능한 매개변수가 있습니다. 1번 블록
FREE
ALL MOVING AVERAGES: 다양한 전략을 위한 궁극의 사용자 정의 지표 ALL MOVING AVERAGES 사용자 정의 지표는 31가지가 넘는 가장 인기 있는 이동 평균 을 인상적으로 모아놓은 심층 기술 분석을 위한 필수 도구입니다. 숙련된 트레이더와 초보자 모두를 위해 설계된 이 지표는 비교할 수 없는 유연성을 제공하여 광범위한 거래 전략에 맞게 이동 평균을 완벽하게 조정할 수 있습니다. 기간 및 다양한 가격 계산 유형을 포함한 포괄적인 입력 매개변수 범위를 통해 거래 스타일과 분석 요구 사항에 맞게 지표를 쉽게 조정할 수 있습니다. 주요 기능 및 이점: 광범위한 이동 평균 라이브러리: 고전적인 단순 이동 평균(SMA)부터 Hull 이동 평균 및 제로-지연 지수 이동 평균과 같은 고급 옵션에 이르기까지 31가지가 넘는 방대한 이동 평균 중에서 선택하여 모든 도구를 마음껏 사용할 수 있습니다. 높은 사용자 정의 가능성: 기간을 조정하고 표준 종가, 시가, 고가, 저가 및
FREE

Zig Zag 123 tells us when a reversal or continuation is more likely by looking at the shift in supply and demand. When this happens a signature pattern appears known as 123 (also known ABC) will often break out in direction of higher low or lower high.
Stop loss and take profit levels have been added. There is a panel that shows the overall performance of your trades for if you was to use these stop loss and take profit levels.
We get alerted if a pattern 123 appears and also if the price re
FREE

Description: The indicator measures, through the zigzag indicator, the levels of trend or correction. It shows in the chart the levels of each low or high detected. KEY LINKS: How to Install – Frequent Questions - All Products How is this indicator useful? This indicator determines, depending on Zigzag parameter if a trend is beginning, developing, or ending This indicator determines the direction of the trend Components Levels as positive or negative numbers, depending on the direction
FREE
이중 라인 신호, 3단계 시스템, 다중 타임프레임 지원, 사용자 정의 시각 신호 및 고도로 구성 가능한 알림 시스템을 갖춘 고급 스토캐스틱 오실레이터.
프리랜서 프로그래밍 서비스, 업데이트 및 기타 TrueTL 제품은 제 MQL5 프로필 에서 확인하실 수 있습니다.
피드백과 리뷰를 진심으로 환영합니다!
스토캐스틱 오실레이터란? 스토캐스틱 오실레이터는 특정 기간 동안 종가를 가격 범위와 비교하는 모멘텀 지표입니다. 이 지표는 두 개의 라인으로 구성됩니다: %K (메인 라인)와 %D (신호 라인, %K의 이동 평균). 스토캐스틱은 0에서 100 사이에서 진동합니다. 높은 수치는 과매수 상태를 나타내고, 낮은 수치는 과매도 상태를 나타냅니다. %K와 %D 라인 간의 교차 및 레벨 경계를 통한 움직임은 거래 신호로 일반적으로 사용됩니다. 기능: 3단계 시스템(높음, 중간, 낮음)을 갖춘 이중 라인 스토캐스틱(%K 및 %D) 세 개의 독립적으로 구성 가능한 신호 버퍼가 있는 시각적 신호
FREE

For some trader's charts analysis use, specially for multi timeframe trading strategies . When you need to check something of the time within different timeframe at the same symbol chart, even different symbol charts, this indicator will show the crosshair at sync moving. You just need to load this indicator into some charts, then the crosshair will shown automatic.
FREE
The Super Arrow PRT Indicator generates high-probability trading signals by using multiple indicators such as Moving Averages, Bull/Bear power, Relative Strength Index (RSI), Bollinger Bands, and Magic Filter. It filters out false signals and provides good trade signals by combining these indicators. The Supper Arrow PRT indicator is a trend reversal system that paints buy/sell signal arrows at the potential reversal zone of the price. The buy/sell signal arrows are painted directly on the ch
FREE
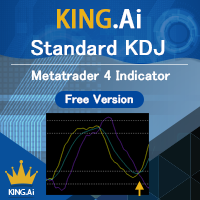
The standard KDJ indicator is presented by KING.Ai. This indicator were built base on the the theory of KDJ . KDJ is a very effective and useful strategy to trade especially in swing trading. Method to apply (please also refer to the graphic): 80/20 rule: Price from bottom to top 20 to 80. And price from top to bottom 80 to 20. Both is enter market signal. Indicator period: The indicator is made by period 9,3,3 KING.Ai Forex trader believe that such strategy must complement with other indicato
FREE

Discover the power of precision and efficiency in your trading with the " Super Auto Fibonacci " MT4 indicator. This cutting-edge tool is meticulously designed to enhance your technical analysis, providing you with invaluable insights to make informed trading decisions. Key Features: Automated Fibonacci Analysis: Say goodbye to the hassle of manual Fibonacci retracement and extension drawing. "Super Auto Fibonacci" instantly identifies and plots Fibonacci levels on your MT4 chart, saving you tim
FREE

Product Name: HTF Candle Insight (EurUsd) - See the Big Picture Description: IMPORTANT: This version works EXCLUSIVELY on the EURUSD symbol. (It supports all broker prefixes/suffixes, e.g., pro.EURUSD, EURUSD.m, but will NOT work on Gold, Bitcoin, or other pairs). Experience the full power of "HTF Candle Insight" completely on EURUSD! Stop switching tabs constantly! This indicator allows you to visualize Higher Timeframe price action directly on your current trading chart. Whether you are a Scal
FREE

JONUX FRVP — Professional Fixed Range Volume Profile (FREE) JONUX FRVP is a specialized analytical tool designed to visualize precise volume distribution within the MetaTrader 4 environment. We are offering this professional-grade utility completely for FREE to the trading community to showcase the quality and precision of JONUX Systems. Unlike standard volume indicators that are statically bound to chart periods, this tool employs a fully interactive, dynamic engine to analyze the exact volume
FREE

인디케이터는 차트에 모든 텍스트와 이미지를 표시하며 매크로에서 요청한 정보도 표시할 수 있습니다. 텍스트 블록은 3개, 이미지 블록은 1개가 있습니다. 글꼴 선택, 크기, 색상, 들여쓰기 및 위치 지정이 가능합니다. 스크린샷에 브랜드를 붙이거나 차트에 필요한 정보를 표시하고 싶을 때 UPD1 Watermark 는 매우 유용한 도구가 될 것입니다.
설정 설명.
텍스트 설정(3개 블록). Text 1, 2, 3 – 텍스트 또는 매크로를 입력합니다. Font Name – 글꼴 이름을 입력합니다. 오류 발생 시 기본 글꼴이 사용됩니다. Font Size – 글꼴 크기를 지정합니다. Font Color – 글꼴 색상을 지정합니다. Corner – 개체 스냅 각도를 선택합니다. Visual Position – 개체를 차트 앞 또는 뒤에 배치합니다. X – 픽셀 단위의 가로 들여쓰기. Y – 픽셀 단위의 수직 들여쓰기.
이미지 설정(1블록). Image – 이미지를 선택합니다. Manua
FREE
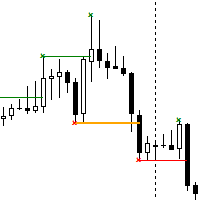
The Break of Structure (BoS) and Change of Character indicator is a powerful tool designed to identify significant turning points in price movements on financial charts within the MetaTrader 4 platform. By analyzing price action, this indicator highlights instances where the market shifts from a trend to a potential reversal or consolidation phase. Utilizing sophisticated algorithms, the indicator identifies breakouts where the structure of price movement undergoes notable changes. These breakou
FREE

EZ Risk Reward Ratio is a simple to use MT4 indicator that allows the user to automatically change the Risk Reward Ratio of an open trade simply by dragging the Take Profit or Stop Loss lines to desired positions on any chart. Risk to reward ratio is displayed in whichever corner you choose and can be changed by dragging TP and SL lines.
First, place the EZ Risk Reward Ratio indicator on the MT4 chart. Second, open a trade on the MT4 chart. EZ Risk Reward Ratio works on any currency pair and o
FREE

The Swing High Low Indicator is an essential tool for traders who rely on price action. It automatically marks key reversal points (swing highs in red, swing lows in green), helping you visualize trends, spot breakouts, and draw precise trendlines. By highlighting these critical levels, the indicator reveals market structure shifts—whether the trend is strengthening, reversing, or entering consolidation. Perfect for all timeframes and strategies, it turns raw price data into actionable tradi
FREE

Modified oscillator MACD. A classic indicator that combines a trend indicator with an oscillator to detect entry points. Has a multi-timeframe panel and 3 types of notifications
Benefits:
Works on all instruments and timeseries Trend indicator with oscillator for inputs Multi-period panel on all timeframes Pluggable arrows when signals appear Three types of notifications: push, email, alert
MT5 version -> HERE / Our news -> HERE
How the indicator works:
AW Classic MACD - Indicator of
FREE

A trend indicator showing the strength of bulls and bears in a trading range.
Consists of two lines:
The green line is a balanced overbought/oversold condition. The red line is the direction of trading activity. Does not redraw calculations.
Can be used on all Symbols/Instruments/Time Frames.
Easy to use and set up.
How to use the indicator and what it determines.
The basic rule is to follow the direction of the red line:
if it crosses the green line from the bottom up, the market is dominat
FREE
MTF Fair Value Gaps Alerts indicator is based on Fair Value Gaps (FVG), Volume imbalance (VI) and Gaps. This indicator will create 2 arrows pointing to the left showing the area of the FVG, VI and Gaps and will never repaint after the candle has been closed .
Inputs: TF (Timeframe of the Alert For Current timeframe use CURRENT)
barshilft : the barshift needs to be the same timeframe as the above TF. barshift format (CURRENT, M1, M5, M15, M30, H1, H4, D1, W1, MN) Send Email: Audible Alert Push N
FREE

The TrueChannel indicator shows us the true price movement channels. This indicator resembles Donchian Channel in its appearance, but is built on the basis of completely different principles and gives (in comparison with Donchian Channel , which is better just to use to assess volatility) more adequate trading signals. As shown in the article , the price actually moves in channels parallel to the time axis and jumps abruptly from the previous channels to the subsequ
FREE

Trend Lines Cross This indicator will alert you on any cross of a Trendline. You can draw up to two trend lines and form a channel, a pennant , a triangle or a simple trend and when the price crosses either trend line the indicator will provide you with alerts that you define plus an up or down arrow when the cross happened. How to: Draw the 1st trendline and name it tl1. Draw the 2nd trendline and name it tl2. Select which type of alerts you would like in the indicator properties and you a
FREE

The Support & Resistance Breakout Indicator with Smart Alerts a utomatically identifies key support and resistance levels using fractal detection, and receive instant breakout signals enhanced by RSI/CCI confirmation filters. This versatile tool includes push notifications, email alerts, pop-up alerts, and sound alerts so you never miss a trading opportunity. Key Features:
Dynamic Level Detection – Draws real-time support and resistance based on market fractals. Breakout Arrows – Clear vis
FREE

Super trend is one of the best trend indicators in metatrader 4 (MT4). Triple SuperTrend indicator is an indicator that consist of three super trend indicator that can be aranged. This indicator is built by mql4 language and doesn't provided by MT4 platform. Highly recommended using EMA SuperTrend Strategy Indicator if you want to get better result in here:
https://www.mql5.com/en/market/product/91664
This indicator is easy to use, power full and has many benefits, there are: Using three indic
FREE

Gold TL MTF - this is a fine stock technical indicator. The indicator algorithm analyzes the movement of the asset price and reflects trend lines along the fractals of a specific timeframe (TF).
Benefits of the indicator: The indicator produces signals with high accuracy. The confirmed signal of the indicator does not disappear and is not redrawn. You can trade on the MetaTrader 4 trading platform of any broker. You can trade any assets (currencies, metals, cryptocurrencies, stocks, indices e
FREE

WaPreviousCandleLevels MT4 shows the previous candle levels, it shows the previous candle Open High Low Close levels (OHLC Levels) in different time frame. It's designed to help the trader to analyse the market and pay attention to the previous candle levels in different time frame. We all know that the OHLC Levels in Monthly, Weekly and Daily are really strong and must of the time, the price strongly reacts at those levels. In the technical analysis, the user can use them as a support and res
FREE
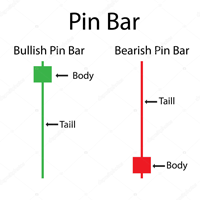
Pin bar pattern is characterized by a long upper or lower wick with a small body relative to the size of the wick with little to no lower or upper shadows. Pin bars are not to be traded in isolation , but need to be considered within the larger context of the chart analysis. A pin bar entry signal, in a trending market, can offer a very high-probability entry and a good risk to reward scenario.
Inputs MinimumTailPips- Minimum size of Tail in pips; TailBodyCandle- means how many times Tail grea
FREE

캔들 컬러 데이 - 요일별 색상 캔들스틱 지표
이게 뭔가요?
차트에서 요일에 따라 캔들스틱 색상을 바꿔주는 간단한 시각화 도구입니다. 월요일은 한 가지 색상, 화요일은 다른 색상 등으로 표시됩니다. 특정 요일에 가격이 특정 방식으로 움직이는 경우가 얼마나 자주 있는지 궁금했던 적이 있으신가요? 이 지표는 그러한 패턴을 파악하는 데 도움을 줍니다.
누구를 위한 도구인가요?
다음과 같은 트레이더에게 적합합니다.
과거 데이터를 사용하여 요일을 빠르게 파악하고 싶은 트레이더
가격 움직임에서 계절적 패턴을 찾고 싶은 트레이더
차트에서 추가적인 시각적 참고 자료가 필요한 트레이더
특정 요일이 거래에 미치는 영향을 분석하고 싶은 트레이더
어떻게 작동하나요?
이 지표는 기존 캔들스틱 위에 색상이 있는 선을 그려주며, 아래에는 원래의 일본식 캔들스틱이 그대로 유지됩니다. 각 요일에는 서로 다른 색상이 지정됩니다. 기본 설정:
월요일 - 빨간색
화요일 - 녹색
수요일 - 파란
FREE

The Indicator show Daily Pivot Points. It is possible to specify the number of days to display. For forex it doesn't consider the sunday session data. It is possibile to modify the color, style and width for every level.It is better to use this indicator with timeframe not higher than Н1. 4 Levels of support and resistance with also Intermediate Levels that is possible to hide.
FREE

Vantage Pro is a manual trading indicator designed to identify potential market reversal points. It utilizes a combination of Volatility Bands and Momentum analysis (RSI) to detect overbought and oversold conditions on the current chart. This tool is engineered for traders who prefer a clear visual representation of market extremes. Instead of lagging lines, it plots direct entry signals and calculates dynamic risk levels based on market volatility. Operational Logic The indicator monitors pri
FREE
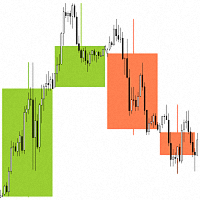
"Candlesticks MTF 4" is an informational indicator that displays "Japanese Candlesticks" . The indicator analyzes and determines the opening and closing times of candles from higher time frames.
An algorithm has been developed for the "Candlesticks MTF 4" indicator that corrects the discrepancy between the opening and closing times of candles from higher time frames. For example, if the opening time of a candle on a weekly time frame is the 1st of the month, and on the smaller time frame this
FREE

Calculation of Lot Size for many traders is a big challenge.
A case that is very important in money management. What many traders ignore.
Choosing an appropriate Lot Size in trades can improve results and it will ultimately lead to success.
This indicator calculates the authorized Lot Size for your trades.
The indicator uses the following values to get the appropriate Lot Size for positioning:
The distance of Stop Loss.
The Pip Value.
The amount of Risk Allowed For Each Trade.
The amoun
FREE

이것은 무료 제품이므로 필요에 따라 사용하시면 됩니다!
긍정적인 별 5개 평가를 남겨주시면 정말 감사하겠습니다! 감사합니다! 여기를 클릭하여 고품질 트레이딩 로봇과 지표를 확인하세요! ............................................................................. MT4용 외환 지표 스프레드 디스플레이, 훌륭한 보조 거래 도구. ............................................................................. - 스프레드 디스플레이 지표는 부착된 외환 쌍의 현재 스프레드를 표시합니다. - 차트의 어느 모서리에서나 스프레드 디스플레이 값을 찾을 수 있습니다. - 색상과 글꼴 크기도 설정할 수 있습니다. 이 MQL5 웹사이트에서만 제공되는 오리지널 제품입니다.
FREE

MTF WPR Screener A compact multi-timeframe dashboard that converts Williams’ %R (WPR) into a clear, actionable signal: NOW: BUY/SELL with confidence % , plus the Best Entry TF suggestion and a simple volatility label . What you get NOW decision (every second): BUY / SELL + confidence % Best Entry TF: highlights the most suitable timeframe for entry in the current direction MTF table (optional): WPR values across timeframes in one panel (toggle “Details”) Two trade display modes: STRICT: shows
FREE

The Supply and Demand with Swap zones MTF indicator is a powerful tool for technical analysis that has been modified and enhanced to provide traders with even more valuable information. This tool is based on the rule of supply and demand and allows traders to analyze a chart on three different timeframes at once, providing a more comprehensive view of the market. One of the key features of this indicator is the so-called swap zones, which are areas that have been broken through by the price but
FREE

Fractal Reversal Pro identifies 1-2-3 reversal patterns based on fractals and displays potential trend reversals with visual arrows on the chart. Core Features: The indicator detects classic 1-2-3 reversal patterns through fractal analysis. Blue arrows mark bullish signals below price, red arrows mark bearish signals above price. Optional Filters for Signal Enhancement: Trend filter with moving average Volume filter for confirmation with above-average volume Higher timeframe confirmation for tre
FREE

인디케이터는 차트의 라운드 레벨을 보여줍니다. 심리적, 뱅킹 또는 주요 플레이어 레벨이라고도 합니다. 이 수준에서 황소와 곰 사이에 실제 싸움이 있고 많은 주문이 누적되어 변동성이 증가합니다. 표시기는 모든 악기와 기간에 따라 자동으로 조정됩니다. 80레벨을 돌파하고 테스트를 하면 구매합니다. 20레벨 돌파 후 테스트 하면 판매합니다. 목표는 00입니다. 주목. 강력한 지원 및 저항 수준으로 인해 가격이 00 수준을 약간 놓칠 수 있습니다.
입력 매개변수.
Bars Count - 라인 길이. Show 00 Levels - 00 레벨을 표시하거나 표시하지 않음. Show 10, 90 Levels. Show 20, 80 Levels. Show 30, 70 Levels. Show 40, 60 Levels. Show 50 Levels. N Lines - 차트의 레벨 수를 제한하는 매개변수. Distance 00 Levels - 레벨 사이의 거리(자동 또는 수동). Line Positi
FREE

표시기는 모든 기간의 모든 기호에 대해 최소화된 차트를 표시합니다. 표시되는 차트의 최대 수는 28개입니다. 차트는 기본 창과 하단 창에서 모두 찾을 수 있습니다. 두 가지 표시 모드: 양초와 막대. 표시되는 데이터의 양(막대 및 캔들)과 차트 크기는 조정 가능합니다. 매개변수: Corner - 시작 코너 표시(목록에서 선택) CandleMode - 디스플레이 모드: true - 양초, false - 막대 ShowLastBid - 마지막 가격 표시 활성화/비활성화 LastBidShiftX - X 축에 의한 마지막 가격 라인 이동(모든 이동은 보다 정확한 표시를 위해 사용됨) LastBidShiftY - Y 축에 의한 마지막 가격 라인 이동 ColorLB - 마지막 가격 라인 색상 BarsToDisplay - 현재 막대 없이 표시되는 막대/촛불의 양 LineColor - 선 색상(Doji 양초) BullColor - 강세 막대/촛불 색상 BearColor - 약세 막대/촛불 색상 Sc
FREE
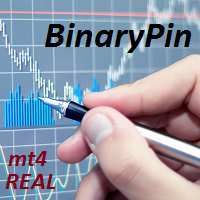
BinaryPin is an indicator developed and adapted specifically for trading short-term binary options. The indicator's algorithm, before issuing the signal, analyzes many factors, such as market volatility, searches for the PinBar pattern, calculates the probability of success when making a deal. The indicator is set in the usual way. The indicator itself consists of an information window where the name of the trading instrument is displayed, the probability of making a successful transaction, the
FREE

BeST Oscillators Collection is a Composite MT4 Indicator including the Chaikin,Chande and TRIX Oscillators which by default are contained in MT5 but not in MT4 platform. It also provides the option of displaying or not a Mov. Avg. as a Signal Line and the resulting Signals as Arrows in a Normal (all arrows) or in a Reverse Mode (without showing up any resulting successive and of same type arrows). Analytically for each one of the specific Oscillators: The Chaikin Oscillator ( CHO ) is
FREE

RT_TrendlineTool : Semi-AutoTrendline Tool on MT4 2 easy steps, just press the [T] button on your keyboard and click on the Swing High/Low that you're interested.
Then the indicator will try to draw a trendline that runs through only the wick, not cut through candlestick's body
and try to cross the swing point as much as possible with the least slope of the trendline. You can draw up to 10 trendlines.
You are able to get alert when price breakout these trendlines. Additional Hotkey : Press [M]
FREE
MetaTrader 마켓은 개발자들이 거래 애플리케이션을 판매할 수 있는 간단하고 편리한 사이트이다.
제품을 게시하고 마켓용 제품 설명을 어떻게 준비하는가를 설명하는 데 도움이 됩니다. 마켓의 모든 애플리케이션은 암호화로 보호되며 구매자의 컴퓨터에서만 실행할 수 있습니다. 불법 복제는 불가능합니다.
트레이딩 기회를 놓치고 있어요:
- 무료 트레이딩 앱
- 복사용 8,000 이상의 시그널
- 금융 시장 개척을 위한 경제 뉴스
등록
로그인
계정이 없으시면, 가입하십시오
MQL5.com 웹사이트에 로그인을 하기 위해 쿠키를 허용하십시오.
브라우저에서 필요한 설정을 활성화하시지 않으면, 로그인할 수 없습니다.