SlingShot and Pinch Strategy
- 指标
- 版本: 1.10
- 更新: 11 七月 2023
- 激活: 10
Scalping, Mean reversion or Position trading strategy
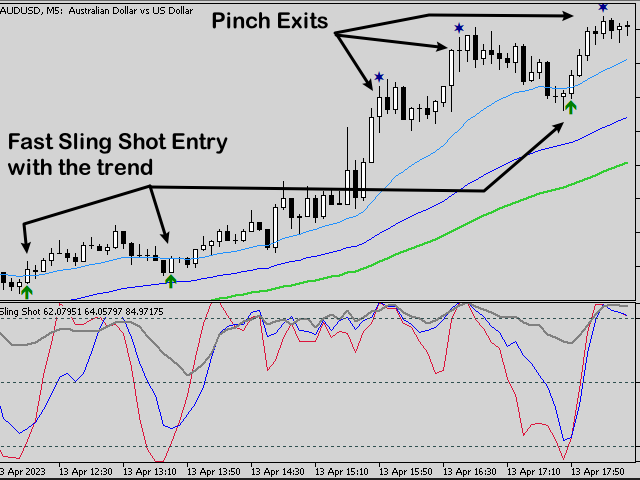
Get into an established trend on a pullback in the market.
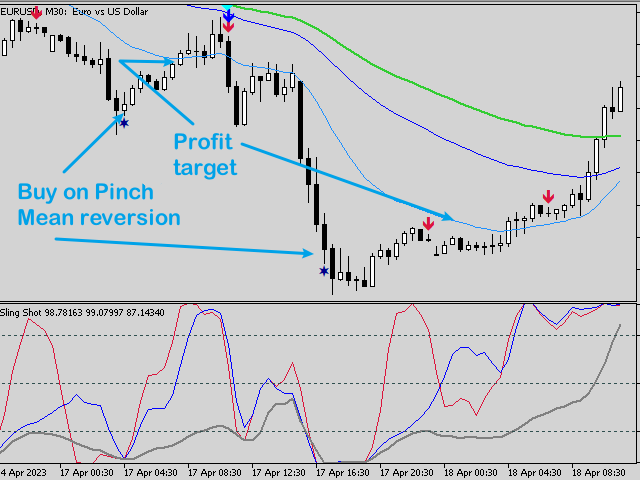
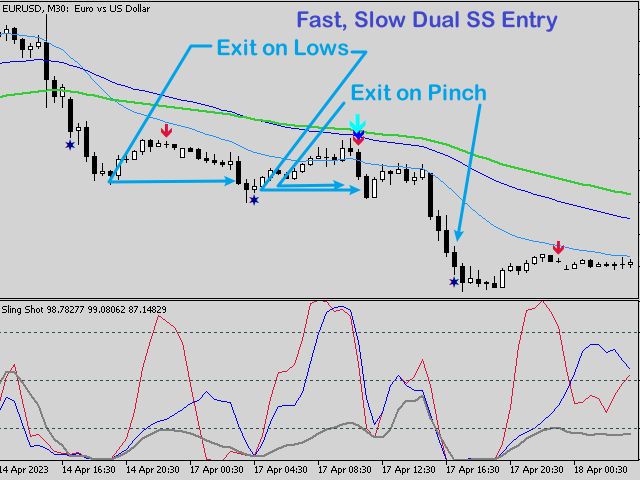
Use the Pinch in the indicator for profit taking.
Use the Pinch as a mean reversion strategy, scalping back to a moving average line.
Input Parameters
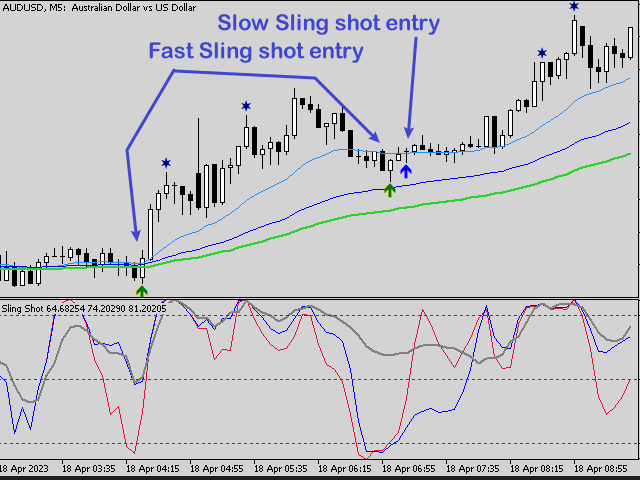
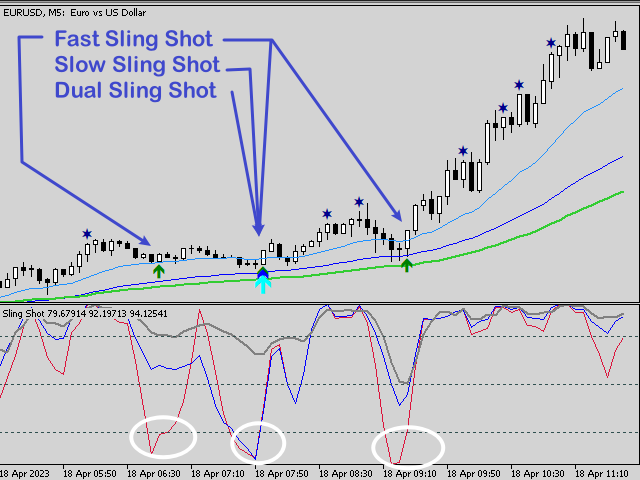
- Fast Sling Shot configuration.
- Slow Sling Shot configuration.
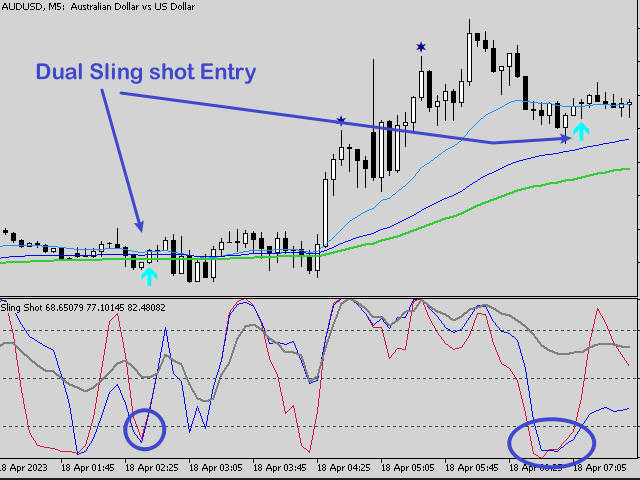
- Dual Sling Shot configuration.
- Price line configuration.
- Trigger zones or levels.
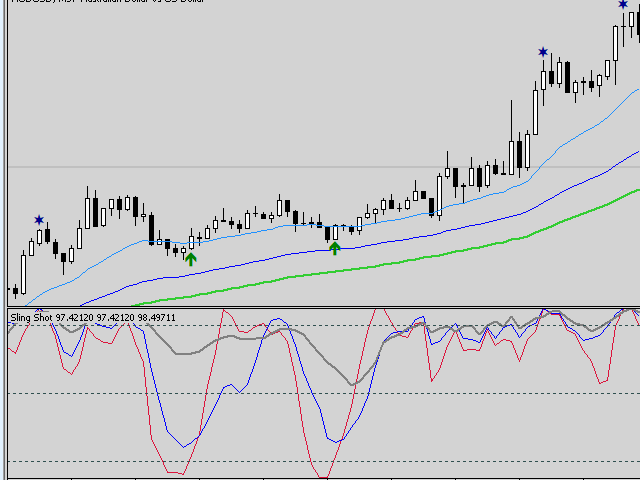
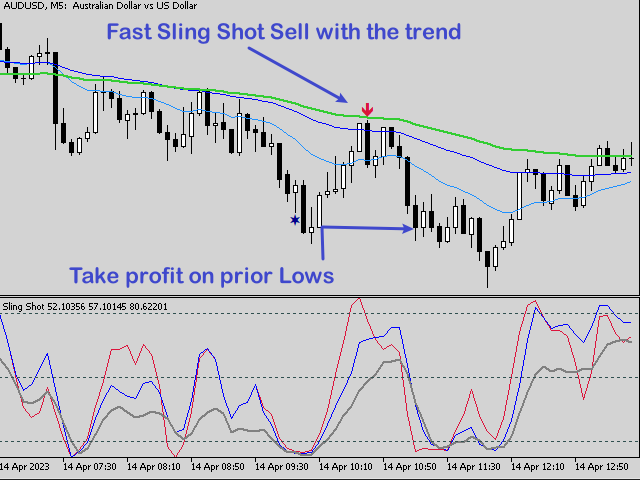
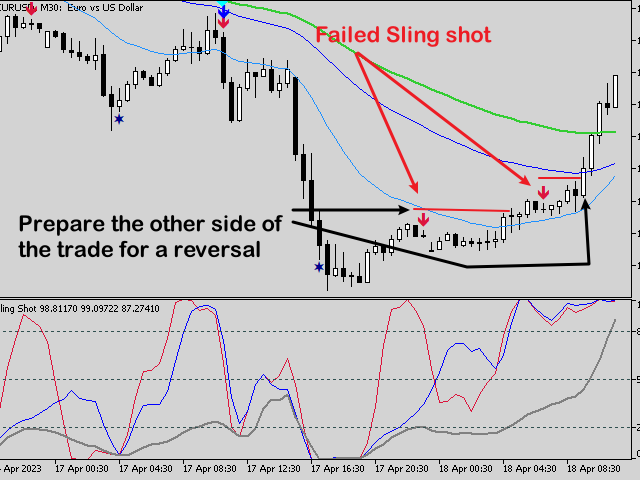
Example of Sling Shot trade idea:
- Price line sets the mood, below the baseline level (50) we look for selling opportunities.
- Fast line, Slow line or both (Dual) indicate a pullback to the opposite extreme level, provided the price line remain below 50.
- Improve your results by trading in the direction of the prevailing trend.
Example of Pinch trade idea:
- All three bands pinch together at the set pinch level.
- Mean reversion type trade idea.
- Trade back to a 20 or 50 EMA for a scalp.
- Use the pinch setting to take profit or partial close on your sling shot entries.
- Use prior lows, highs as profit targets.