Hull Volume and Linear Weighted Moving Average

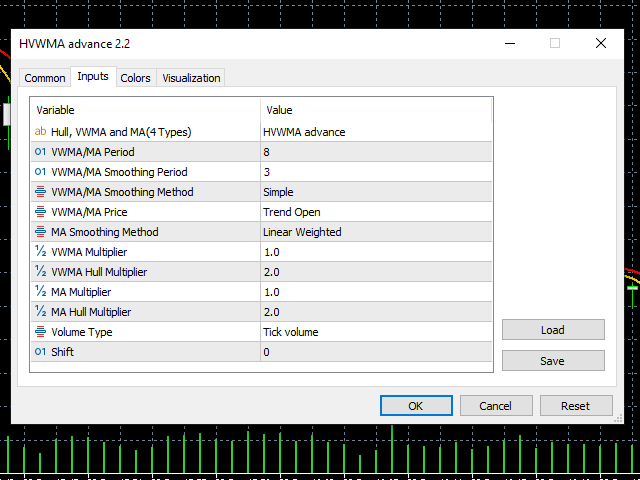
Update 2.0: Added the option to change LWMA to the other 3 basic MA modes. I also added Smoothing to it, to tame it a bit. You can input 1 as smoothing period and no smoothing will be applied.
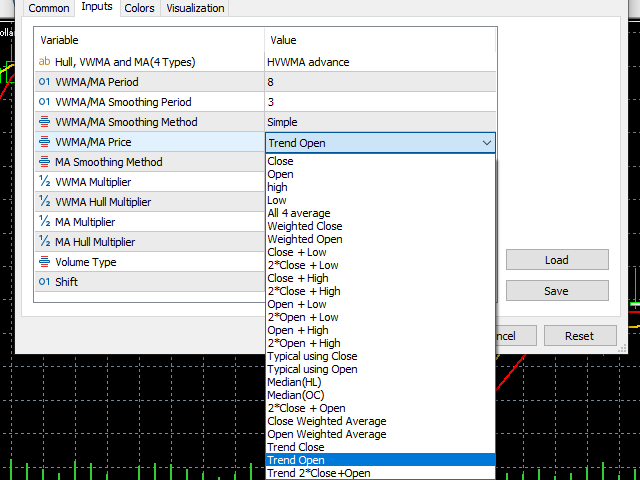
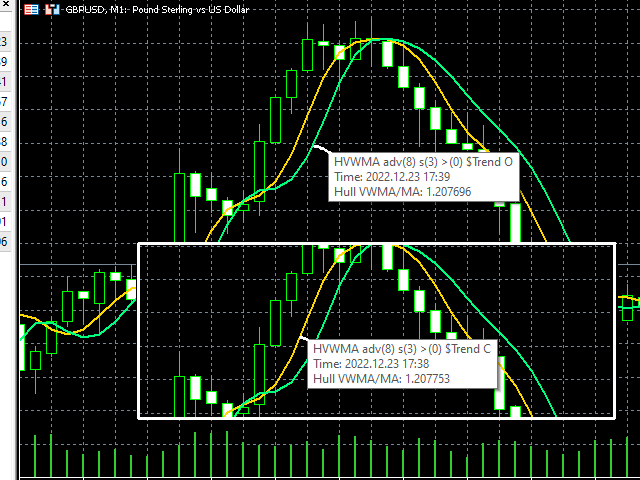
Update 2.1: Removed Trend Typical Open/Close as is was the same behavior as Trend Open/Close. Trend follow works by averaging the high/low with close/open. If Close is above Open, Trend Close = Close+High/2, averaging between close and high, and when Close drops below Open, it's calculation automatically switches to Close+Low/2. Faster crossovers and accurate reversal watch is the aim here. Think of it like Order flow reversals, with tick or real volumes, if desired.

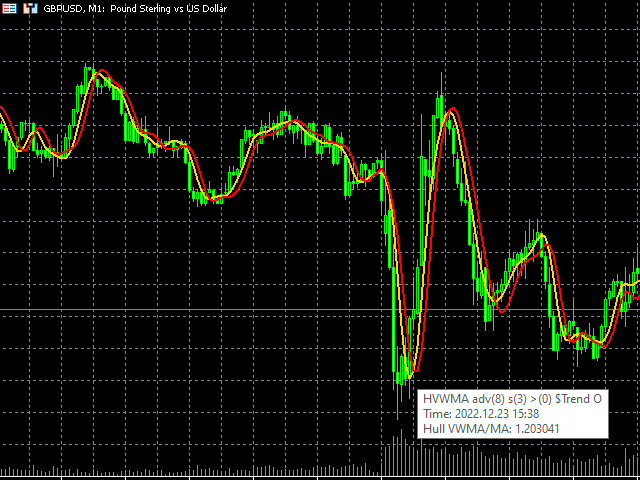
This indicator is a combination of 4 separate moving averages you can combine in any ratio you like. I have also created extra price combinations I wanted to try out, specifically for OHCL strategies, crossovers, trend following, etc.

You can combine and multiply these 4 Moving Averages: MA(4 types), Hull calculated MA(4 types , VWMA aka Volume Weighted Moving Average, and Hull calculated VWMA. You can use Real Volume or Tick Volume, as well, not just Tick, if your Broker provides that data.

Can be used to follow price action a lot easier, I feel, if using Trend Close and Trend Open Crossovers and verify line positions on higher timeframes. Test it out in an indicator backtest! Note: some of the price combinations have proven more useful than the stock ones, while some have not, but the options are still available to you.  Probably the first indicator to feature so many price combination choices.


Price to increase 25% after 10 purchases. 

https://c.mql5.com/31/817/Trend_Open_and_Close_screenshot.png
推荐产品
Noize Absorption Index
Ekaterina Saltykova
Noize Absorption Index - is the manual trading system that measures the difference of pressure between bears forces and bulls forces. Green line - is a noize free index that showing curent situation. Zero value of index shows totally choppy/flat market.Values above zero level shows how powerfull bullish wave is and values below zero measures bearish forces.Up arrow appears on bearish market when it's ready to reverse, dn arrow appears on weak bullish market, as a result of reverse expectation.
Pro Gold System Indicator
PEDRO JOAQUIM GONCALVES GOMES
ADVANCED FUNCTIONALITIES: Trend Score (0-100) with visual bar Intelligent signals with adjustable strength (1-10) Risk management with automatic TP/SL Audible and visual alerts Price zones with smooth filling Multi-indicator analysis (RSI, ATR, BB, EMAs) DESIGN FEATURES Modern Visual: Smooth and well-spaced lines (EMA with 2-3px width) Vibrant and professional colors (Sky Blue, Orange, Gold) Modern arrows (code 233/234) for buy/sell signals Configurable dark/light theme Adjustable transparency f
HMA Trend Professional MT5
Pavel Zamoshnikov
4.25 (4)
Improved version of the free HMA Trend indicator (for MetaTrader 4) with statistical analysis. HMA Trend is a trend indicator based on the Hull Moving Average (HMA) with two periods. HMA with a slow period identifies the trend, while HMA with a fast period determines the short-term movements and signals in the trend direction. The main differences from the free version: Ability to predict the probability of a trend reversal using analysis of history data. Plotting statistical charts for analyzi
RBreaker
Zhong Long Wu
RBreaker Gold Indicators 是黄金期货一种短线日内交易策略,它结合了趋势跟踪和日内反转两种交易方式,既能捕捉趋势行情的利润,又能在行情反转时及时止盈并顺势反手。 该策略曾连续15年被美国《Futures Truth》杂志评选为前十大最赚钱的交易策略之一,具有很长的生命周期,至今仍在国内外普遍使用与研究。 本指标结合了2026年期货黄金的走势,依据14日ATR指标,分别定义了突破系数A,观察系数B,反转系数R更合理的数值,非常不错的指标,已实现年稳定盈利,值得推荐~ 以上指标适合高波动品种,参数适合期货黄金,股指期货等,如果需要其他品种行情,需要单独设定 突破系数A,观察系数B,反转系数R,进行回测才能使用。 欢迎指标售后有问题可以加+V:504282029
RSI Currency Strength Meter is a powerful and elegant multi-currency indicator that measures the real-time relative strength of the 8 major currencies using RSI logic. By calculating the smoothed performance of each currency across its major pairs and applying the RSI formula, it delivers clean and responsive strength lines that make it easy to spot which currencies are truly strong or weak at any moment. This indicator is particularly useful for visualizing currency correlations and divergence
Fibo Channels
Jeffrey Quiatchon
Fibo Daily Channel Indicator The  Indicator is a powerful tool for traders, providing precise daily support and resistance levels based on Fibonacci retracement and extension calculations. This indicator automatically draws key pivot points (PP, R1, R2, S1, S2) as well as additional extension levels (R3, R4, S3, S4), helping traders identify potential reversal and breakout zones with ease. It includes customizable alerts and push notifications, allowing traders to receive updates whenever the pr
Laguerre SuperTrend Clouds   adds an Adaptive Laguerre averaging algorithm and alerts to the widely popular SuperTrend indicator. As the name suggests,   Laguerre SuperTrend Clouds (LSC)   is a trending indicator which works best in trendy (not choppy) markets. The SuperTrend is an extremely popular indicator for intraday and daily trading, and can be used on any timeframe. Incorporating Laguerre's equation to this can facilitate more robust trend detection and smoother filters. The LSC uses the
Binary Options Assistant (BOA) Multi Currency Dashboard for Binary Options (MT5) . You can use any of the BOA Signals Indicators with the dashboard. Just change the BOA Signals Indicator Name in the dashboard settings to the indicator you want to get signals from. For example: CHILL. BLAZE:  BOA_BLAZE_Indicator_v1   Strategy :   BLW Online Trading Binary Options Strategy (3 Moving Average) LAVA:  BOA_LAVA_Indicator_v1   Strategy:   Lady Trader Binary Options Strategy (Bollinger Bands & Stochas
这个指标用于比较图表上的交易品种与其他几个所选交易品种之间的强弱相对关系。 根据每个交易品种基于相同基准日的价格走势进行比较,可以看到几条不同走向的趋势线,反映出几个不同交易品种之间的强弱关系,这样可以更清楚地了解市场的趋势。 例如,你可以在EURUSD图表上应用这个指标,将其与货币对EURJPY和EURGBP进行比较,看看哪个更强。 你需要为指标输入参数: 需要比较的几个交易品种的名称 您需要选择比较基准日期。 请注意,使用指标前应确保相关交易品种的历史数据已经下载。 免费模拟版本是: https://www.mql5.com/zh/market/product/63921 .............................................
Trend Reversal Scanner MT5
Reza Aghajanpour
5 (8)
**   All Symbols   x   All Timeframes   scan just by pressing scanner button ** Discount: The price is $50$, But now it is just $39, Limited time offer is active. *** Contact me  to send you instruction and add you in "Trend Reversal group" for sharing or seeing experiences with other users. Introduction: Trendlines are the most famous technical analysis in trading . Trendlines continually form on the charts of markets across all the different timeframes providing huge opportunities for traders
TRI Visualizer
Yoshimi Mon 三 Ura
TRI Visualizer MT5 – Thermodynamic Market Analysis Overview The TRI (Thermal Range Indicator) Visualizer Enhanced is a rare market analysis indicator that goes beyond conventional technical analysis, applying principles of thermodynamics from physics. It interprets market price fluctuations as “thermodynamic energy,” enabling the highly accurate detection of subtle market changes that are often overlooked. Innovative Mechanisms 1. Dual Calculation Engines Classic TRI Mode Formula: |Close
Volume Profile V6
Andrey Kolesnik
4.67 (3)
市场的成交量曲线指标+一个智能振荡器. 它适用于几乎所有工具-货币对,股票,期货,加密货币,实际交易量和报价。 您可以设置配置文件范围的自动定义,例如,一周或一个月等。,并通过移动边界(两条垂直线红色和蓝色)手动设置范围。 示为直方图。 此级别直方图的宽度有条件地意味着在其上进行的交易数量。 使用"模式水平线颜色"参数,您可以设置自动显示价格可能会击退的最重要交易量水平,而最大颜色参数则分别显示整个设定范围内最大交易量的水平。     智能振荡器显示超买和超卖区域,它分析来自多个指标的信息,并根据处理的数据,以适当的颜色为超买和超卖区域着色。     在Volume every day中,您可以使用Range period参数设置构建配置文件的时间范围,并使用Range count参数设置这些范围的配置文件数量。 例如,Range period=1day,Range count=10表示配置文件将基于一天的周期,即最后十天。 重要的是,切换图表的时间框架不会影响配置文件的构建,这也是该指标的一个额外优势。      该指标非常简单易用,同时尽可能提供信息。 有了这个指标,做市商将
CosmiCLab FIBO
Kirils Subins
CosmiCLab SMC FIBO CosmiCLab SMC FIBO is a professional trading indicator designed for traders who use Smart Money Concepts (SMC), market structure analysis and Fibonacci retracement levels. The indicator automatically detects market swings and builds Fibonacci levels based on the latest impulse movement. It also identifies market structure changes such as BOS (Break of Structure) and CHOCH (Change of Character), helping traders understand the current market direction. CosmiCLab SMC FIBO also pr
Stratos Pali mt5
Michela Russo
4.5 (8)
Stratos Pali Indicator is a revolutionary tool designed to enhance your trading strategy by accurately identifying market trends. This sophisticated indicator uses a unique algorithm to generate a complete histogram, which records when the trend is Long or Short. When a trend reversal occurs, an arrow appears, indicating the new direction of the trend. Important Information Revealed Leave a review and contact me via mql5 message to receive My Top 5 set files for Stratos Pali at no cost ! Down
An indicator of pattern #31 ("Long Island") from Encyclopedia of Chart Patterns by Thomas N. Bulkowski. The second gap is in the opposite direction. Parameters: Alerts - show alert when an arrow appears   Push - send a push notification when an arrow appears (requires configuration in the terminal) GapSize - minimum gap size in points ArrowType - a symbol from 1 to 17 ArrowVShift - vertical shift of arrows in points   ShowLevels - show levels ColUp - color of an upward line ColDn - color of a d
# 回撤指标 V4.0 - 掌控交易的必备工具 ## 通过完整的实时绩效概览改变您的交易 在要求严苛的外汇和差价合约交易世界中,**了解您的实时绩效**不是奢侈品,而是**绝对必需**的。**回撤指标 V4.0** 不仅仅是一个简单的指标:它是您的**专业仪表板**,为您提供清晰、精确和即时的交易账户状态视图。 --- ## 为什么这个指标将永远改变您的交易 ### 90% 交易者面临的问题 您是否曾经遇到过以下情况之一? **您不确切知道自己的状况** - 您的 MT5 平台显示数字,但您必须心算您的真实表现。 **您发现回撤为时已晚** - 当您意识到已经损失了 15% 的资金时,已经太晚了,无法有效应对。 **您缺乏历史可见性** - 无法快速知道本周、本月或今年是否盈利。 **您浪费时间分析交易** - 您必须打开多个窗口、进行计算,并失去对市场的关注。 **您没有概览** - 有多少持仓?我的全局盈亏是多少?我今天的表现如何? ### 解决方案:一体化专业仪表板 **回撤指标 V4.0** 通过提供一个**完整的控制面板*
Price manipulation risk
Vincent Albert Feugier
Price Manipulation Risk Indicator Advanced Tool for Market Risk Evaluation & Manipulation Detection Price Manipulation Risk Indicator is a professional tool designed to measure the current risk level in the market. It evaluates price behavior, market activity, and candle dynamics to detect unstable or potentially manipulated environments. This indicator helps traders avoid traps , filter false signals , and improve timing in both entries and exits. Product Purpose Provide an immediate a
SMC Venom 模型 BPR 指標是針對在智慧貨幣 (SMC) 概念內工作的交易者的專業工具。它會自動辨識價格圖表上的兩種關鍵模式: FVG (公平價值缺口)是三根蠟燭的組合,其中第一根和第三根蠟燭之間存在缺口。它在水平之間形成一個沒有成交量支撐的區域,這通常會導致價格調整。 BPR (平衡價格區間)是兩種 FVG 模式的組合,形成一個「橋樑」 - 當價格以低成交量活動移動時,突破並返回到水平的區域,從而在蠟燭之間產生間隙。 這些模式可協助交易者透過分析圖表上的交易量和價格動態(大型市場參與者和普通參與者之間的互動)來識別關鍵的支撐/阻力位、突破區域和切入點。 此指標以矩形和箭頭的形式可視化模式,也支援靈活的警報設定。 主要特點: 模式顯示模式:選擇顯示 BPR 模式(看漲和看跌)或 FVG 模式(看漲和看跌)。 可以隱藏所有圖表分析模式。 以條數過濾:BPR 結構中 FVG 之間的最小/最大距離。 訊號的附加視覺化: 箭頭有 9 種類型可供選擇(標準、細、分形等)或手動輸入 Wingdings 代碼,其表格可以選擇性地顯示在圖表上。 設定顏色、尺寸及其縮放時相對於價格的動態
Rainbow EA MT5
Jamal El Alama
Description : Rainbow EA MT5 is a simple Expert advisor based on   Rainbow MT5 indicator witch is based on Moving average with period 34. The indicator is incorporated in the EA, therefore, it is not required for the EA to operate, but if you wish, you can download it from   my product page . The Expert Advisor settings are as follows : Suitable for Timeframes up to H1 The parameters below can be set according to your trading rules. StopLoss ( Stop Loss in pips) TakeProfit ( Take Profit in pips
Episode Health Monitor Episode Health Monitor is a trading utility for MetaTrader 5 designed to analyze the real-time condition of active trading positions directly on the chart. The tool evaluates the current “trading episode” - a group of open positions - and provides a structured view of risk, stability, and distance to potential failure. Instead of relying only on profit/loss or price movement, it helps identify whether the current position is stable, weakening, or approaching a critical st
Step into the world of Forex trading with confidence, clarity, and precision using Gold Indicator a next-generation tool engineered to take your trading performance to the next level. Whether you’re a seasoned professional or just beginning your journey in the currency markets, Gold Indicator equips you with powerful insights and help you trade smarter, not harder. Built on the proven synergy of three advanced indicators, Gold Indicator focuses exclusively on medium and long-term trends elimina
Volality Index Scalper
Lesedi Oliver Seilane
5 (1)
Volality Index scalper indicator  Meant for Volality pairs such as Volality 10, 25, 50, 75 and 100 The indicator works on all timeframes from the 1 minute to the monthly timeframe the indicator is non repaint the indicator has 3 entry settings 1 color change on zero cross 2 color change on slope change 3 color change on signal line cross Orange line is your sell signal Blue line is your buy signal.
MultiTimeframe Support and Resistance Zones
Mohamed Gamal Abdelnasser Yous Hashesh
A powerful indicator that highlights key market zones and helps traders identify potential opportunities across multiple timeframes. Designed for clarity and efficiency, it provides real-time alerts to keep you informed of important price levels. Key Features: Works on multiple timeframes: M1, M5, M15, M30, H1, H4, D1, W1, MN1. Customizable zone colors for each timeframe. Real-time alerts and notifications when price reaches significant zones. Automatically manages chart objects to keep your wor
"Impulses and Corrections 5" is created to help traders navigate the market situation. The indicator shows multi-time frame upward and downward "Impulses" of price movements. These impulses are the basis for determining the "Base" , which is composed of zones of corrections of price movements, as well as "Potential" zones for possible scenarios of price movement. Up and down impulses are determined based on a modified formula of Bill Williams' "Fractals" indicator. The last impulse is always "U
首先,值得强调的是,这个交易工具是非重绘、非重画和非滞后的指标,非常适合专业交易。 在线课程,用户手册和演示。 智能价格行动概念指标是一个非常强大的工具,既适用于新手,也适用于经验丰富的交易者。它将超过20个有用的指标合并到一个指标中,结合了高级交易思想,如内圈交易员分析和智能资金概念交易策略。该指标侧重于智能资金概念,提供有关大型机构交易方式的见解,帮助预测它们的动向。 它在流动性分析方面尤其擅长,有助于理解机构的交易方式。它擅长预测市场趋势,并仔细分析价格波动。通过将您的交易与机构策略对齐,您可以更准确地预测市场走向。该指标多才多艺,擅长分析市场结构,识别重要的订单区块,并识别各种模式。 它擅长识别BOS和CHoCH等模式,理解动量的转变,并突出显示供需强劲的关键区域。它还擅长发现强大的不平衡,并分析价格创造更高高点或更低低点的模式。如果您使用斐波那契回撤工具,该指标可以满足您的需求。它还可以识别相等的高点和低点,分析不同的时间框架,并通过仪表板显示数据。 对于使用更高级策略的交易者,该指标提供了工具,如公平价值差指标和优惠和折扣区域的识别。它特别关注高时间框架订单区块,并
Introduction The "Two Moving Average Crossover" indicator for MetaTrader 5 (MT5) is a technical analysis tool that displays two moving averages and notifies when the moving averages cross each other. The indicator calculates and plots two moving averages, one of which is faster and the other is slower. When the faster moving average crosses above the slower moving average, it is considered a bullish signal, indicating a potential trend reversal or the start of a new uptrend. Conversely, when th
用於確定平面和趨勢的指標。 如果價格低於兩條直方圖和兩條線(紅色和藍色)中的任何一條,則這是一個賣出區域。 購買此版本的指標時,一個真實賬戶和一個模擬賬戶的 MT4 版本 - 作為禮物(收到,給我寫私信)! 如果價格高於兩條直方圖和兩條線(紅色和藍色)中的任何一條,則這是一個買入區域。 MT4 版本: https://www.mql5.com/en/market/product/3793 如果價格在兩條線之間或在任何直方圖的區域內,那麼市場就沒有明確的趨勢。簡單地說,市場是平的。 指標的工作在屏幕截圖中更清楚地顯示。 該指標可用作獨立的交易系統。該指標可用於獲取領先數據或確定當前趨勢的方向。對於任何級別的交易者來說,這都是一個很好的工具!
Crypto_Forex 指标 PINBAR 模式适用于 MT5,无需重绘,无延迟。 - “PINBAR 模式”指标是一款非常强大的价格行为交易指标。 - 指标可检测图表上的 PinBar: - 看涨 PinBar - 图表上显示蓝色箭头信号(见图)。 - 看跌 PinBar - 图表上显示红色箭头信号(见图)。 - 支持电脑和移动设备提醒 。 - “PINBAR 模式”指标非常适合与支撑/阻力位结合使用。 ................................................................................. 点击这里查看高质量的交易机器人和指标! 本产品为独家产品,仅在本 MQL5 网站上提供。
Trading Utility for Forex Currency Pairs Only not for Gold  Functions Auto Lot Calculation based on Risk Auto stoploss  Auto TakeProfit Breakeven Auto Close Half % Close in percentage with respect to the PIPs Pending Orders BuyLimit Sell Limit with distances BuyStop Sell Stop    with distances Trading Informations Risk in percentage For Multiple trades Combine Takeprofit and Combine Stoplosses
该产品的买家也购买
SuperScalp Pro
Van Minh Nguyen
5 (14)
SuperScalp Pro – 高级多重过滤剥头皮指标系统 SuperScalp Pro 是一款高级剥头皮指标系统,将经典 Supertrend 与多重智能确认过滤器相结合。该指标在 M1 到 H4 的所有时间框架上均运行良好,尤其适用于 XAUUSD、BTCUSD 及主要外汇货币对。可作为独立系统使用,也可灵活整合到现有交易策略中。 指标集成超过 11 个过滤器,包括快慢 EMA、用于趋势判断的三条 EMA、EMA 斜率 (EMA slope)、RSI、ADX、成交量、VWAP、布林带突破(Bollinger Bands Breakout)以及 MACD 背离过滤器。智能蜡烛过滤器用于确认蜡烛收盘并剔除弱信号,而以三条 EMA 结合 MACD 背离的趋势识别机制则有助于筛选出更高胜率的交易信号。 SuperScalp Pro 基于 ATR 自动计算进场(Entry)、止损(Stop Loss)和止盈(Take Profit)水平。所有重要价格水平均直接显示在图表上,方便用户管理风险并做出更精准的交易决策。 系统在超过 5,000 根蜡烛上进行模拟与性能分析,展示完整指标如胜率、总交
Azimuth Pro
Ottaviano De Cicco
5 (6)
上市促销 Azimuth Pro 前100位买家特惠价 299 美元。最终价格为 499 美元。 散户与机构入场的区别不在于指标,而在于位置。 大多数交易者在任意价格水平入场,追逐动量或对滞后信号做出反应。机构投资者等待价格到达供需真正转换的结构性水平。 Azimuth Pro 自动映射这些水平:波段锚定VWAP、多时间框架结构线,以及仅在高概率位置出现的ABC形态。 Azimuth Pro 专为需要结构分析和智能自动化的专业交易者打造。 Azimuth 以外科手术般的精度映射市场结构,而Azimuth Pro增加了智能层:自动检测您的交易风格、智能配置的移动平均线,以及经过20年数据回测优化的参数。结果是专业级分析自动适应您的交易品种和时间框架。 这是我们Merkava Labs每天为自己和客户使用的指标。 PRO版本的独特之处 智能配置 Pro版本理解您的交易环境。将它放在EURUSD M15上,它知道您在做日内交易。放在BTCUSD H4上,它会调整为波段交易。无需手动调整。 自适应移动平均线 标准EMA有效。但ATR自适应StepMA(响应波动率)和动
Divergence Bomber
Ihor Otkydach
4.9 (86)
购买该指标的每位用户将额外免费获得以下内容: 原创工具“Bomber Utility”,该工具会自动跟踪每一笔交易,设置止损和止盈点,并根据策略规则自动平仓; 适用于不同交易品种的指标设置文件(Set 文件); 三种不同风险模式下的 Bomber Utility 设置文件:“最低风险”、“平衡风险” 和 “观望策略”; 一套详细的 视频操作手册,帮助您快速完成安装、配置并开始使用本交易系统。 注意: 要获取以上所有赠品,请通过 MQL5 的私人消息系统联系卖家。 我为您介绍原创的自定义指标 “Divergence Bomber”(背离轰炸机),它是一套基于 MACD 背离交易策略 的“全功能”交易系统。 该技术指标的主要任务是识别 价格与 MACD 指标之间的背离,并发出交易信号(包括推送通知),指示未来价格可能的运动方向。平均而言,这些信号的准确率超过 98%。有关该指标如何工作的详细说明,请观看本页面上的视频演示。 该系统使用 止损订单 和 动态回撤平仓机制 来管理交易。 Divergence Bomber 指标的主要特点: 支持交易的品种: AUDCAD、AUDCHF、AUDSG
Entry In The Zone and SMC Multi Timeframe is a real-time market analysis tool developed based on Smart Money Concepts (SMC). It is designed to analyze market structure, price direction, reversal points, and key zones across multiple timeframes in a systematic way. The system displays Points of Interest (POI) and real-time No Repaint signals, with instant alerts when price reaches key zones or when signals occur within those zones. It functions as both an Indicator and a Signal System (2-in-1), c
CGE Trading Suite
Carl Gustav Johan Ekstrom
5 (1)
CGE Trading Suite delivers the analytical edge typically reserved for professional trading desks. The platform integrates a full suite of analytical tools into one seamless workflow: dynamic grid mapping, liquidity behavior analysis, ECM, trend lines, MIDAS, trade cycles, and directional channel projections. Together, these provide a unified view of market structure and momentum. Directional clarity is further enhanced by the capital flow index, which measures currency basket strength to identif
RelicusRoad Pro MT5
Relicus LLC
5 (24)
RelicusRoad Pro: 量化市场操作系统 终身访问限时 70% 折扣 - 加入 2,000+ 交易员社区 为什么大多数交易者即使拥有“完美”指标也会失败? 因为他们在真空中交易 单一概念 。没有背景的信号是赌博。要持续获胜,您需要 共振 (CONFLUENCE) 。 RelicusRoad Pro 不是一个简单的箭头指标。它是一个完整的 量化市场生态系统 。它描绘价格运行的“公允价值之路”,区分市场噪音和真实的结构性突破。 停止猜测。开始用机构级“路”逻辑进行交易。 核心引擎:“Road” (路) 算法 系统的核心是 Road Algo ,一个实时适应市场条件的动态波动率通道。它投射出 安全线 (平衡) 和价格可能反转的 扩展水平 。 Simple Road: 典型市场的标准结构映射。 Smooth Road: 针对震荡盘整的降噪计算。 Breakout Road: 专为识别波动率扩张和爆发性走势而调整。 1. 算法动量与确认 我们的“剥头皮箭头”不只是简单的交叉。它们利用 高阶多项式逻辑 过滤噪音,确保信号与主周期一致。我们检测动量、价格行为和 Road 结构汇聚的精确入场
购买此指标即可免费获得我的专业交易管理器。 首先,值得强调的是,这个交易系统是一个非重绘、非重画和非滞后的指标,这使得它非常适合手动和机器人交易。 在线课程,手册和下载预设。 “智能趋势交易系统 MT5”是专为新手和经验丰富的交易者量身定制的综合交易解决方案。它结合了超过 10 个优质指标,具有 7 多个强大的交易策略,使其成为适用于各种市场条件的多功能选择。 趋势跟随策略:提供精确的入场和止损管理,以有效地跟随趋势。 反转策略:识别潜在的趋势反转,使交易者能够利用区域市场的机会。 剃头策略:专为快速准确的日内交易和短期交易而设计。 稳定性:所有指标都不会重绘、不会重画和不会滞后,确保可靠的信号。 定制:支持自定义策略,以满足个人交易偏好。超过 7 种策略和组合可帮助您找到最佳策略。 信号清晰度:提供箭头信号,以指示清晰的入场和退出点。 实时警报:通过交易进出警报使交易者保持了解。 深入分析:提供更高时间框架的趋势分析和实时交易监控。 自适应颜色编码:利用蜡烛颜色编码来显示成交量、趋势和反转蜡烛信号。通过蜡烛颜色分析市场方向。 “智能趋势交易系统 MT5”赋予交易者必要的工具,以便在
FX Trend MT5 NG
Daniel Stein
5 (4)
FX Trend NG:新一代多市场趋势智能分析工具 概述 FX Trend NG 是一款专业的多时间周期趋势分析与市场监控工具,帮助您在几秒钟内全面了解市场结构。 无需在多个图表之间来回切换,您可以立即看到哪些品种处于趋势中、哪里动能正在减弱,以及哪些时间周期之间存在强烈共振。 限时发布优惠 – 仅需 $30(6个月) 或 $80 终身授权 即可拥有 FX Trend NG 。 已经是 Stein Investments 客户? -> 发送消息 以获取专属客户群访问权限。 需要帮助或安装指导? -> 请访问 Stein Investments 官方页面 。 1. FX Trend NG 的核心优势 三状态趋势逻辑 —— 不只是 Buy 或 Sell • 大多数指标仅显示两种状态:Buy 或 Sell。 • FX Trend NG 增加第三种状态: Fade 。 • Fade 表示趋势强度正在减弱,在完全反转之前提前发出信号。 这种结构化逻辑让您看到趋势变化过程,而不仅仅是简单方向信号。 多时间周期分析(M1 至 MN1) • 从短线交易到中长线交易全面覆盖。 • 快速识别趋势
Power Candles MT5
Daniel Stein
5 (6)
Power Candles – 适用于所有市场的基于强度的入场信号 Power Candles 将 Stein Investments 经过验证的强度分析直接带入价格图表。与仅对价格作出反应不同,每一根蜡烛都基于真实的市场强度进行着色,使交易者能够立即识别动能累积、强度加速以及清晰的趋势转换。 一套逻辑,适用于所有市场 Power Candles 可自动适用于 所有交易品种 。该指标会检测当前品种是否为外汇货币对或非外汇市场,并在内部自动应用相应的强度模型。 外汇与黄金 使用 FX Power Delta 数值(绝对范围最高至 100) 指数、加密货币和 CFD 使用 IX Power 强度数值(绝对范围最高至 50) 所需的强度计算已直接嵌入 Power Candles。本指标在蜡烛着色和信号逻辑方面无需额外安装任何其他指标。 以强度状态替代价格噪音 每根蜡烛都会被归类为九种清晰定义的强度状态之一: 中性 轻度、中度、强烈、极端空头 轻度、中度、强烈、极端多头 这种基于状态的方法能够过滤随机的价格波动,专注于有意义的市场参与行为。它帮助交易者识别新的方向性阶段正在形成,而不是对单根蜡
Power Bar MT5
Daniel Stein
在冒真金白银之前, 先看看哪种策略真正适合你的品种。 Power Bar 可在任何品种和任何时间周期上检测 极端价格K线 , 然后即时回测3种不同的交易策略, 让你并排比较胜率、盈亏比和收益。全部集成在一个交互式面板中。 无需猜测。无需过度拟合。只看数据。 Power Bar 有何独特之处? 大多数指标只给你一个信号, 让你猜测它是否有效。Power Bar 更进一步: 它用 三种策略 测试每个信号并展示统计数据。一键切换 FlipFlop、Momentum 和 Reversal, 即刻看到数据变化。 FlipFlop - 始终持仓。信号入场, 反向信号出场。我们的研究表明, 这在 US30、US500 和 DAX 等趋势性指数上效果最佳。 Momentum - 顺信号方向交易。基于 ATR 的固定 SL/TP。适用于趋势延续形态的均衡方法。 Reversal - 逆信号交易(反向操作)。我们的回测显示, 在 JPY 外汇交叉盘上胜率超过 70%, 因为极端K线标志着衰竭而非延续。 更改参数, 即时查看结果 无需打开指标属性。直接在面板中通过 +/- 按钮调整 ATR 倍数、周期、
Trend Screener Pro MT5
STE S.S.COMPANY
4.84 (103)
使用趋势筛选指标释放趋势交易的力量:由模糊逻辑和多货币系统提供支持的终极趋势交易解决方案! 使用趋势筛选器(由模糊逻辑提供支持的革命性趋势指标)提升您的趋势交易。 它是一个强大的趋势跟踪指标,结合了超过 13 种高级工具和功能以及 3 种交易策略,使其成为使您的 Metatrader 成为趋势分析器的多功能选择。 限时优惠:趋势筛选指标终身仅需 50 美元。 ( 原价 250$ ) (优惠延长) 体验趋势筛选器 100% 无需重新绘制的准确性,确保您的交易决策不受过去价格变化的影响。 释放多时间框架和多货币功能的多功能性,使您能够以无与伦比的信心在外汇、商品、加密货币和指数领域进行交易。 利用 Trend Screener 的综合策略套件增强您的交易: - 趋势跟踪策略和趋势延续策略 :趋势筛选器的趋势跟踪策略提供清晰的趋势延续信号,让您有效捕捉趋势走势并管理风险。 - 反转策略和早期入场点策略 :趋势筛选器的反转策略可检测市场方向的潜在变化,使您能够预测趋势反转并利用疲弱的市场趋势。通过早期入场点,您可以在潜在的趋势变化之前定位自己 获取可观的利润。 - 倒卖策略: 趋势筛选器的倒卖
Atomic Analyst MT5
Issam Kassas
3.94 (31)
首先值得强调的是,该交易指标是非重绘、非延迟的指标,这使其成为手动和机器人交易的理想选择。 用户手册:设置、输入和策略。 Atomic Analyst是一种PA价格行动指标,利用价格的力量和动量来寻找市场上更好的机会。配备了高级过滤器,可帮助去除噪音和假信号,并提高交易潜力。使用多层复杂的指标,Atomic Analyst扫描图表,并将复杂的数学计算转化为任何初学者都能理解并用来做出一致交易决策的简单信号和颜色。 “Atomic Analyst”是专为新手和经验丰富的交易者量身定制的综合交易解决方案。它将高级指标和一流功能融合为一体的交易策略,使其成为所有类型交易者的多功能选择。 日内交易和剥头皮策略:专为快速准确的日内交易和短期交易而设计。 日内和摆动交易策略:可用作追求价格大幅波动的日内和摆动交易者的可靠工具。 多货币和市场:凭借其可靠的精度,在不同的工具和市场上运作。 多个时间框架:可在多个时间框架上使用,性能良好。 稳定性:所有指标均不重绘、不重绘和不滞后,确保可靠的信号。 信号清晰度:提供箭头信号,用于清晰的入场和出场点。 实时警报:通过交易入场、SL和TP警报通知交易者
Currency Strength Dashboard Pro
Anastasia Danilova
5 (1)
Currency Strength Dashboard Pro 适用于 MetaTrader 5 的专业级实时货币强度分析面板。 该指标同时对 8 种主要货币 (EUR、USD、GBP、JPY、CHF、AUD、CAD、NZD)进行强度计算,并基于 28 个货币对 在多个时间周期上进行分析和显示。 该面板让交易者能够 一眼看清整个市场状况 —— 无需额外计算,也无需在多个图表之间切换。 计算方法 该指标基于一种 先进的数学货币强度计算方法 ,相比许多类似指标常用的 RSI 方法 ,具有更高的准确性和客观性。 该方法同时分析 全部 28 个货币对之间的关系 ,从而提供更清晰、更无偏差的市场真实强弱对比。 实时分析面板 主表格显示 8 种货币 的完整数据: Rank(排名) — 按整体强度排序, 1 为最强,8 为最弱 。 Strength(强度) — 当前货币强度的数值。 Change(变化) — 与上一根K线相比的强度变化。 Slope(斜率) — 强度趋势方向:上升、下降或横盘。 时间周期数据(M15、H1、H4、D1) — 各时间周期的独立强度值。 Composite(综合值) —
HFT Spike Detector
OMG FZE LLC
5 (2)
[ My Products ] , [ My Channel ]   ,  [ LIVE SIGNAL ] HFT Spike Detector HFT Spike Detector 是一款专业的 tick 监控工具,旨在实时分析和测量高频交易(HFT)引发的价格剧烈波动。 其目标是通过数值数据帮助您识别由经纪商引起的异常滑点、流动性缺口以及毫秒级价格跳动。 由于它分析的是实时逐笔数据流和订单执行条件,因此无法通过回测进行准确评估。 您可以购买此EA,并结合现成的参数设置文件(set文件)实现自动化: VolumeHedger EA 工作原理 该 Expert Advisor 会实时分析每一个传入的 tick 数据,并: 价格变化速度 每秒 tick 密度 滑点幅度 同方向微观流动 进行测量并以图表面板形式展示。 因此,您可以看到除点差之外的真实执行质量。 面板显示指标 Slippage 显示监控 tick 中的最大滑点值(以 points 为单位)。 用于检测突发流动性缺口和激进的价格跳动。 Avg Slippage 显示所有传入 tick 的滑点平均值(以 p
Meridian Pro
Ottaviano De Cicco
5 (1)
Meridian Pro:MT5专业多时间框架趋势矩阵 概览 Meridian Pro 是 Merkava Labs 推出的多时间框架趋势矩阵,将方向状态、强度、动量条件和矩阵一致性压缩到一个紧凑面板中。一个自适应引擎,从M1到W1一致应用。无需逐品种调参。无需堆叠指标。一个结构化读数覆盖所有资产和所有时间框架。 上市优惠 — Meridian Pro 优惠价 USD 99 (限时)。常规价格:USD 149 。 1. Meridian Pro 为何不同 一个引擎,而非互不相连的指标仪表盘 许多MTF仪表盘只是在各时间框架重复原始指标状态。Meridian Pro在整个矩阵中使用一个自适应趋势引擎,面板中的每一行都来自同一个结构化框架。这使其读取快速、使用简洁,在真实图表条件下实用。 合成时间框架架构 Meridian Pro不依赖常规的零售MTF方法,而是从 M1数据 构建统一的内部矩阵结构。无经典MTF同步问题。无因脆弱的高时间框架拼接导致的重绘或延迟。无因不稳定时间框架依赖导致的面板冻结。在不同高时间框架数据质量的经纪商之间具有更好的稳健性。 2. 面板显示内容 Bias — 每
FX Power MT5 NG
Daniel Stein
5 (31)
FX Power:分析货币强度,助您做出更明智的交易决策 概述 FX Power 是一款专业工具,帮助您全面了解主要货币和黄金在任何市场条件下的真实强度。通过识别强势货币用于买入,弱势货币用于卖出, FX Power 简化了交易决策,并帮助您发现高概率的交易机会。不论您是想跟随趋势还是通过极端的 Delta 值预测反转,这款工具都能完美适应您的交易风格。别再盲目交易——用 FX Power 让您的交易更加智慧。 1. 为什么 FX Power 对交易者极具价值 实时货币和黄金强度分析 • FX Power 实时计算并显示主要货币和黄金的相对强度,助您全面了解市场动态。 • 监控领先或落后资产,轻松识别值得交易的货币对。 全面的多时间框架视图 • 跟踪短期、中期和长期时间框架的货币和黄金强度,以便将您的交易策略与市场趋势保持一致。 • 无论是快进快出的短线交易还是更长期的投资策略, FX Power 都能为您提供所需的信息。 Delta 动态分析用于趋势和反转 • 极端 Delta 值常常预示反转机会,而平缓的 Delta 变化则确认趋势延续。 • 使用 Delta 分析,轻
Quantum TrendPulse
Bogdan Ion Puscasu
5 (22)
介绍 Quantum TrendPulse   ,这是一款终极交易工具,它将 SuperTrend   、   RSI 和 Stochastic 的强大功能整合到一个综合指标中,以最大限度地发挥您的交易潜力。该指标专为追求精准和效率的交易者而设计,可帮助您自信地识别市场趋势、动量变化以及最佳进入和退出点。 主要特点: 超级趋势整合: 轻松跟随当前的市场趋势并乘上盈利浪潮。 RSI 精度: 检测超买和超卖水平,非常适合把握市场逆转时机,可用作 SuperTrend 的过滤器 随机精度: 利用随机振荡在波动的市场中寻找隐藏的机会, 用作超级趋势的过滤器 多时间范围分析: 从 M5 到 H1 或 H4,在不同时间范围内关注市场动态。 可定制的警报: 当您的自定义交易条件得到满足时收到通知,这样您就不会错过任何交易。 无论您是新手还是经验丰富的交易员,   Quantum TrendPulse 都能为您提供所需的优势,帮助您增强策略并自信地进行交易。借助这一强大的指标,将洞察力转化为利润 — 掌控您的交易! ***购买 Quantum TrendPulse,即可免费获得 Quantum Tr
OmniSync Projection
Antonio-alin Teculescu
5 (1)
Chronos Fractal Engine is an innovative price projection indicator for MetaTrader 5, designed to transform your technical analysis by intelligently identifying and projecting historical price patterns. Built upon an advanced correlation algorithm and the fractal principles of the market, this powerful tool visualizes potential future price movements, giving you a unique edge in your trading decisions. What is Chronos Fractal Engine? At its core, the Chronos Fractal Engine employs a sophisticat
Gann Made Easy   是一个专业且易于使用的外汇交易系统,它基于使用先生理论的最佳交易原则。 W.D.江恩。该指标提供准确的买入和卖出信号,包括止损和获利水平。您甚至可以使用推送通知在旅途中进行交易。 购买后请联系我,即可免费获得交易指导和超棒的额外指标! 您可能已经多次听说过江恩交易方法。通常 Gann 的理论不仅对于新手交易者而且对于那些已经有一定交易经验的人来说都是非常复杂的东西。这是因为江恩的交易方法在理论上并不那么容易应用。我花了几年时间来完善这些知识,并将最好的原则应用到我的外汇指标中。 该指标非常易于应用。您所需要的只是将其附加到您的图表并遵循简单的交易建议。该指标不断进行市场分析工作并寻找交易机会。当它检测到一个好的入口点时,它会为您提供一个箭头信号。该指标还显示止损和获利水平。 换句话说,当您像先生一样进行交易时,该指标会为您提供最佳江恩建议。江恩亲自告诉你此时此刻该做什么。但最好的部分是您不需要了解任何有关江恩交易原则的知识,因为该指标会为您完成整个市场分析工作。
Btmm state engine pro
Garry James Goodchild
5 (3)
BTMM State Engine Pro is a MetaTrader 5 indicator for traders who use the Beat The Market Maker approach: Asian session context, kill zone timing, level progression, peak formation detection, and a multi-pair scanner from a single chart. It combines cycle state logic with a built-in scanner dashboard so you do not need the same tool on many charts at once. What it does Draws the Asian session range; session times can follow broker server offset or be set in inputs. Tracks level progression (L
介绍     Quantum Breakout PRO   ,突破性的 MQL5 指标,正在改变您交易突破区域的方式!由拥有超过13年交易经验的资深交易员团队开发,     量子突破 PRO     旨在通过其创新和动态的突破区域策略将您的交易之旅推向新的高度。 量子突破指标将为您提供带有 5 个利润目标区域的突破区域的信号箭头,以及基于突破框的止损建议。 它既适合新手交易者,也适合专业交易者。 量子 EA 通道:       点击这里 重要的!购买后请私信我领取安装手册。 建议: 时间范围:M15 货币对:GBPJPY、EURJPY、USDJPY、NZDUSD、XAUUSD 账户类型:ECN、Raw 或 Razor,点差极低 经纪商时间:GMT +3 经纪商:IC Markets、Pepperstone with Raw 和 Razor 的点差最低 规格: 不重漆! 最多 5 个建议利润目标区域 建议止损水平 可定制的盒子。您可以设置自己的 Box Time Start 和 Box Time End。 接触 如果您有任何疑问或需要帮助,请通过私人消息与我联系。
Grabber System MT5
Ihor Otkydach
4.83 (23)
向您介绍一款优秀的技术指标——Grabber,它是一套即开即用的“全包式”交易策略。 在一个代码中集成了强大的市场技术分析工具、交易信号(箭头)、提醒功能和推送通知。 每位购买该指标的用户还可免费获得以下内容: Grabber辅助工具:用于自动管理已开仓位 视频操作指南:逐步教学如何安装、设置和使用该指标进行交易 原创Set文件:可快速自动配置,帮助实现最佳交易效果 忘掉其他策略吧!只有Grabber能够真正激励你在交易中攀登新高峰! Grabber策略的主要特点: 交易周期:从M5到H4 适用资产:任意,但我推荐我亲自测试过的品种(GBPUSD、GBPCAD、GBPCHF、AUDCAD、AUDUSD、AUDSGD、AUDCHF、NZDUSD、NZDCAD、EURCAD、EURUSD、EURAUD、EURGBP、EURCHF、USDCAD、USDSGD) 交易时间:全天候 24/7 交易效果:我分享自己的真实交易结果,并在此教学如何操作: https://www.mql5.com/ru/market/product/134563?source=Site+Market+MT5+Indic
ARICoins
Temirlan Kdyrkhan
ARICoin is a powerful trading companion designed to generate high-probability entry signals with dynamic TP/SL/DP levels based on volatility. Built-in performance tracking shows win/loss stats, PP1/PP2 hits, and success rates all updated live. Key Features: Buy/Sell signals with adaptive volatility bands Real-time TP/SL/DP levels based on ATR Built-in MA Filter with optional ATR/StdDev volatility Performance stats panel (Success, Profit/Loss, PP1/PP2) Alerts via popup, sound, push, or email Cust
Bill Williams Advanced
Siarhei Vashchylka
5 (11)
Bill Williams Advanced is designed for automatic chart analysis using Bill Williams' "Profitunity" system. The indicator analyzes four timeframes at once. Manual (Be sure to read before purchasing) Advantages 1. Analyzes the chart using Bill Williams' "Profitunity" system. Signals are displayed in a table in the corner of the screen and on the price chart. 2. Finds all known AO and AC signals, as well as zone signals. Equipped with a trend filter based on the Alligator. 3. Finds "Divergence Bar
Smart Stop Indicator – 智能化止损逻辑,直接呈现在您的图表上 概述 Smart Stop Indicator 是为希望以清晰、系统、非情绪化方式设置止损的交易者量身打造的工具。它将经典的价格结构逻辑(更高的高点、更低的低点)与现代突破识别技术相结合,精准标记真正合理的止损位置。无论是趋势、盘整还是快速突破行情,指标都会在图表上直接显示最佳 SL 区域及其状态(“new”、“broken”、“valid”)并且现在新增 SL 与 %ADR 的距离显示。 亮点 基于市场结构的自动止损识别 • 根据市场结构与实时价格行为自动识别关键止损位置。 智能突破适应能力 • 能适应突破与快速方向变化,不会强迫过早调整止损。 SL %ADR 显示 • 显示止损距离占平均日波动范围 ADR 的百分比与 Smart Stop Scanner 完全一致帮助交易者即时识别紧密机会或已延伸的行情。 内置警报逻辑 • 当止损水平变为“new”、“valid”或“broken”时触发警报包含准确的状态切换与冷却逻辑。 破损级别的淡化显示 • 对于“broken”状态的方向、价格、S
Market Structure Order Block Dashboard MT5 是一款用于 MetaTrader 5 的 MT5 指标 ,专注于 市场结构 与 ICT / Smart Money Concepts: HH/HL/LH/LL 、 BOS 、 ChoCH ,并识别 Order Blocks 、 Fair Value Gaps (FVG) 、 流动性 (EQH/EQL、sweeps)、 交易时段 / Kill Zones ,内置 Volume Profile 与紧凑的共振评分仪表板。 重要说明: 这是一个 分析工具 。它不会下单,也不会管理仓位(不是 EA)。 买家赠品 购买后,您可以从我的商店中选择并获得 2 个赠品指标 (自选)。 如何领取赠品: 1) 在本产品页面留下真实评价。 2) 通过 MQL5 私信联系我,发送: BONUS MSOB + 您选择的 2 个指标名称 。 主要功能 市场结构: HH/HL/LH/LL 标注与 BOS / ChoCH 识别。 Smart Money 区域: 多空 Order Blocks 与关键 Fair Value Gaps
Crystal Heikin Ashi Signals
Muhammad Jawad Shabir
5 (1)
Crystal Heikin Ashi Signals - Professional Trend & Signal Detection Indicator Advanced Heikin Ashi Visualization with Intelligent Signal System for Manual & Automated Trading Final Price: $149 ---------> Price goes up $10 after every 10 sales . Limited slots available — act fast . Overview Crystal Heikin Ashi Signals is a professional-grade MetaTrader 5 indicator that combines pure Heikin Ashi candle visualization with an advanced momentum-shift detection system. Designed for both manual traders
RFI levels PRO MT5
Roman Podpora
3.67 (3)
该指标能够准确显示反转点和价格回落区域。     行业领军人物 。您能洞察新趋势的形成,并以最高的精准度做出决策,掌控每一笔交易。 VERSION MT4     -    与……结合时,展现其最大潜力     趋势线专业版   指标 该指标显示的内容: 新趋势开始时的反转结构和反转水平及其激活。 显示屏   获利了结   和   止损   风险回报比最低的水平     RR 1:2       。 具有智能减值逻辑的止损。 显示指定指标中两种趋势类型的反转形态。 指标: 根据     趋势线     (全球趋势变化) 潮流专业版     (趋势快速变化) 简单有效   扫描器   实时趋势(新增)。 多时间框架工具筛选。 展示   利润   在 LOGIC AI 信号之后。 以下列出今日走势积极的金融工具。(RB键) 能够为终端启用通知(警报)功能,并向移动设备推送通知。 逻辑人工智能     — 利用人工智能寻找最佳切入点。 只有在启用 MTF(多时间框架分析)模式时,该功能才可用。 兼容性。 当与趋势线指标结合使用时,该指标能发挥其最大潜力。 这     RFI LEVELS
Market Structure Patterns
Samuel Manoel De Souza
4.47 (19)
Available for   MT4   and   MT5 . Join the Market Structure Patterns channel to download materials available for study and/or additional informations. Related posts: Market Structure Patterns - Introduction Beyond Fancy Order Blocks: Using True Volumetric Analysis with Market Structure Patterns & Timeless Charts Market Structure Patterns   is an indicator based on   smart money concepts   that displays   SMC/ICT   elements that can take your trading decisions to the next level. Take advantage
Gold Sniper Scalper Pro
Ich Khiem Nguyen
3.78 (9)
Gold Sniper Scalper Pro 是一款专为检测 XAUUSD 上的 假突破 (false breakout)形态而构建的 MetaTrader 5 指标。它识别 4 根K线陷阱结构——价格突破区间边界、吸引突破交易者入场、然后反转回区间内部——确认该突破为虚假突破。指标通过 17 个质量因子对每个交易设置评分,经过 4 层汇流管道评估,对照 7 个时间框架趋势共识引擎验证,并通过黄金波动率状态分类器过滤——所有这些都在信号显示在图表之前完成。 详细的用户指南可在作者的   MQL5 博客   中找到。额外更新可通过作者的   MQL5 频道   获取。 根据当前的支持政策,购买者可能会获得作者开发的精选配套工具的额外使用权限。 该系统也适用于外汇货币对、指数和加密货币,但其检测参数、波动率处理和过滤器逻辑针对 XAUUSD 的特性进行了优化。 4 根K线假突破形态 检测引擎识别特定的四组件K线结构。Mother Bar 建立清晰的价格区间。一到三根 Inside Bar 在该区间内形成,压缩价格。False Breakout Candle 将价格推出边界——扫
作者的更多信息
Triple TRIX
Nicholas C Weber
Three Triple Exponential Average oscillators merged into one. Fast period will pull on the slower period, and the slower will smooth out the faster and avoid early positions. You can use 2 fast and 1 slow, or Fibonacci range or 2 slow, 1 fast. NOW FREE. But please consider supporting me by buying my 2 for sale indicators. You can use this as an entry indicator and exit indicator. Open when the tripleTRIX line crosses the zero line and close when it starts to reverse. When the peaks get bigger,
TVf Channel
Nicholas C Weber
I really like this indicator. But I made it, so of course I would.. NOW FREE. But please consider supporting me by buying my 2 for sale indicators. You can multiply the weight of each indicator used to give more emphasis on it's value when averaging between the 3. Boost fast TEMA and it can move the indicator faster. Boost slow FrAMA and watch it smooth out. I like to use them as open/close lines and set them up so they move quick, but have the FrAMA smooth it out more.  Check out my other indi
Tri CCI PreFiltered
Nicholas C Weber
This is 3 pre-filtered CCI, Commodity Channel Index, indicators pre-filtered by your choice of 3 Smoothing and/or Averaging methods. I have found certain settings to be very reliable and I plan to incorporate this into an Expert Advisor in the future. I have added a new form of Averaging: Smoothed TEMA, or Triple Smoothed EMA, Exponential Moving Average. It gives less noise than the TEMA, but provides the smoothing of the Double Smoothed EMA, so it should be a slight bit quicker. PLEASE Download
Binary Wave Advance
Nicholas C Weber
Update 2.2: Added MFI with predictive mod. Updated all indicators to reflect similar values, to combine multiple ones to rest well on overbought/oversold lines. Update 2.3: Minor bug fixes. Update 2.4: Removed buggy indicators DeMarker, and MACD, as it was too complicated and not as accurate as the rest due to it's nature. Added Awesome Oscillator. removed spreads, as it bogged the indicator down. Added other features, like indicator value compensators to match each other's levels when combined.
This is a Lite version of my Binary Wave Advance Oscillating indicator:  https://www.mql5.com/en/market/product/90734 Free for a limited time! It reduces the less useful indicators, while keeping it's predictive modifications to make each indicator within better than their stock counter part. I reduced it and made it simpler, in the hopes it would be less overwhelming and more approachable. Contains: ADX Chaikin Money Flow Index Each have separate smoothing controls to tame faster periods, as we
Doctor Oscillator
Nicholas C Weber
This is similar in it's idea as the Binary Advance/Lite indicator, but this is intended to use as a levels indicator, as well as trend reversal and how ranging the market is. It takes several useful indicators and combines them in such a way as to declutter your charts, yet prove even more useful together, than separate. RSI, RVI, DeMarker, MACD are added together then multiplied by ATR and StdDev to reveal multiple factors: How far the price has changed, and as the price slows down and reverses
筛选:
无评论
回复评论