R breaker Variation
- 指标
- 版本: 1.8
- 激活: 8

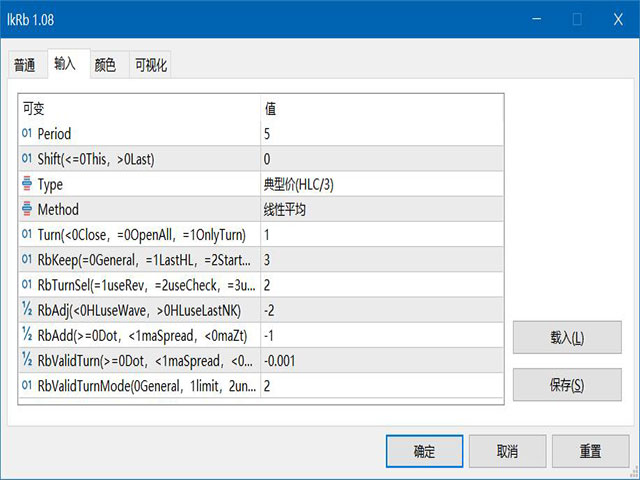
策略的基本原理
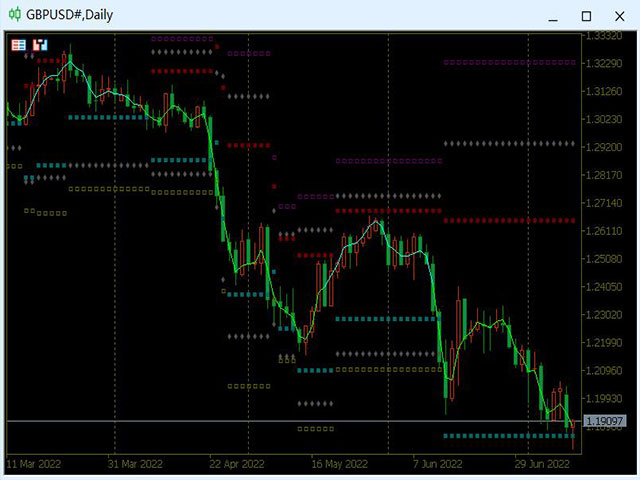
- 根据前一个交易日的收盘价、最高价和最低价数据通过一定方式计算出六个价位,从大到小依次为:突破买入价、观察卖出价、反转卖出价、反转买入、观察买入价、突破卖出价。以此来形成当前交易日盘中交易的触发条件。
- 追踪盘中价格走势,实时判断触发条件。具体条件如下:
- 突破
- 在空仓条件下,如果盘中价格超过突破买入价,则采取趋势策略,即在该点位开仓做多。
- 在空仓条件下,如果盘中价格跌破突破卖出价,则采取趋势策略,即在该点位开仓做空。
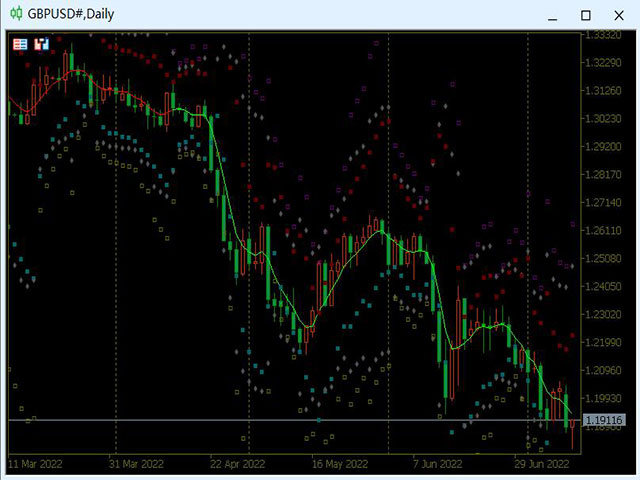
- 反转
- 持多单,当日内最高价超过观察卖出价后,盘中价格出现回落,且进一步跌破反转卖出价构成的支撑线时,采取反转策略,即在该点位反手做空。
- 持空单,当日内最低价低于观察买入价后,盘中价格出现反弹,且进一步超过反转买入价构成的阻力线时,采取反转策略,即在该点位反手做多。
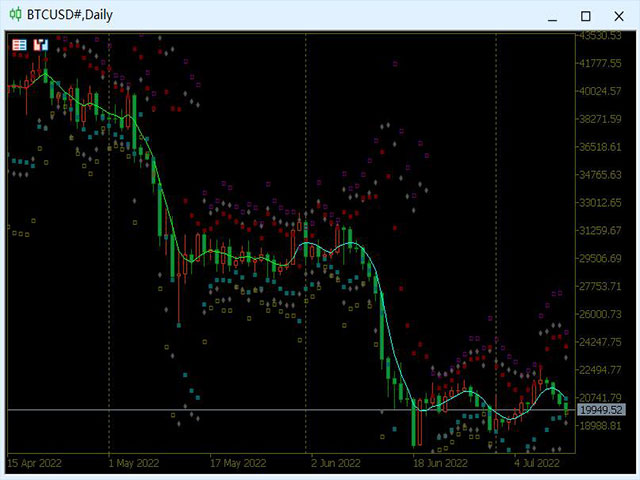
- 突破
- 设定止损条件。当亏损达到设定值后,平仓。
- 设定是否隔夜留仓。