KT Bollinger Shots MT5

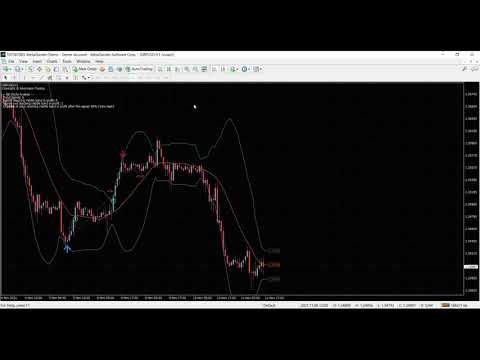
KT Bollinger Shots works using a striking blend of the slingshot pattern and the mean-reversion phenomenon applied to financial markets.

In addition, a mathematical algorithm is used with variable deviation to fine-tune the indicator's signals on a different level.

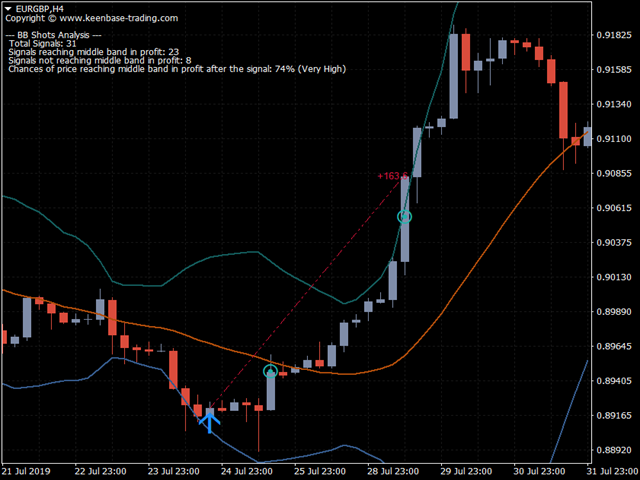
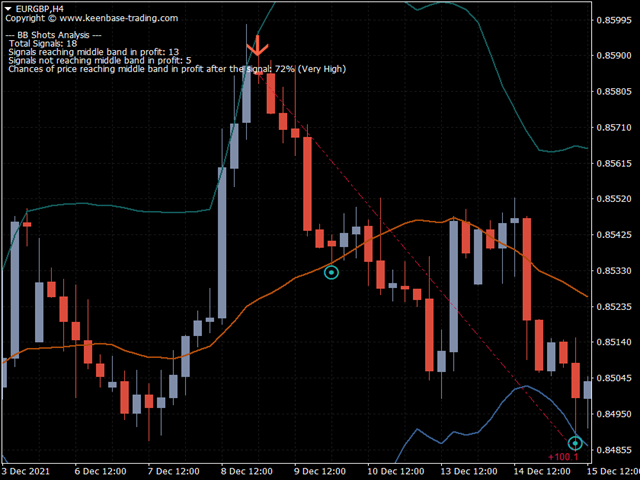
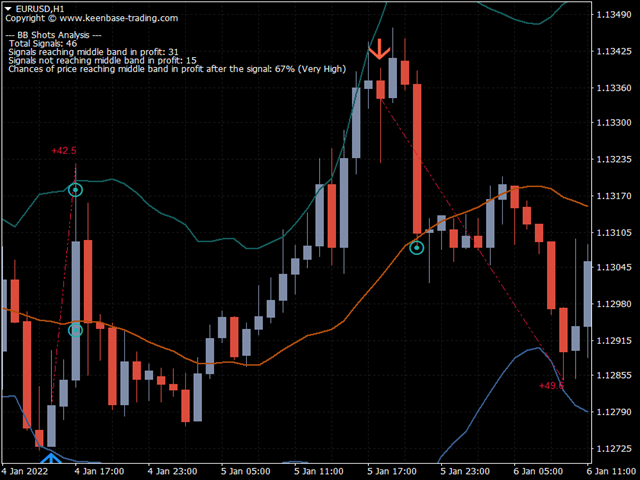
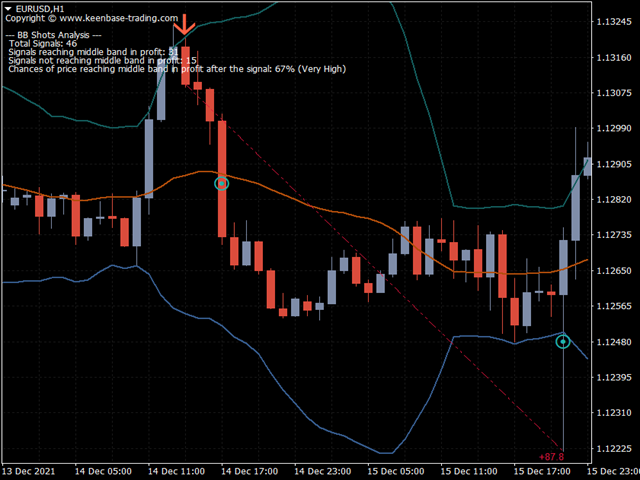
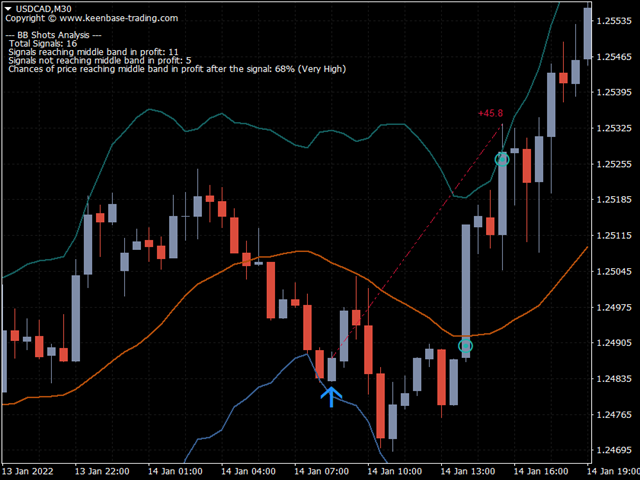
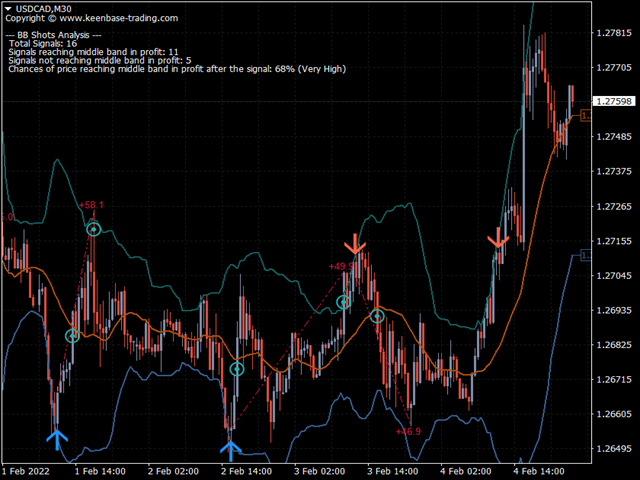
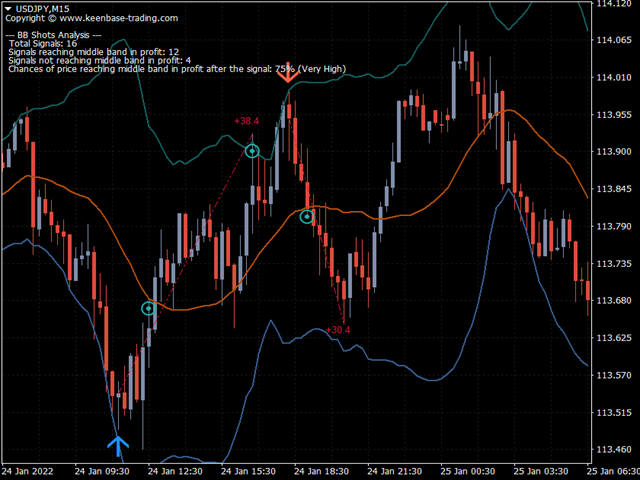
Winning Trade: After a signal, if price touches the middle band in profit, it is considered a winner.

Losing Trade: After a signal, if price touches the opposite band or touches the middle band in loss, it is considered a loser.

!Both scenarios are accounted for in performance metrics and shown on the chart in real-time.

If the probability of price reaching the middle band is 65% or more, it is considered very high due to the self-criticizing nature of the deployed algorithm. 


Key Features

  • The indicator performs analysis of BB shots signals and shows the probability of the upcoming signals closing in profit.
  • Exit points are marked on the chart for each of its signals.
  • Real-time analysis of signals statistics using a self-criticizing mathematical model.
  • Included the alerts for the possible exits after a signal.
  • A vibrant color scheme for better visualization of various indicator events.
  • All Metatrader alerts included. 
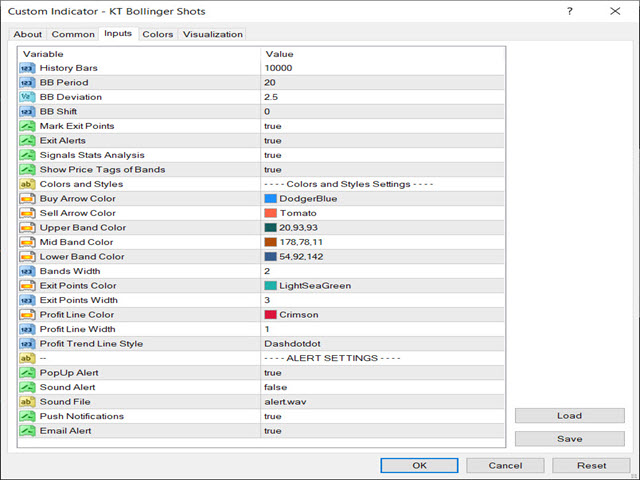
Inputs

  • History Bars:  Number of bars to include in the indicator's calculation.
  • Bollinger Bands Settings:  Period, Deviation, and Shift.
  • Mark Exit Points:  If true, the indicator marks the possible exit points.
  • Exit Alerts:  If true, the indicator also send alerts for the possible exit opportunities. 
  • Signal Stats Analysis:  If true, the indicator shows the signal stats and winning probability on the chart.
  • The rest of the inputs are self-explanatory.

Developers

int indicator_handle = iCustom(Symbol(),0,"Market/KT Bollinger Bands Shots");

// define arrays
double Upper_Band[];
double Middle_Band[];
double Lower_Band[];
double Buy_Signal[];
double Sell_Signal[];

// Copy the buffers into arrays
CopyBuffer(indicator_handle,0,1,1,Upper_Band);
CopyBuffer(indicator_handle,1,1,1,Middle_Band);
CopyBuffer(indicator_handle,2,1,1,Lower_Band);
CopyBuffer(indicator_handle,3,1,1,Buy_Signal);
CopyBuffer(indicator_handle,4,1,1,Sell_Signal);
 
if(Buy_Signal[0]!=0)   // Buy signal detected
if(Sell_Signal[0]!=0) //  Sell signal detected

double Buy_Stoploss  = Lower_Band[0] // Can be used as a possible stop loss for a buy trade. 
double Sell_Stoploss = Upper_Band[0] // can be used as a possible stop loss for a sell trade.
double Take_Profit   = Mid_Band[0] // Can be used as a possible profit target for both buy & sell trade.  
推荐产品
Free automatic Fibonacci is an indicator that automatically plots a Fibonacci retracement based on the number of bars you select on the BarsToScan setting in the indicator. The Fibonacci is automatically updated in real time as new highest and lowest values appears amongst the selected bars. You can select which level values to be displayed in the indicator settings. You can also select the color of the levels thus enabling the trader to be able to attach the indicator several times with differe
FREE
Quarter EMA
Jithin Sajan Sajan
Kindly rate and comment about the product for upgradation & Support The 5 EMA is plotted in green color ( Lime ). The 14 EMA is plotted in red color ( Red ). The 20 EMA is plotted in blue color ( Blue ). The 200 EMA is plotted in yellow color ( Yellow ). The Quarter EMA that provided calculates and plots four Exponential Moving Averages (EMAs) on the chart using different periods: 5, 14, 20, and 200. Each EMA is represented by a different color on the chart. Here's a description of each EMA:
Quintet EMA
Jithin Sajan Sajan
Kindly rate and comment about the product for upgradation & Support The   5 EMA   is plotted in   green   color ( Lime ). The  14 EMA  is plotted in  red  color ( Red ). The   20 EMA   is plotted in   blue   color ( Blue ). The  200 EMA  is plotted in  black  color ( Black ). The   200 EMA   is plotted in   yellow   color ( Yellow ). The Quarter EMA that provided calculates and plots four Exponential Moving Averages (EMAs) on the chart using different periods: 5, 14, 20, and 200. Each EMA is
SPECIAL LAUNCH OFFER: $30 (1-Month Rent) Limited time offer to build our community and gather feedback! AmbM GOLD Institutional Scalper A high-precision M5 algorithm for XAUUSD (Gold) , engineered to trade exclusively at Institutional Liquidity Levels ($5/$10 psychological marks). PERFORMANCE DATA (BUY ONLY) • Win Rate: 87.09%. • Safe Growth: +$4,113 profit on $10k (13.75% Max Drawdown). • Extreme Stress Test: Successfully generated +$22,997 in a 5-year stress test (2020-2026), proving
Prometheus Analyst
Humphrey Mangera
PROMETHEUS TECHNICAN VERSION Free | By THE SONS A gift from The Sons — no strings, no trial, no expiry. Every trader deserves access to professional-grade market intelligence. That belief is why Prometheus Technical Version exists, and why it costs nothing. Consider it our handshake to the trading community. What You're Getting This is not a simplified tool dressed up as a gift. Prometheus Technican Version is a fully built, institutional-quality technical analysis indicator running a dual-model
FREE
KT Asian Breakout Indicator MT5
KEENBASE SOFTWARE SOLUTIONS
KT Asian Breakout 指标分析亚洲交易时段的关键部分,以生成双向买卖信号,并基于价格突破的方向进行交易。当价格突破该交易时段的最高点时,会出现买入信号;当价格突破最低点时,会出现卖出信号。 注意事项 如果交易时段的范围过大,建议避免新交易,因为大部分价格走势已在该时段内完成。 如果突破K线过大,价格通常会在继续沿信号方向运行之前发生短暂回调。 功能特点 买入/卖出信号包含止损和盈利目标。 KT Asian Breakout 指标持续监测其表现,并使用第一、第二或第三盈利目标作为成功标准。 显示三个关键性能指标,包括盈亏信号、成功率和每个信号的平均点数。 如果突破K线过大,图表上会显示警告信息。 推荐设置 时间周期: 15分钟。 交易货币对: 所有 JPY 货币对。 输入参数 绘制交易时段框 :  true/false 绘制止损和盈利目标 :  true/false 性能分析 : true/false 显示文本分析(左上角) :  true/false 成功率标准 :  第一目标 | 第二目标 | 第三目标 颜色和样式设置 :  可自定义 警报设置 :  可自定义
H1NqAAAA
Jose Arranz Becerril
Bot specifically tailored for the NASDAQ 100, designed to detect key range breakouts and capitalize on market opportunities. Long Entry Signal : Detects bullish breakouts when the high of a previous range is below the closing price, and the daily low breaks below the lowest point of a defined range. Short Entry Signal : Identifies bearish breakouts when the high of a defined range crosses below the daily low. This bot is designed to be combined with my other products: H1NqAAAB (Mean Reversion)
Garuda Support Resistance Indicator is a powerful smart trading tool designed to automatically detect high-probability support and resistance zones on your chart. Built especially for Gold (XAUUSD) and Forex traders, this indicator removes the need for manual drawing and provides clean, visually clear buy and sell areas. This indicator uses intelligent swing-based logic to identify key price reaction levels where the market is most likely to reverse or react. The zones are dynamically updated an
FlatBreakout MT5
Aleksei Vorontsov
3 (1)
FlatBreakout MT5 (Free Version) Flat Range Detector and Breakout Panel for MT5 — GBPUSD Only FlatBreakout MT5   is the free version of the professional FlatBreakoutPro MT5 indicator, specially designed for flat (range) detection and breakout signals on the   GBPUSD   pair only. Perfect for traders who want to experience the unique fractal logic of FlatBreakout MT5 and test breakout signals on a live market without limitations. Who Is This Product For? For traders who prefer to trade breakout of
FREE
Fibaction
Abdelkhalek Orabi
Indicator Name: Fibaction – price action candle Detector Description: Fibo Signal Boxes is a powerful Smart Money Concept (SMC)-inspired indicator that auto-detects price action candles. bullish hammers and shooting stars, then draws precise Fibonacci entry zones and multiple take-profit levels directly on the chart. as for the SL personally i use 40 pips rules  Key Features: Detects bullish hammer and shooting star reversal candles. Automatically draws Fibonacci entry and TP boxes. as
PZ Penta O MT5
PZ TRADING SLU
3.5 (4)
The Penta-O is a 6-point retracement harmonacci pattern which usually precedes big market movements. Penta-O patterns can expand and repaint quite a bit. To make things easier this indicator implements a twist: it waits for a donchian breakout in the right direction before signaling the trade. The end result is an otherwise repainting indicator with a very reliable trading signal. The donchian breakout period is entered as an input. [ Installation Guide | Update Guide | Troubleshooting | FAQ | A
FREE
KT Renko Patterns MT5
KEENBASE SOFTWARE SOLUTIONS
KT Renko Patterns 会逐砖扫描整个 Renko 图表,寻找那些在各种金融市场中被交易者频繁使用的著名图表形态。 与基于时间的图表相比,Renko 图由于其简洁清晰的特性,更容易识别图表形态,尤其适合基于形态的交易策略。 KT Renko Patterns 包含多种常见的 Renko 图形模式,其中许多都在 Prashant Shah 所著的《用 Renko 图表实现盈利交易》一书中有详细说明。 基于 KT Renko Patterns 指标开发的 100% 自动交易EA已发布,点击这里了解 - KT Renko Patterns EA 。 特点 可交易多达八种清晰明确的 Renko 图形模式,无任何模糊。 每种模式都配有止损位和斐波那契目标位,确保交易策略客观明确。 KT Renko Patterns 实时监测每种模式的准确率,并将关键统计信息显示在图表上。 当 Renko 砖块发生反转时会自动标记并提醒,有助于在行情突变时提前计划退出。 已识别的图形不会重绘或重新绘制,信号稳定可靠。 包含的图形模式 W-M 形态 强势旗形 AB=CD 形态 三顶/三底 双顶
Donchian Breakout And Rsi
Mattia Impicciatore
4.5 (2)
概述 本指标是经典 Donchian 通道 的增强版,增加了多种实用的交易功能。 除了标准的三条线(最高、最低和中线),系统能够检测 突破 ,并在图表上用箭头进行可视化标记,同时只显示 与当前趋势方向相反的那条线 ,让图表更加简洁。 功能包括: 可视化信号 :突破时在图表上绘制彩色箭头 自动通知 :弹窗、Push 推送和 Email 邮件 RSI 过滤 :根据市场相对强弱验证信号 个性化设置 :颜色、线条粗细、箭头符号、RSI 阈值等 工作原理 Donchian 通道计算: 上轨线 :最近 N 根已收盘 K 线的最高价 下轨线 :最近 N 根已收盘 K 线的最低价 中线 :最高价和最低价的平均值 看涨突破 :收盘价高于上轨线 看跌突破 :收盘价低于下轨线 指标会: 绘制三条 Donchian 通道线 仅在 方向变化后的首次突破 绘制箭头 隐藏顺应趋势方向的那条线(上涨趋势: 只显示红色下轨线;下跌趋势: 只显示绿色上轨线) 可选用 RSI 过滤突破信号,减少虚假突破 支持实时发送通知 参数说明 Donchian 通道设置 indPeriod :计算通道高低点的已收盘 K 线数量 Lin
FREE
Trendline mt5 indicator
David Muriithi
4 (2)
Are you tired of drawing trendlines every time you're analyzing charts? Or perhaps you would like more consistency in your technical analysis. Then this is for you. This indicator will draw trend lines automatically when dropped on a chart. How it works Works similar to standard deviation channel found on mt4 and mt5. It has 2 parameters: 1. Starting Bar 2. Number of bars for calculation The   starting bar   is the bar which drawing of the trend lines will begin, while the   number of bars for c
FREE
ARE Quantum Liquidity
Jakir Hussain Shaikh
ARE Quantum Liquidity Institutional Smart Money Engine ARE Quantum Liquidity is an advanced Smart Money Concepts (SMC) indicator designed to help traders identify institutional liquidity movements and high-probability trading opportunities. The indicator analyzes market structure in real time and automatically detects important price action elements used by professional traders, including Break of Structure (BOS), Change of Character (CHoCH), Order Blocks, Fair Value Gaps (FVG), Liquidity Swe
Girassol Sunflower MT5 Indicator
Saullo De Oliveira Pacheco
3.86 (7)
This is the famous Sunflower indicator for Metatrader5. This indicator marks possible tops and bottoms on price charts. The indicator identifies tops and bottoms in the asset's price history, keep in mind that the current sunflower of the last candle repaints, as it is not possible to identify a top until the market reverses and it is also not possible to identify a bottom without the market stop falling and start rising. If you are looking for a professional programmer for Metatrader5, please
FREE
Follow The Line MT5
Oliver Gideon Amofa Appiah
4.6 (35)
This indicator obeys the popular maxim that: "THE TREND IS YOUR FRIEND" It paints a GREEN line for BUY and also paints a RED line for SELL. (you can change the colors). It gives alarms and alerts of all kinds. IT DOES NOT REPAINT and can be used for all currency pairs and timeframes. Yes, as easy and simple as that. Even a newbie can use it to make great and reliable trades. NB: For best results, get my other premium indicators for more powerful and reliable signals. Get them here: https://www.m
FREE
Reversal Composite Candles
MetaQuotes Ltd.
3.69 (16)
该系统的思路是通过计算复合蜡烛来识别反转形态。 反转形态类似日本蜡烛条分析的 "锤头" 和 "吊颈" 形态。但它使用符合蜡烛替代单一的蜡烛,并且不需要复合蜡烛的小实体来确认反转。 输入参数: Range - 最大柱线数量, 计算复合蜡烛时用。 Minimum - 最小复合蜡烛大小 (传统的点数)。 ShadowBig and ShadowSmall - 影线 (复合蜡烛单元)。 Limit, StopLoss and TakeProfit - 开盘价, 止损位和止盈位, 它们是相对于复合蜡烛的收盘价 (复合蜡烛单元)。 Expiration - 订单过期时间 (单位柱线), 用于挂单 (Limit!=0.0)。 反向蜡烛条形态的判别如下。 它计算复合蜡烛参数,其自最后的完整柱线 (索引为 1) 至由 Range 输入参数定义的柱线数量。如果复合蜡烛大小大于由 Minimum 输入参数指定的数值, 它分析复合蜡烛的影线检测反转条件。 空头能量的特征是复合蜡烛的上影线为零, 多头能量的特征是复合蜡烛的下影线为零。 为确认空头趋势反转 (且多头开始),需要以下检查: 下影线的大小 (多头能量
FREE
KT Pin Bar MT5
KEENBASE SOFTWARE SOLUTIONS
KT Pin Bar identifies the pin bar formation which is a type of price action pattern which depicts a sign of reversal or rejection of the trend. When combined with support and resistance, BRN and other significant levels, Pin Bar pattern proved to be a very strong sign of reversal. Basically, a pin bar is characterized by a small body relative to the bar length which is closed either in upper or lower 50% part of its length. They have very large wicks and small candle body. A pin bar candlestic
RBreaker
Zhong Long Wu
RBreaker Gold Indicators 是黄金期货一种短线日内交易策略,它结合了趋势跟踪和日内反转两种交易方式,既能捕捉趋势行情的利润,又能在行情反转时及时止盈并顺势反手。 该策略曾连续15年被美国《Futures Truth》杂志评选为前十大最赚钱的交易策略之一,具有很长的生命周期,至今仍在国内外普遍使用与研究。 本指标结合了2026年期货黄金的走势,依据14日ATR指标,分别定义了突破系数A,观察系数B,反转系数R更合理的数值,非常不错的指标,已实现年稳定盈利,值得推荐~ 以上指标适合高波动品种,参数适合期货黄金,股指期货等,如果需要其他品种行情,需要单独设定 突破系数A,观察系数B,反转系数R,进行回测才能使用。 欢迎指标售后有问题可以加+V:504282029
QuantumAlert RSI Navigator is a free indicator available for MT4/MT5 platforms, its work is to provide "alerts" when the market is inside "overbought and oversold" regions in the form of "buy or sell" signals. This indicator comes with many customization options mentioned in the parameter section below, user can customise these parameters as needful. Join our MQL5 group , where we share important news and updates. You are also welcome to join our private channel as well, contact me for the priva
FREE
Nem Nem
Taha Saber Ashour Kamel
Nem Nem is super accurate mt5 indicator it is working with any pair any time frame it will show and provide you with high Winrate signal you can use for forex pairs , gold and any other pairs it is easy to use also you can see the white lines for starting and end of signals it will help you to read the chart and enter and make correct decisions in trades. also it  will be clear for you when to enter and exit from any trades
FREE
Free for now, price is going to be 30 USD at Jan 1. 2025. Features: Pin Bar Detection : The indicator is designed to identify bullish and bearish pin bars based on specific criteria, including the relative size of the candle’s body and shadow, as well as the position of the candle's body in relation to the 38.2% Fibonacci level. Customizable Labels : Custom text is displayed above each identified bullish or bearish pin bar, such as "[38.2]" for bullish and "[-38.2]" for bearish, helping traders
FREE
Blue Orbit
Farel
4.38 (8)
Blue Orbit 今天的价格 是 190 。 当 10 份被售出时,新的价格将为 249 。 不要错过早期名额。 当前售出:9 。 踏入自动交易的新纪元,使用 Blue Orbit ——一个旨在解读市场自然“流动动态”的EA。 该系统专注于实时动量变化的读取,检测疲软区域,并在趋势疲软与反转强度交汇处执行入场。 这是一种非线性、流动的方法——远超僵化的机械设置。 加入我们不断壮大的交易者社区,访问MQL:  (点击这里) 深入了解EA的见解:   (点击这里) 概述 图表符号: XAUUSD (单图表设置) 时间框架: M15 最佳适用: XAUUSD 最低存款: 建议$500 杠杆: 1:100至1:500最佳 适当回测: 联系我,我将发送给你 设置文件 和帮助说明。 测试版本: 现在联系我获取   演示  测试版本文件。 额外礼物: 完成您的购买并联系我获得我的 免费EA 。 为什么 Blue Orbit 脱颖而出 主要策略: 该EA基于 量加权价格锚定 的概念。它利用成交量分布和价格行动历史来创建“锚定区”,在这些区域,价格反应的概率在统计上是很高的。交易在这些枢
具有多时间框架支持、可自定义视觉信号和可配置警报系统的平均真实波幅(ATR)指标。 免费编程服务、更新及其他 TrueTL 产品请访问 MQL5 个人主页 。 非常感谢您的反馈和评价! 什么是 ATR? 平均真实波幅(ATR)由 J. Welles Wilder 开发,是一种用于衡量市场波动性的技术指标。它计算指定周期内真实波幅(True Range)的平均值。真实波幅是以下三个值中的最大值:当前最高价与当前最低价之间的距离、前一收盘价与当前最高价之间的距离,或前一收盘价与当前最低价之间的距离。 ATR 不显示价格方向 — 它仅衡量波动性。ATR 上升表示波动性增加,ATR 下降则表示波动性减少。交易者使用 ATR 来评估市场状况、设置动态止损(例如基于 ATR 的追踪止损)、确定仓位大小以及识别潜在的突破行情。ATR 值偏高通常出现在快速波动或新闻驱动的市场中,而 ATR 值偏低则表明市场处于平静的整理阶段。 功能特点: 带箭头标记和垂直线的视觉信号标记 具有可配置触发条件的三个独立信号缓冲区 信号检测选项:方向变化、峰值/谷值 每个信号可配置警报功能(邮件、推送、声音、弹窗)
FREE
Spike Catch Pro
Amani Fungo
4.14 (7)
Spike Catch Pro 22:03 release updates Advanced engine for searching trade entries in all Boom and Crash pairs (300,500 and 1000) Programmed strategies improvements Mx_Spikes (to combine Mxd,Mxc and Mxe), Tx_Spikes,   RegularSpikes,   Litho_System,   Dx_System,   Md_System,   MaCross,   Omx_Entry(OP),  Atx1_Spikes(OP),   Oxc_Retracement (AT),M_PullBack(AT) we have added an arrow on strategy identification, this will help also in the visual manual backtesting of the included strategies and see ho
FREE
Nebulon Smart Trap AI
Tumpa Sarkar
5 (1)
Nebulon Smart Trap AI – Advanced Liquidity Trap Analysis for MetaTrader 5 Nebulon Smart Trap AI is a professional market analysis indicator for MetaTrader 5, developed for traders who want a more structured way to identify liquidity events, false breakouts, stop-hunt reactions, demand and supply interactions, and potential reversal zones directly from price action. Modern financial markets are heavily influenced by liquidity. Price often moves beyond obvious highs and lows, attracts breakout tra
本指标是实践实战交易完善的波浪自动分析的指标 !  案例... 注: 波浪分级用西方叫法不习惯,因受到缠论(缠中说禅)命名方式习惯的影响,我是将基础波浪命名为 笔 ,将二级波段命名为 段 ,同时具有趋势方向的段命名为 主趋段 (以后笔记中都是这种命名方式,先告知大家),但是算法上和缠论关系不大切勿混淆.反映的是本人分析盘面总结的 千变万化纷繁复杂的运行规律 . 对波段进行了标准化定义,不再是不同人不同的浪  ,    对人为干扰的画法进行了排除,在严格分析进场起到了关键的作用 . 使用这个指标,等于将交易界面提升美感,抛弃最原始的K线交易带你进入新的交易层次.如果不是为了交易,在宣传上也将使客户观感提升层次. 指标内容: 1.   基础波浪 (笔) : 首先我们找出了价格波动过程中的基础波动拐点,当然他的有序性低,为下一步的计算提供基础. 2.   二级波段( 段 ) :在基础波浪的基础上,通过算法分析得到层级更明显的二级波段,二级波段为波浪提供了分析基础 3.   波浪( 浪 ): 有着更清晰的趋势,更清晰直观的方向.分析一个波浪是否延续,需要看二级波段的形态,分析二级的构成
Uno Quant Trader
Mark Joseph Borromeo Juan
UNO Quant Trader UNO Quant Trader is a premium market-bias and trade-planning indicator built for traders who want cleaner decisions, faster chart reading, and a professional dashboard view. This indicator uses a multi-layer mathematical market model designed to analyze price behavior, momentum pressure, imbalance zones, trend strength, market exhaustion, and high-probability trade areas. Instead of relying on emotion or random entries, UNO Quant Trader helps you read the market using structured
Candle Countdown — MT5 精确K线倒计时 Candle Countdown 是一个简单且精确的工具,可在图表上显示 当前K线剩余时间 。 当交易入场依赖K线收盘时,即使几秒钟也非常关键。 该指标帮助您看到准确时间,从而在无需猜测或仓促决策的情况下进行交易。 用于精确控制K线收盘时间的工具。 指标显示内容: 当前K线剩余时间 服务器当前时间 点差(Spread) 止损最小距离(Stop Level) 该计时器独立于行情跳动(tick),通过平台内部定时器更新,即使在市场波动较低时也能保持稳定显示。 在低波动环境下依然可以获得平滑且稳定的倒计时效果。 所有信息显示在带背景的区域中,在任何图表配色下都清晰可见,并且不会影响图表分析。 随着K线接近收盘,计时器颜色会发生变化,帮助您快速判断当前状态。 提供 MT4 版本: Candle Countdown MT4 实际应用 使用该计时器可以提高入场时机和交易控制: 等待信号K线收盘 在新K线开始时同步入场 避免过早决策 指标可自然融入图表界面,不影响分析 : 不影响图表对象 切换周期时保持稳定 不会增加终端负担 计划更
FREE
该产品的买家也购买
Neuro Poseidon MT5
Daria Rezueva
4.98 (44)
Neuro Poseidon is a new indicator by Daria Rezueva. It combines precise trading signals with adaptive TP/SL levels - creating best possible trades as a result! Message me and get  Neuro Poseidon Assistant  as a gift to automize your trading process! What makes it stand out? 1. Proven profitability on all assets and timeframes 2. Only confirmed BUY and SELL signals present on the chart 3. Adaptive TP & SL levels generated by the software for each trade 4. Easy to understand - suitable for al
本产品已针对 2026 年市场进行更新,并针对最新 MT5 版本进行了优化。 价格更新通知: Smart Trend Trading System 目前价格为 $99 。 接下来的 30 次购买 后,价格将上涨至 $199 。 特别优惠: 购买 Smart Trend Trading System 后,请发送私信给我,即可免费领取 Smart Universal EA ,并将您的 Smart Trend 信号转换为自动交易。 Smart Trend Trading System 是一套完整的交易系统,具备不重绘、不回绘、不延迟的特点,专为希望获得更清晰信号、更准确趋势方向以及更有组织交易方式的交易者打造。 Online course , manual and download presets . 它将 10 多种交易工具 整合到一个系统中,包括趋势检测、反转区域、Smart Cloud、移动止损逻辑、支撑与阻力、K线着色、提醒以及多周期分析。 该系统旨在帮助您应对不同的市场环境: 趋势市场: 识别主要趋势,发现回调,跟随动能,并通过止损指导和移动止损选项寻找更清晰的入场机会。 震荡
Quantum TrendPulse
Bogdan Ion Puscasu
5 (25)
介绍 Quantum TrendPulse   ,这是一款终极交易工具,它将 SuperTrend   、   RSI 和 Stochastic 的强大功能整合到一个综合指标中,以最大限度地发挥您的交易潜力。该指标专为追求精准和效率的交易者而设计,可帮助您自信地识别市场趋势、动量变化以及最佳进入和退出点。 主要特点: 超级趋势整合: 轻松跟随当前的市场趋势并乘上盈利浪潮。 RSI 精度: 检测超买和超卖水平,非常适合把握市场逆转时机,可用作 SuperTrend 的过滤器 随机精度: 利用随机振荡在波动的市场中寻找隐藏的机会, 用作超级趋势的过滤器 多时间范围分析: 从 M5 到 H1 或 H4,在不同时间范围内关注市场动态。 可定制的警报: 当您的自定义交易条件得到满足时收到通知,这样您就不会错过任何交易。 无论您是新手还是经验丰富的交易员,   Quantum TrendPulse 都能为您提供所需的优势,帮助您增强策略并自信地进行交易。借助这一强大的指标,将洞察力转化为利润 — 掌控您的交易! ***购买 Quantum TrendPulse,即可免费获得 Quantum Tr
Divergence Bomber
Ihor Otkydach
4.9 (90)
购买该指标的每位用户将额外免费获得以下内容: 原创工具“Bomber Utility”,该工具会自动跟踪每一笔交易,设置止损和止盈点,并根据策略规则自动平仓; 适用于不同交易品种的指标设置文件(Set 文件); 三种不同风险模式下的 Bomber Utility 设置文件:“最低风险”、“平衡风险” 和 “观望策略”; 一套详细的 视频操作手册,帮助您快速完成安装、配置并开始使用本交易系统。 注意: 要获取以上所有赠品,请通过 MQL5 的私人消息系统联系卖家。 我为您介绍原创的自定义指标 “Divergence Bomber”(背离轰炸机),它是一套基于 MACD 背离交易策略 的“全功能”交易系统。 该技术指标的主要任务是识别 价格与 MACD 指标之间的背离,并发出交易信号(包括推送通知),指示未来价格可能的运动方向。平均而言,这些信号的准确率超过 98%。有关该指标如何工作的详细说明,请观看本页面上的视频演示。 该系统使用 止损订单 和 动态回撤平仓机制 来管理交易。 Divergence Bomber 指标的主要特点: 支持交易的品种: AUDCAD、AUDCHF、AUDSG
PrimeScalping
Temirlan Kdyrkhan
PrimeScalping is a powerful trading companion designed to generate high-probability entry signals with dynamic TP/SL/DP levels based on volatility. Built-in performance tracking shows win/loss stats, PP1/PP2 hits, and success rates — all updated live. Key Features: Buy/Sell signals with adaptive volatility bands Real-time TP/SL/DP levels based on ATR Built-in MA Filter with optional ATR/StdDev volatility Performance stats panel (Success, Profit/Loss, PP1/PP2) Alerts via popup, sound, push, or e
Power Candles MT5
Daniel Stein
5 (8)
Power Candles V3 - 自我优化的强度指标 Power Candles V3 把货币与品种的强度直接转化为图表上可执行的交易方案。指标不再仅根据强度给K线着色,而是在后台持续运行实时自动优化,为您正面对的品种给出最佳 Stop Loss、Take Profit 与信号阈值。一键采用,Entry、Stop Loss、Take Profit 线就以精确价格绘制在图表上,提醒消息中直接包含方向。 本工具是 Stein Investments 生态系统的一部分 - 18+ 款工具,加上 Max,您的一对一 AI 交易导师。  随时在线,深入了解每一款指标,在您需要梳理思路的那一刻就在那里。  立即认识他: https://stein.investments 每根收盘K线运行 3,000+ 次交易模拟。9 种强度状态。2 种策略并行测试。一键采用最优配置。 为什么需要这个 大多数强度指标只给您一个数值,然后留下三个问题:相信哪个阈值、用哪个 Stop Loss、走哪个交易方向。Power Candles V3 在每根收盘K线上自动回答这些问题。结果就是一个完整的交易方案 -
Atomic Analyst MT5
Issam Kassas
4.26 (35)
本产品已针对 2026 年市场进行更新,并针对最新 MT5 版本进行了优化。 价格更新通知: Atomic Analyst 目前价格为 $99 。 接下来的 30 次购买 后,价格将上涨至 $199 。 特别优惠: 购买 Atomic Analyst 后,请发送私信给我,即可免费领取 Smart Universal EA ,并将您的 Atomic Analyst 信号转换为自动交易。 Atomic Analyst 是一款不重绘、不回绘、不延迟的 Price Action 交易指标,专为手动交易、清晰信号和 EA 自动化而设计。 User manual: settings, inputs and strategy. 它分析价格行为、强度、动能、多周期方向和高级过滤器,帮助交易者减少噪音,避免弱势交易机会,并做出更有结构的交易决策。 该指标将复杂的市场计算转换为简单的视觉信号、彩色K线、趋势读数、止损水平和多个止盈区域,使交易者能够快速理解并应用于真实市场环境。 主要交易用途: 剥头皮和日内交易: 专为快速决策、清晰箭头、提醒、K线颜色和结构化进出场区域而设计。 日内交易和波段交易:
M1 Quantum MT5
Hamed Dehgani
5 (3)
开发者说明: 仅剩 1 个许可证 可享受 129 美元 的价格。售出后,价格将上涨至 149 美元 。 M1 Quantum 是一款专业的 M1 交易系统,提供快速且精准的交易信号,并内置止损(Stop Loss)、止盈(Take Profit)以及智能资金管理功能。 M1 Quantum 包含专业的资金管理系统,通过专注于 连续盈利交易 ,帮助交易者更快地增长账户资金。 M1 Quantum 指标 的主要特点 专为 M1 时间周期 和所有 主要货币对 设计 所有交易均配备止损和止盈 内置 资金管理功能 ,并指导交易者轻松执行交易计划 高胜率,高比例的 连续盈利交易 无重绘,无延迟 适合各种类型的交易者,简单易懂 要使用 M1 Quantum ,您需要 M1 Quantum Assistant 。这款强大的工具对所有 M1 Quantum 用户 免费提供 。 下载 M1 Quantum Assistant 加入我的 MQL5 频道 ,获取最新更新和新产品发布信息。 价格将在下周上涨至149美元。
本产品已针对 2026 年市场进行更新,并针对最新 MT5 版本进行了优化。 价格更新通知: Smart Price Action Concepts 目前价格为 $200 。 接下来的 30 次购买 后,价格将上涨至 $299 。 特别优惠: 购买后,请发送私信给我,即可领取 免费赠品 + 礼物 。 首先需要强调的是,这款交易工具是不重绘、不回绘、不延迟的指标,因此非常适合专业交易使用。 Online course , and manual Smart Price Action Concepts 指标是一款非常强大的工具,适合新手和有经验的交易者使用。它将 20 多个实用指标整合到一个系统中,结合了 Inner Circle Trader Analysis 和 Smart Money Concepts Trading Strategies 等高级交易理念。该指标专注于 Smart Money Concepts,帮助交易者理解大型机构如何交易,并辅助预测其市场行为。 它特别擅长流动性分析,使交易者更容易理解机构交易逻辑。它也非常适合预测市场趋势并仔细分析价格走势。通过让交易与机构策略保
ARIPoint
Temirlan Kdyrkhan
1 (1)
ARIPoint is a powerful trading companion designed to generate high-probability entry signals with dynamic TP/SL/DP levels based on volatility. Built-in performance tracking shows win/loss stats, PP1/PP2 hits, and success rates all updated live. Key Features: Buy/Sell signals with adaptive volatility bands Real-time TP/SL/DP levels based on ATR Built-in MA Filter with optional ATR/StdDev volatility Performance stats panel (Success, Profit/Loss, PP1/PP2) Alerts via popup, sound, push, or email Cu
Azimuth Pro
Ottaviano De Cicco
5 (7)
Azimuth Pro V2:MT5合成分形结构分析与确认入场 概述 Azimuth Pro 是 Merkava Labs 推出的多层级波段结构指标。四层嵌套波段层级、锚定波段的VWAP、ABC形态识别、三时间框架结构过滤以及收盘确认入场——一个图表,一个从微观波段到宏观周期的完整工作流程。 这不是盲目的信号产品。它是一个以结构为先的工作流程,专为重视位置、背景和时机的交易者打造。 V2上市优惠 — Azimuth Pro V2售价USD 399(接下来的100份)。最终价格:USD 499。 1. V2的变化 合成多时间框架引擎 高时间框架分析从零开始重建,采用与Meridian Pro相同的专有合成架构。更清晰的HTF背景、稳定的实时行为、无经典MTF同步问题。合成引擎还解锁了 固定比率时间框架级联 (x2、x3、x4、x6)——不再在经纪商的固定时间框架之间任意跳转,您可以按图表时间框架的固定倍数分析结构,在每个尺度上保持相同的分形关系。 确认入场箭头 作为稳定且可恢复的执行层而设计的收盘确认箭头。当ABC设置形成且自适应确认逻辑在收盘K线上验证方向时,箭头会写入下一根K线的
Gem SIGNAL
Shengzu Zhong
5 (1)
GEM Signal Pro GEM Signal Pro 是一款適用於 MetaTrader 5 的趨勢跟隨指標,專為希望在圖表上獲得更清晰訊號、更有結構的交易設定,以及更實用風險管理的交易者而設計。 它不僅僅顯示一個簡單的箭頭,GEM Signal Pro 還能以更清晰、更易讀的方式呈現完整的交易思路。當條件確認完成後,指標可在圖表上顯示進場價、止損價與止盈目標,幫助交易者更有效率地評估交易設定。 運作方式 該指標首先根據其內部邏輯識別有效的初始訊號。 當確認條件滿足後,GEM Signal Pro 會在圖表上顯示完整的交易設定。這讓交易者可以更清楚地看到交易結構,並減少手動分析與計算的工作量。 圖表上的交易價位 對於已確認的訊號,GEM Signal Pro 可顯示: 進場價 止損價 止盈 1 止盈 2 止盈 3 風險報酬比 這讓交易設定更容易理解,也有助於讓圖表分析更有條理。 內建風險管理 風險管理是此指標設計的重要部分。 止損位基於近期市場結構,結合附近的擺動高低點與可選的 ATR 緩衝距離。這能讓交易價位更貼近當前市場條件,而不只是依賴固定距離。 圖表資訊面板 GEM Si
KURAMA GOLD SIGNAL PRO(MT5)— 7层过滤 · 自动止盈止损 · 质量评分 · 信号历史保存 | 完整的XAUUSD交易系统 实时不重绘。信号出现的瞬间,箭头、入场、止盈、止损当场锁定,之后绝不移动。你交易的就是这个实时信号。而且在v7.20中,每一个真正发出的信号都会自动保存,并在重启后精确还原。 购买者专属赠品 购买永久授权,即可免费获得 AI Zone Radar(价值$59)+ 完整PDF手册。在产品价格之外,额外附赠价值$59的赠品。购买后在MQL5上给我留言即可。 AI Zone Radar: https://www.mql5.com/en/market/product/175834 在黄金交易者社区中被实际使用,因精度与易用性而广受好评。 你的难题 —— 以及解决方案 黄金一天波动$30–$50。你知道机会就在那里。但这些情况是否似曾相识: - 入场太早,价格逆行$10后才朝你的方向
Quant Direction MT5
Georgios Kalomoiropoulos
Quant Direction 是一款三维市场分析工具。它通过同时计算多个维度上的精确百分比偏差,提供完全客观的、基于算法的市场分析视角。该算法采用先进的人工智能建模工具开发,并经过全面测试,旨在以独特的精准度解读市场。它可以分析您平台上的任何货币对或金融工具。 无论您是短线 交易者、日内 交易者还是波段交易者,Quant Direction 都是您的理想之选。 交易者的真正优势 Quant Direction 的真正优势在于彻底消除情绪、屏幕疲劳和过度思考。它无需手动点击十几个图表来寻找方向并反复质疑自己的偏好,引擎即可在几毫秒内即时处理 8 个时间周期(从 5 个月到月线)。它能准确告诉你任何时刻谁在掌控市场,确保你始终朝着概率最高的方向进行交易。 市场分析的三个维度 该算法将市场分为三个不同的交易维度,为您提供完整的宏观和微观视角: 超短线交易分析: 捕捉即时、快速的动量变化和较低时间框架的执行点。 日内分析: 识别真实的、潜在的每日方向性偏差。 波动分析: 专注于宏观趋势,确保您不会与大盘机构的走势背道而驰。 独家评分引擎 Quant Direction 的底层采用了一套
Grabber System MT5
Ihor Otkydach
4.83 (24)
向您介绍一款优秀的技术指标——Grabber,它是一套即开即用的“全包式”交易策略。 在一个代码中集成了强大的市场技术分析工具、交易信号(箭头)、提醒功能和推送通知。 每位购买该指标的用户还可免费获得以下内容: Grabber辅助工具:用于自动管理已开仓位 视频操作指南:逐步教学如何安装、设置和使用该指标进行交易 原创Set文件:可快速自动配置,帮助实现最佳交易效果 忘掉其他策略吧!只有Grabber能够真正激励你在交易中攀登新高峰! Grabber策略的主要特点: 交易周期:从M5到H4 适用资产:任意,但我推荐我亲自测试过的品种(GBPUSD、GBPCAD、GBPCHF、AUDCAD、AUDUSD、AUDSGD、AUDCHF、NZDUSD、NZDCAD、EURCAD、EURUSD、EURAUD、EURGBP、EURCHF、USDCAD、USDSGD) 交易时间:全天候 24/7 交易效果:我分享自己的真实交易结果,并在此教学如何操作: https://www.mql5.com/ru/market/product/134563?source=Site+Market+MT5+Indic
介绍     Quantum Breakout PRO   ,突破性的 MQL5 指标,正在改变您交易突破区域的方式!由拥有超过13年交易经验的资深交易员团队开发,     量子突破 PRO     旨在通过其创新和动态的突破区域策略将您的交易之旅推向新的高度。 量子突破指标将为您提供带有 5 个利润目标区域的突破区域的信号箭头,以及基于突破框的止损建议。 它既适合新手交易者,也适合专业交易者。 量子 EA 通道:       点击这里 重要的!购买后请私信我领取安装手册。 建议: 时间范围:M15 货币对:GBPJPY、EURJPY、USDJPY、NZDUSD、XAUUSD 账户类型:ECN、Raw 或 Razor,点差极低 经纪商时间:GMT +3 经纪商:IC Markets、Pepperstone with Raw 和 Razor 的点差最低 规格: 不重漆! 最多 5 个建议利润目标区域 建议止损水平 可定制的盒子。您可以设置自己的 Box Time Start 和 Box Time End。 接触 如果您有任何疑问或需要帮助,请通过私人消息与我联系。
SmartScalping
Temirlan Kdyrkhan
SmartScalping is a powerful trading companion designed to generate high-probability entry signals with dynamic TP/SL/DP levels based on volatility. Built-in performance tracking shows win/loss stats, PP1/PP2 hits, and success rates — all updated live. Key Features: Buy/Sell signals with adaptive volatility bands Real-time TP/SL/DP levels based on ATR Built-in MA Filter with optional ATR/StdDev volatility Performance stats panel (Success, Profit/Loss, PP1/PP2) Alerts via popup, sound, push, or e
RelicusRoad Pro MT5
Relicus LLC
4.96 (24)
RelicusRoad Pro: 量化市场操作系统 终身访问限时 70% 折扣 - 加入 2,000+ 交易员社区 为什么大多数交易者即使拥有“完美”指标也会失败? 因为他们在真空中交易 单一概念 。没有背景的信号是赌博。要持续获胜,您需要 共振 (CONFLUENCE) 。 RelicusRoad Pro 不是一个简单的箭头指标。它是一个完整的 量化市场生态系统 。它描绘价格运行的“公允价值之路”,区分市场噪音和真实的结构性突破。 停止猜测。开始用机构级“路”逻辑进行交易。 核心引擎:“Road” (路) 算法 系统的核心是 Road Algo ,一个实时适应市场条件的动态波动率通道。它投射出 安全线 (平衡) 和价格可能反转的 扩展水平 。 Simple Road: 典型市场的标准结构映射。 Smooth Road: 针对震荡盘整的降噪计算。 Breakout Road: 专为识别波动率扩张和爆发性走势而调整。 1. 算法动量与确认 我们的“剥头皮箭头”不只是简单的交叉。它们利用 高阶多项式逻辑 过滤噪音,确保信号与主周期一致。我们检测动量、价格行为和 Road 结构汇聚的精确入场
This indicator automatically detects  internal & swing market structure, Breaker block, Strong Imbalance, Liquidity Void, Volume imbalance. Features Full internal & swing market structure labeling in real-time Breaker block Strong Imbalance Liquidity Void volume imbalance After purchasing the indicator, the full source code is provided, and via indicator buffers it can be easily integrated into your Expert Advisors (EAs) for automated trading strategies.
Gladiator Indicator: Conquer the Markets Step into the trading arena with the Gladiator Indicator, a robust and highly effective trading tool designed exclusively for MQL5. Built for traders who want clear, actionable insights, Gladiator cuts through market noise to deliver precise Buy and Sell signals right on your charts. Whether you are a beginner looking for guidance or an experienced trader seeking a reliable confirmation tool, Gladiator provides the edge you need to battle the markets wi
Btmm state engine pro
Garry James Goodchild
5 (5)
BTMM State Engine Pro is a MetaTrader 5 indicator for traders who use the Beat The Market Maker approach: Asian session context, kill zone timing, level progression, peak formation detection, and a multi-pair scanner from a single chart. It combines cycle state logic with a built-in scanner dashboard so you do not need the same tool on many charts at once. What it does Draws the Asian session range; session times can follow broker server offset or be set in inputs. Tracks level progression (L
TrendProMaster
Temirlan Kdyrkhan
MasterTrend Indicator for MT5 A powerful trend-following and signal-evaluation tool MasterTrend   is a custom MT5 indicator that combines Moving Averages and ATR-based risk/reward logic to generate clear buy/sell signals. It visualizes dynamic SL/TP levels, evaluates past trade outcomes, and displays win/loss statistics in a clean on-chart panel. Key features include: Buy/Sell signals based on MA crossovers ATR-based SL/TP1/TP2/TP3 levels with visual lines and labels Signal outcome tracking wit
Advanced Currency Strength28 MT5
Bernhard Schweigert
5 (3)
任何新手或专家交易者的最佳解决方案! 这个指标是一个独特的、高质量的、可负担得起的交易工具,因为我们纳入了一些专有的功能和一个新的公式。只需一个图表,你就可以读出28个外汇对的货币强度!想象一下,你的交易将如何得到改善,因为你的交易是在你的手中进行的。想象一下,你的交易将如何改善,因为你能够准确地确定新趋势或剥头皮机会的触发点? 用户手册:点击这里  https://www.mql5.com/en/blogs/post/697384 这是第一本,原版的! 不要买一个毫无价值的崇拜者的克隆品。 特别的 子窗口中的箭头显示强劲的货币势头GAP将指导你的交易! 当基础货币或报价货币处于超卖/超买区域(外盘斐波那契水平)时,在个人图表的主窗口中出现警告信号。 当货币力量从外围区间回落时,回撤/反转警报。 十字星模式的特别警报 可选择多个时间框架,以快速查看趋势! 货币强度线在所有的时间框架中都非常平稳,当使用较高的时间框架来识别总体趋势,然后使用较短的时间框架来确定精确的入口时,效果非常好。你可以根据自己的意愿选择任何时间框架。每个时间框架都由其自身进行了优化。 建立在新的基础算法
Valtor Edge Pro
Torben Petersen
Valtor Edge Pro – Precision Gold Signal Indicator with 3-Level Take-Profit & Live Stats Dashboard Valtor Edge Pro is a non-repaint MetaTrader 5 indicator built exclusively for XAUUSD (Gold) . It marks high-probability buy/sell signals directly on your chart — each one with a defined stop-loss and a complete three-level take-profit map (TP1 / TP2 / TP3) . Designed for disciplined traders, it pairs a clean trend-following signal engine with a professional sidebar dashboard, so you always see you
Presenting one-of-a-kind Gann Indicator for XAUUSD IQ Gold Gann Levels is a non-repainting, precision tool designed exclusively for XAUUSD intraday trading. It uses W.D. Gann’s square root method to plot real-time support and resistance levels, helping traders spot high-probability entries with confidence and clarity. William Delbert Gann (W.D. Gann) was an exceptional market analyst whose trading technique was based on a complex blend of mathematics, geometry, astrology, and ancient calculation
Meridian Pro
Ottaviano De Cicco
5 (2)
Meridian Pro 2.00:MT5 专业多周期趋势矩阵 Meridian Pro 2.00 是面向 MetaTrader 5 的专业自适应趋势矩阵。它结合了原始 Meridian 趋势引擎、清晰的图表 ribbon、收盘柱确认箭头、8 周期 dashboard、Fuel 动量、加权共识、合成 HTF 处理,以及直接显示在当前图表上的高周期环境线。 目标很简单:在一个有纪律的 workflow 中读取当前趋势、多周期结构、强度、动量和 EA-ready 状态,而不是在多个图表上堆叠互不关联的指标。 Meridian Pro 的不同之处 一个自适应引擎 - 同一套波动率感知 Meridian 逻辑应用于 M1 到 W1。 合成 HTF 架构 - 高周期行由低周期数据推导,减少传统零售 MTF 中常见的 repaint、同步延迟和 broker-dependent HTF 质量问题。 完整矩阵输出 - Bias、Strength、Fuel 和加权 Consensus 一起显示,而不是拆成独立工具。 图表执行层 - ribbon 和箭头专注于当前周期,选配 HTF 线在同一图表上增加高
对任何新手或专家交易者来说都是最好的解决方案! 这个指标是一个独特的、高质量的、负担得起的交易工具,因为我们已经纳入了一些专有的功能和一个秘密的公式。只需一张图表,它就能给出所有28种货币对的警报。想象一下,你的交易将如何改善,因为你能够准确地确定新趋势或剥头皮机会的触发点 建立在新的基础算法上,它使识别和确认潜在交易变得更加容易。这是因为它以图形方式显示了一种货币的强势或弱势是否正在加速,并测量了这种加速的速度--把它想象成你汽车中的速度表。当你加速时,事情显然会发生得更快,这在外汇市场上也是一样的,即如果你配对的货币正在向相反的方向加速,你就会发现一个潜在的有利可图的交易。 货币动量的垂直线和箭头将指导你的交易! 动态的市场斐波那契23水平被用作警报触发器,将适应市场活动。如果冲动触及黄色触发线,您将在MetaTrader或您的电子邮件或推送警报中收到警报。然后你就知道作为一个交易员应该做什么。货币对和方向已经给出。只要点击警报按钮,就可以切换到该货币对或打开一个新的图表,以便进一步分析。警报级别可以通过用户输入来改变,可以选择3个敏感度级别。 尽早获得新趋势的初始化触发
Advanced Supply Demand MT5
Bernhard Schweigert
4.53 (15)
任何新手或专业交易者的最佳解决方案! 该指标是一款独特、高质量、且价格合理的交易工具,因为我们已经整合了许多专有功能和新公式。 依据此更新,您将能够显示双重时间帧区域。 您不仅可以显示一个较高的时间帧,还可以同时显示图表时间帧,加上更高的时间帧:显示嵌套时区。 供需双方所有交易者都会喜欢它。 :) 重要信息披露 高级供需的最大潜力,请访问 https://www.mql5.com/zh/blogs/post/720245   想象您的交易如何得以改善,是因为您能够精准定位入场或目标位吗? 构建于新的底层算法,它可以更轻松地识别出买卖双方之间的潜在失衡。 这是因为它以图形方式展示供需最强劲区域,及其过去的表现(显示旧区域)。 这些功能旨在帮助您更轻松地发现最佳入场区域和价位。 现在您可以针对您的交易品种和时间帧来优化和编辑区域强度! 高级供需指标适用于所有产品和时间帧。 它是一个新的公式,非常新的功能是两个区域强度函数可由用户输入进行调整! 这在交易中是一大优势。 当您学习如何使用专有功能,例如带有价格游离最小 X 因子的区域强度时,您能够判断该区域强劲与否。 供需区域用作警报触发器。
Gartley Hunter Multi
Siarhei Vashchylka
5 (12)
Gartley Hunter Multi - An indicator for searching for harmonic patterns simultaneously on dozens of trading instruments and on all possible timeframes. Manual (Be sure to read before purchasing) | Version for MT4 Advantages 1. Patterns: Gartley, Butterfly, Shark, Crab. Bat, Alternate Bat, Deep Crab, Cypher 2. Simultaneous search for patterns on dozens of trading instruments and on all possible timeframes 3. Search for patterns of all possible sizes. From the smallest to the largest 4. All fou
OmniSync Projection
Antonio-alin Teculescu
5 (1)
Chronos Fractal Engine is an innovative price projection indicator for MetaTrader 5, designed to transform your technical analysis by intelligently identifying and projecting historical price patterns. Built upon an advanced correlation algorithm and the fractal principles of the market, this powerful tool visualizes potential future price movements, giving you a unique edge in your trading decisions. What is Chronos Fractal Engine? At its core, the Chronos Fractal Engine employs a sophisticat
作者的更多信息
KT Auto Support Resistance Levels:适用于 MetaTrader 4/5 的多周期支撑阻力、智能区域与水平仪表盘 摆动高点、Pivot 枢轴点、订单块、前期高低点。每个交易者标记市场的方式都不太一样,最后承受代价的往往是图表本身。把太多方法堆在同一张图上,它就不再是一张清晰的地图,而会变成噪音。 KT Auto Support Resistance Levels 正是为了解决这个问题而设计。它会同时扫描月线、周线、日线以及当前周期,然后自动把真正重要的水平直接绘制到您的 MetaTrader 图表上。当图表开始变得拥挤时,只需点击一次,就可以把这些水平合并成干净的 Smart Zones。实时面板还会持续显示价格上方和下方最近的水平,让您不必在图表上来回寻找。 可以把它看作一位永远不会疲惫的图表分析师,始终帮您标记关键位置。 它能为您做什么 从多个经过验证的来源寻找并绘制水平:摆动点、Pivot 枢轴点、前期价格以及订单块中点,覆盖多个时间周期。 当您想要更简洁的图表时,可以把彼此接近的水平合并成清晰的 Smart Zones。 保持一个实时面板,显示
ACB Breakout Arrows MT5
KEENBASE SOFTWARE SOLUTIONS
3.5 (2)
ACB Breakout Arrows 指标通过检测特殊的突破形态,提供市场中的关键入场信号。该指标持续扫描图表中的价格动量,在价格出现重大变动前,提前提供精确的入场信号。 点击此处获取多品种多周期扫描器 - ACB Breakout Arrows MT5 扫描器 主要特点 指标自动提供止损和止盈价格。 内置多周期扫描仪仪表盘,可追踪所有时间周期的突破信号。 适用于日内交易者、波段交易者和剥头皮交易者。 优化算法提升信号精度。 特别设置的快速盈利线用于无亏损移动或短线目标。 支持胜率、盈亏比、平均利润等绩效分析指标。 无重绘,信号可靠。 交易确认 - 可使用 ACB Trade Filter 指标 来过滤低概率的交易信号。 强烈买入: 向上箭头 + 绿色柱状图 + 多头趋势。 强烈卖出: 向下箭头 + 红色柱状图 + 空头趋势。 当柱状图为灰色且趋势为震荡时,应避免交易。 (可选) -  使用  KT 支撑阻力水平指标  避免在重要支撑/阻力位附近入场。这类交易可能迅速变成亏损。 “一个成功交易者的目标是做出最好的交易。金钱只是附属。” —— 亚历山大·埃尔德 输入参数 历史
KT Support and Resistance Levels
KEENBASE SOFTWARE SOLUTIONS
KT Auto Support Resistance Levels:适用于 MetaTrader 4/5 的多周期支撑阻力、智能区域与水平仪表盘 摆动高点、Pivot 枢轴点、订单块、前期高低点。每个交易者标记市场的方式都不太一样,最后承受代价的往往是图表本身。把太多方法堆在同一张图上,它就不再是一张清晰的地图,而会变成噪音。 KT Auto Support Resistance Levels 正是为了解决这个问题而设计。它会同时扫描月线、周线、日线以及当前周期,然后自动把真正重要的水平直接绘制到您的 MetaTrader 图表上。当图表开始变得拥挤时,只需点击一次,就可以把这些水平合并成干净的 Smart Zones。实时面板还会持续显示价格上方和下方最近的水平,让您不必在图表上来回寻找。 可以把它看作一位永远不会疲惫的图表分析师,始终帮您标记关键位置。 它能为您做什么 从多个经过验证的来源寻找并绘制水平:摆动点、Pivot 枢轴点、前期价格以及订单块中点,覆盖多个时间周期。 当您想要更简洁的图表时,可以把彼此接近的水平合并成清晰的 Smart Zones。 保持一个实时面板,显示
如果您进行外汇交易,了解货币强弱和货币对相关性等详细信息,可以让您的交易更上一层楼。通过相关性分析,您可以将风险减半,而强弱分析将帮助您最大化利润。 本指标通过结合货币强弱分析和货币对相关性,提供了一种混合的方法,帮助选择最合适的货币对进行交易。 如何使用货币强弱分析 假设您的交易策略在AUD/JPY上提供了买入机会,但通过KT货币强弱分析发现JPY比AUD更强。那么,这笔交易很可能以亏损告终。有了这个指标,您可以轻松避免此类亏损。 如何使用货币对相关性 假设您的交易策略同时在NZD/USD和GBP/JPY上提供了卖出机会。通过KT货币对相关性功能,您发现这两个货币对的相关性达到77%。  由于这些货币对高度相关,同时交易它们只会加倍您的风险。如果在NZD/USD上出现亏损,GBP/JPY上的交易也很有可能出现亏损。 功能特点 快速识别最强和最弱货币,用以验证交易策略生成的交易机会。 通过避免交易高度相关的货币对,将风险降低一半甚至三分之一。 当某个货币成为最强或最弱时,接收警报通知。 通过货币金字塔分析强弱报告,将货币按强到弱进行排序。 详细了解货币强弱分析 货币强弱分析通
ACB Trade Filter MT5
KEENBASE SOFTWARE SOLUTIONS
ACB Trade Filter indicator provides a way to filtering out the low probability trading entries in a trading strategy. The indicator uses a sophisticated filtration algorithm based on the market sentiment and trend. The MT4 version of the same indicator is available here ACB Trade Filter MT4 Applications Works great with our indicator ACB Breakout Arrows MT5 Filter out low probability signals from any indicator. Avoid over-trading and minimize the losses. Trade in the direction of market sentime
KT Heiken Ashi Smoothed MT4
KEENBASE SOFTWARE SOLUTIONS
KT Heiken Ashi Smoothed 是标准 Heiken Ashi 的平滑版本,同时在趋势反转处绘制买卖箭头,方便即时捕捉信号。凭借这种直观而即时的可视化,交易者能在快节奏的市场中快速做出判断。 当状态由空头转为多头时绘制买入箭头。 当状态由多头转为空头时绘制卖出箭头。 支持手机推送、邮件、声音与弹窗等多通道提醒,确保第一时间获知变动。 Heiken Ashi Smoothed 究竟是什么? 它通过双移动平均对标准 Heiken Ashi 进行二次平滑,过滤虚假信号与噪声。尽管会带来些许滞后,但能清晰揭示摆动点与新兴趋势,让原本肉眼难以分辨的价格动态变得一目了然。利用这些信息,交易者可相应地优化进出场、调整仓位、完善风控,以在外汇、商品乃至指数市场中把握先机。 应用场景 该指标适用于外汇、商品和股票等多种市场。以下五种核心用法可以帮助寻找交易机会和确认行情: 纯蓝色蜡烛且无下影线:显示强劲上升趋势。 纯红色蜡烛且无上影线:显示强劲下降趋势。 趋势拐点常伴随实体极小、上下影线较长的蜡烛,可视为转势信号。
KT Momentum Arrows MT5
KEENBASE SOFTWARE SOLUTIONS
5 (2)
KT Momentum Arrows 指标基于瞬时突破计算,它结合了价格波动方向中的带宽偏离和新兴波动率。这是一种对动量变化反应灵敏的技术指标,适合在趋势开始阶段发出交易信号。 当价格收于上轨之上时,生成买入信号;当价格收于下轨之下时,生成卖出信号。 该指标使用一个“幅度系数”作为输入参数,同时影响带宽偏离和波动率计算。建议根据不同品种和时间周期仔细选择和优化该系数值以获得最佳效果。 主要特点 信号不重绘! 非常适合动量交易者的进场工具。 性能分析功能:胜率、盈亏比、平均收益等数据可视化展示。 适用于日内交易者、波段交易者和剥头皮交易者。 输入参数 历史K线数量:  用于指标计算的K线数量。 幅度系数:  用于调节带宽偏离和波动率的单一系数。 性能分析:  显示或隐藏性能分析,包括利润趋势线。  提醒设置:  支持弹窗、邮件、推送和声音提醒。 其余参数无需额外解释,简单明了。
KT Auto Fibo MT5
KEENBASE SOFTWARE SOLUTIONS
5 (1)
KT Auto Fibo根据当前的趋势方向自动绘制斐波那契回撤水平。最高点和最低点是根据图表上可用的最大值和最小值自动选择的。您可以通过缩放和滚动图表来相应地调整斐波那契水平。 模式 自动:  根据图表区域自动绘制斐波那契水平。 手动: 仅绘制一次斐波那契水平,之后您可以手动调整锚点。 使用方法: 帮助您合理预测未来的获利目标。 结合支撑/阻力位或趋势线使用时,具有较强的反转可能性。 在趋势市场中提供低风险的入场机会。 输入参数 自动:  无需人为干预即可绘制斐波那契回撤水平。 手动:  仅绘制一次斐波那契回撤水平,之后可以手动拉伸锚点。 显示未回撤区域: 在图表上显示或隐藏尚未被价格回撤触及的区域。 其余输入项为直观设置,无需额外解释。
KT Heiken Ashi Smoothed MT5
KEENBASE SOFTWARE SOLUTIONS
KT Heiken Ashi Smoothed 是标准 Heiken Ashi 的平滑版本,同时在趋势反转处绘制买卖箭头,方便即时捕捉信号。凭借这种直观而即时的可视化,交易者能在快节奏的市场中快速做出判断。 当状态由空头转为多头时绘制买入箭头。 当状态由多头转为空头时绘制卖出箭头。 支持手机推送、邮件、声音与弹窗等多通道提醒,确保第一时间获知变动。 Heiken Ashi Smoothed 究竟是什么? 它通过双移动平均对标准 Heiken Ashi 进行二次平滑,过滤虚假信号与噪声。尽管会带来些许滞后,但能清晰揭示摆动点与新兴趋势,让原本肉眼难以分辨的价格动态变得一目了然。利用这些信息,交易者可相应地优化进出场、调整仓位、完善风控,以在外汇、商品乃至指数市场中把握先机。 应用场景 该指标适用于外汇、商品和股票等多种市场。以下五种核心用法可以帮助寻找交易机会和确认行情: 纯蓝色蜡烛且无下影线:显示强劲上升趋势。 纯红色蜡烛且无上影线:显示强劲下降趋势。 趋势拐点常伴随实体极小、上下影线较长的蜡烛,可视为转势信号。
KT Psar Arrows
KEENBASE SOFTWARE SOLUTIONS
KT Psar Arrows使用标准的抛物线转向指标(Parabolic SAR)在图表上绘制箭头。当蜡烛的最高点触及SAR时绘制看涨箭头;当蜡烛的最低点触及SAR时绘制看跌箭头。信号在实时生成,无需等待K线收盘。  特点 对于想要基于抛物线SAR指标开发交易策略的交易者来说,这是一个非常有用的工具。  可以用于寻找市场中的转折点。 支持自定义PSAR参数输入。 提供所有MT4的提醒功能。 注意事项:抛物线SAR是一个滞后且严格机械化的指标。每一笔潜在交易都应该通过明确定义的规则进行筛选。     输入参数 PSAR步长:输入步长值。 PSAR最大值:输入最大值。 显示PSAR点:显示/隐藏PSAR点。即使不显示PSAR点,箭头功能也能正常工作。 其余输入项均为直观设置,无需特别说明。
KT Round Numbers MT5
KEENBASE SOFTWARE SOLUTIONS
KT Round Numbers plots the round number levels which are also commonly known as psychological levels in the Forex world. In the context of Forex trading, round number levels are those levels in which there are two or more zeroes at the end. They are named as 00 levels on the chart. Some traders also consider the halfway points as a valid round number level. They are named as 50 levels on the chart. Use of round number levels in trading Round number levels work as strong support and resistance
ACB Breakout Arrows
KEENBASE SOFTWARE SOLUTIONS
4.15 (34)
ACB Breakout Arrows 指标通过识别一种特殊的突破形态,为交易者提供关键的入场信号。该指标持续扫描图表中某一方向上趋于稳定的动能,并在主要行情启动之前给出准确的进场信号。  点击此处获取多品种、多周期扫描仪 - ACB Breakout Arrows MT4 专用扫描仪 主要功能 指标自动提供止损和止盈位置。 配备 MTF 多周期扫描仪面板,可跟踪所有时间周期的突破信号。 适用于日内交易者、波段交易者和剥头皮交易者。 采用优化算法,提高信号准确性。 提供特殊目标线,用于设置快速平仓点或无损平移位(Quick Profit Line)。 包括胜率、成功率、平均收益等表现分析指标。 不重绘,信号一旦出现即保持不变。 交易确认 -  建议结合使用 ACB Trade Filter 指标 以过滤低质量信号。 强买入: 上箭头 + 绿色柱状图 + 多头趋势。 强卖出: 下箭头 + 红色柱状图 + 空头趋势。 避免交易 :当柱状图为灰色且趋势为震荡时。 (可选) -  建议使用 KT  支撑与阻力位指标  来避免在关键支撑/阻力区域附近开仓。此类交易可能迅速转为亏损,造成不必
ACB Trade Filter MT4
KEENBASE SOFTWARE SOLUTIONS
5 (1)
The ACB Trade Filter indicator provides a solution for filtering out the low probability trading setups in a trading strategy. The indicator uses a sophisticated filtration algorithm based on the market sentiment and trend. Applications Works great with our indicator " ACB Breakout Arrows ". Filter out low probability signals from any indicator. Avoid overtrading and minimize the losses. Trade in the direction of market sentiment and trend. Avoid the choppiness in the market. How to use Only L
KT Momentum Arrows
KEENBASE SOFTWARE SOLUTIONS
KT Momentum Arrows 指标基于瞬时突破计算,它结合了价格波动方向中的带宽偏离和新兴波动率。这是一种对动量变化反应灵敏的技术指标,适合在趋势开始阶段发出交易信号。 当价格收于上轨之上时,生成买入信号;当价格收于下轨之下时,生成卖出信号。 该指标使用一个“幅度系数”作为输入参数,同时影响带宽偏离和波动率计算。建议根据不同品种和时间周期仔细选择和优化该系数值以获得最佳效果。 主要特点 信号不重绘! 非常适合动量交易者的进场工具。 性能分析功能:胜率、盈亏比、平均收益等数据可视化展示。 适用于日内交易者、波段交易者和剥头皮交易者。 输入参数 历史K线数量:  用于指标计算的K线数量。 幅度系数:  用于调节带宽偏离和波动率的单一系数。 性能分析:  显示或隐藏性能分析,包括利润趋势线。  提醒设置:  支持弹窗、邮件、推送和声音提醒。 其余参数无需额外解释,简单明了。
KT COG Advanced MT4
KEENBASE SOFTWARE SOLUTIONS
1 (1)
KT COG is an advanced implementation of the center of gravity indicator presented by John F. Ehlers in the May 2002 edition of Technical Analysis of Stocks & Commodities magazine. It's a leading indicator which can be used to identify the potential reversal points with the minimum lag. The COG oscillator catches the price swings quite effectively. MT5 version of the same indicator is available here KT COG Advanced MT5 Calculation of COG The COG indicator is consist of the two lines. The main l
KT Pin Bar
KEENBASE SOFTWARE SOLUTIONS
KT Pin Bar identifies the pin bar formation which is a type of price action pattern which depicts a sign of reversal or rejection of the trend. When combined with support and resistance, BRN and other significant levels, Pin Bar pattern proved to be a very strong sign of reversal. Basically, a pin bar is characterized by a small body relative to the bar length which is closed either in upper or lower 50% part of its length. They have very large wicks and small candle body. A pin bar candlestic
KT Trend Magic
KEENBASE SOFTWARE SOLUTIONS
KT Trend Magic shows the trend depiction on chart using the combination of market momentum and volatility. A smoothing coefficient is used to smooth out the noise from the signal.It can be used to find out the new entries or confirm the trades produced by other EA/Indicators. Usage Drag n drop MTF scanner which scans for the new signals across multiple time-frames. Find new entries in the trend direction. Improve the accuracy of other indicators when used in conjunction. Can be used as a dynami
KT Auto Fibo
KEENBASE SOFTWARE SOLUTIONS
KT Auto Fibo根据当前的趋势方向自动绘制斐波那契回撤水平。最高点和最低点是根据图表上可用的最大值和最小值自动选择的。您可以通过缩放和滚动图表来相应地调整斐波那契水平。 模式 自动:  根据图表区域自动绘制斐波那契水平。 手动: 仅绘制一次斐波那契水平,之后您可以手动调整锚点。 使用方法: 帮助您合理预测未来的获利目标。 结合支撑/阻力位或趋势线使用时,具有较强的反转可能性。 在趋势市场中提供低风险的入场机会。 输入参数 自动:  无需人为干预即可绘制斐波那契回撤水平。 手动:  仅绘制一次斐波那契回撤水平,之后可以手动拉伸锚点。 显示未回撤区域: 在图表上显示或隐藏尚未被价格回撤触及的区域。 其余输入项为直观设置,无需额外解释。
KT Ichimoku Trader
KEENBASE SOFTWARE SOLUTIONS
1 (1)
KT Ichimoku Trader is a fully automated expert advisor that offers five popular trading strategies based on the Ichimoku indicator. Each strategy has it's own entry and exit method without any interference to other strategies. The Ichimoku system can be applied to all major currency pairs and metals. However, we found that it performs reasonably well mainly on two pairs.   MT5 Version is available here  https://www.mql5.com/en/market/product/35043 Features Trade up to 5 famous trading strategi
KT Volatility Oscillator
KEENBASE SOFTWARE SOLUTIONS
KT波动率振荡器通过数学公式分析过去和当前的市场数据,以振荡器的形式显示结果。振荡器中波浪的增长和减弱分别对应于资产的高波动性和低波动性。  简单来说,波动率就是衡量资产在一定时间内价格波动幅度的指标。没有波动性,市场上的价格变化将非常有限,交易者也将难以从价格波动中获利。 外汇市场中波动率的应用 在外汇市场中利用波动率,可以帮助你更有效地进行交易,同时让你的预期更加符合实际情况。  高波动性 基于趋势的交易系统在高波动市场中表现出色,因为价格波动幅度大,趋势持续时间长,直到出现趋势反转。 如果突破发生在高波动期间,突破系统可以从市场中获得更多的点数收益。 低波动性 均值回归系统在低波动性环境下表现良好,因为市场有回归均值的特性。 基于通道的系统在市场盘整期,即低波动阶段,能够更加有效地发挥作用。 非方向性指标 KT波动率振荡器是一种非方向性指标,不与市场的牛市或熊市趋势直接相关。波动性的上升可能出现在牛市或熊市两种情形下。  输入参数 波动率周期:   一个整数值,用于设定计算的周期。 文本信息:   在图表上显示或隐藏信息文本。 ----- 警报设置 ----- 声音警报
KT COG Robot
KEENBASE SOFTWARE SOLUTIONS
KT COG Robot is a fully automated Expert Advisor based on the KT COG Indicator . The COG indicator was originally presented by John F. Ehlers in the May 2002 edition of Technical Analysis of Stocks & Commodities magazine. The EA fires a long trade when COG line cross above the signal line and a short trade is fired when the COG line cross below the signal line.  Adaptive Filtration Our adaptive filtration algorithm combines the original COG formula with the major trend direction and market acce
ACB Breakout Arrows EA
KEENBASE SOFTWARE SOLUTIONS
这是一款基于我们自定义指标 “ACB Breakout Arrows” 的全自动化智能交易系统。入场基于一种常见的双向突破模式,可通过外部参数“Signal Sensitivity”来调节入场信号的强度。 交易确认机制 ACB Breakout Arrows EA 可通过另一个自定义指标 ACB Trade Filter 来过滤不理想的入场信号,提高交易准确性。 强烈买入: 向上箭头 + 绿色柱状图 + 多头趋势。 强烈卖出: 向下箭头 + 红色柱状图 + 空头趋势。 当柱状图为灰色并且趋势为震荡时,EA 将避免交易。 EA 会在后台加载所有相关指标和依赖项,指标不会显示在图表上。 主要功能亮点 长期以来的呼声终于实现,现在您可以通过我们 ACB Breakout Arrows 指标 实现完全自动化交易。 ACB Trade Filter 也已集成在 EA 中,用于模拟完整的交易系统。 无需额外下载,所有指标和依赖都内嵌在 EA 中。 可直接从指标中提取止损和止盈目标。 通过内置过滤器(如交易时段、MMI、Vortex、波动率、市场状态等)进一步提升性能。 提供三阶段的部分平仓
KT Asian Breakout
KEENBASE SOFTWARE SOLUTIONS
4 (1)
KT Asian Breakout carefully analyzes the range-bound market during the Asian session and then fires a long or short trade after doing some preassessment based on its inbuilt technical analysis module. The executed orders are closed within a day before the completion of the next day session. The inbuilt technical analysis module checks for the session range and compares it with the last 20 days price movement. If it finds any erratic price movement within the session, the orders are not executed
KT London Breakout
KEENBASE SOFTWARE SOLUTIONS
First thirty minutes are essential for a trading session. The early reaction of traders and market players sets a path for the rest of the day. KT London Breakout EA takes advantage of this phenomenon, and after analyzing the first thirty minutes of London session, it places two bidirectional pending orders. One of pending order is eventually canceled after realizing the market direction with certainty. It has been strictly tested and developed for EUR/JPY using 30-Min Time Frame. You can expe
MACD Divergence Seeker
KEENBASE SOFTWARE SOLUTIONS
KT MACD Divergence Seeker trades the regular and hidden divergence signals generated by our free indicator named KT MACD Divergence indicator. Trading the standalone divergences can be a risky affair that's why the KT MACD Divergence Seeker combines the standard divergence signals with an advanced analysis module to exploit the price inefficiencies on some FX pairs. What is the Divergence exactly? As a general conception if the price is making higher highs, then macd should also be making hig
KT Asian Breakout Indicator
KEENBASE SOFTWARE SOLUTIONS
KT Asian Breakout 指标分析亚洲交易时段的关键部分,以生成双向买卖信号,并基于价格突破的方向进行交易。当价格突破该交易时段的最高点时,会出现买入信号;当价格突破最低点时,会出现卖出信号。 注意事项 如果交易时段的范围过大,建议避免新交易,因为大部分价格走势已在该时段内完成。 如果突破K线过大,价格通常会在继续沿信号方向运行之前发生短暂回调。 功能特点 买入/卖出信号包含止损和盈利目标。 KT Asian Breakout 指标持续监测其表现,并使用第一、第二或第三盈利目标作为成功标准。 显示三个关键性能指标,包括盈亏信号、成功率和每个信号的平均点数。 如果突破K线过大,图表上会显示警告信息。 推荐设置 时间周期: 15分钟。 交易货币对: 所有 JPY 货币对。 输入参数 绘制交易时段框 :  true/false 绘制止损和盈利目标 :  true/false 性能分析 : true/false 显示文本分析(左上角) :  true/false 成功率标准 :  第一目标 | 第二目标 | 第三目标 颜色和样式设置 :  可自定义 警报设置 :  可自定义
MACD Divergence MT4
KEENBASE SOFTWARE SOLUTIONS
KT MACD 背离指标显示价格与振荡器之间的常规背离和隐藏背离。如果你的交易策略是基于趋势反转,可以使用 MACD 的常规背离来捕捉潜在的转折点。而如果你的策略是基于趋势延续,MACD 的隐藏背离将是一个不错的选择。 KT MACD 背离的局限性 将 MACD 背离作为单独的入场信号可能存在一定风险。并非所有的背离都能解释为反转信号。为了获得更好的效果,建议将其与价格行为分析和其他交易方法结合使用。 功能特点 标记价格与振荡器之间的常规和隐藏背离。 为提高准确率并减少图表杂乱,会自动忽略不对称的背离。 支持趋势反转和趋势延续两种交易策略。 完全支持嵌入到智能交易系统中使用。 可用于入场信号和出场信号。 支持所有 MetaTrader 警报功能。 什么是背离? 一般来说,如果价格创出更高高点,那么振荡器也应创出更高高点;如果价格创出更低低点,那么振荡器也应同步走低。当这种正常的行为没有出现时,就表示价格和振荡器之间出现了背离。背离主要分为两种类型: 常规背离 常规看涨背离:当价格创出更低低点,但振荡器却创出更高低点。 常规看跌背离:当价格创出更高高点,但振荡器却创出更低高点。
KT Bollinger Bands Trader MT4
KEENBASE SOFTWARE SOLUTIONS
KT Bollinger Bands Trader 是一款 100% 自动化的智能交易顾问(EA),基于布林带在低波动时期的均值回归交易策略构建。价格经常在布林带的上轨或下轨附近产生反应,但并非每次都会发生反转。然而,在低波动期间,价格反转的可能性更高。 入场规则 当价格正确下穿布林带下轨时,开启买入交易。 当价格正确上破布林带上轨时,开启卖出交易。 出场规则 在低波动阶段结束时自动平仓。 也可在达到止损或止盈时平仓。 本 EA 在经典布林带策略基础上进行了诸多改进,允许用户通过内置的趋势过滤器、波动率过滤器、Vortex、MMI 和星期过滤器等工具,对策略进行细致调节。 输入参数 ----- 策略设置 ----- 布林带周期、带移位、带偏差 开始时间(Start Hour) 结束时间(End Hour) GMT 时区偏移(GMT offset) ----- 交易设置 ----- 手数类型:固定手数 | 自动手数 每单风险百分比(Risk Per Trade) ----- 出场设置 ----- 止损方式:无止损 | 基于波动率 | 固定点数 止盈方式:无止盈 | 基于波动率 |
KT CCI Divergence MT4
KEENBASE SOFTWARE SOLUTIONS
KT CCI Divergence shows the regular and hidden divergence created between the price and CCI oscillator. Divergence is one of the vital signals that depicts the upcoming price reversal in the market. Manually spotting the divergence between price and CCI can be a hectic and ambiguous task. Limitations of KT CCI Divergence   Using the CCI divergence as a standalone entry signal can be risky. Every divergence can't be interpreted as a strong reversal signal. For better results, try to combine it w
KT MA Crossover MT4
KEENBASE SOFTWARE SOLUTIONS
KT MA Crossover 指标根据所选的移动平均线交叉绘制买入和卖出箭头。此外,它还会生成相应的提醒通知,并为每个连续信号显示 MFE(最大有利偏移)值,帮助交易者更好地了解潜在利润区域。 移动平均交叉策略是全球交易者广泛采用的一种经典技术分析方法。通常包含一条快速和一条慢速的移动平均线,根据交叉的方向来确定买入或卖出的交易信号。 买入信号 - 快速均线向上穿越慢速均线。 卖出信号 - 快速均线向下穿越慢速均线。 功能特点 每项均线参数都可完全自定义设置。 每个连续信号都会显示对应的 MFE 值。 代码轻量,占用系统资源极少。 包含所有 MetaTrader 系统提示和警报。 缺点  移动平均线是一种滞后性指标,主要依赖历史数据。在盘整行情中,均线交叉信号可能显得较为随机,容易产生假信号。因此,交易者在实际应用中需要根据自身判断灵活处理这些信号。 输入参数 历史K线数量:  用于计算信号的历史K线数量。 ----- 选择用于计算快慢移动平均的周期和方法 ----- 显示均线:  在图表上显示或隐藏移动平均线(不影响交叉信号)。 绘制利润线: 显示或隐藏 MFE 曲线。 
筛选:
无评论
回复评论