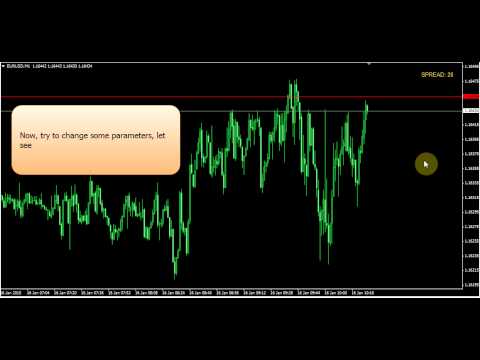
Draw Ask line and show SPREAD
- 指标
-
Cuong Pham
 coding and modifying EA, indicators professionally, fast and more...(languages:MQL/C,C++/Java/C#)
email hungcuongkhmt51@gmail.com
skype cuongph149 - 版本: 2.0
- 更新: 20 十一月 2021
- 激活: 5
The indicator helps you to draw Ask line on the current chart and show the current spread.
So, it helps you to do scalping trade easier.
See the video below. It shows you how it works.
Parameters
- line_color – Ask line color
- text_size – text size of spread value
- text_color – color of spread value
Thank you!
If you have any question, please contact me via Skype: cuongph149, or email: hungcuongkhmt51@gmail.com