Merger Charts

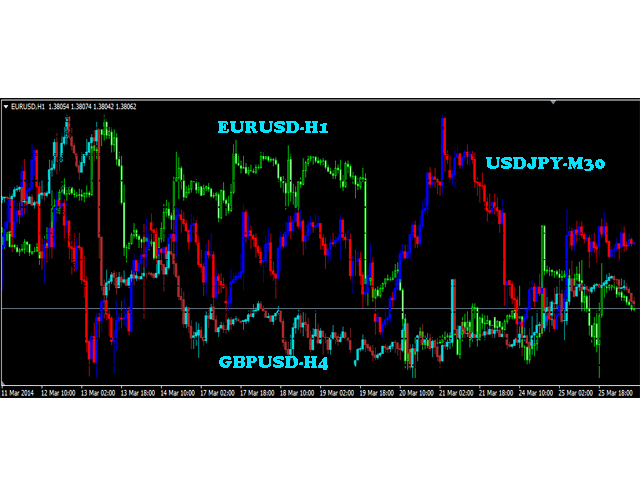
This indicator will help you merge two (or more than two) charts to view multi-symbols in just 1 chart (see the screenshots).

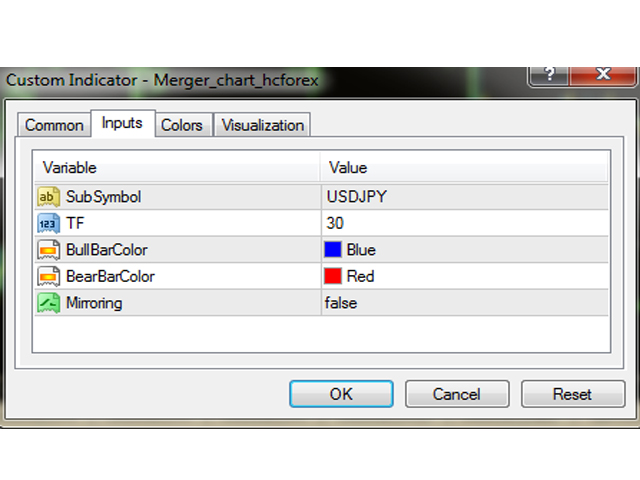
You can choose any symbols to add with any timeframe you want.

You can choose bull/bear color for bars.

You can mirror the chart that will be added.

If you want to add many charts, just run the indicator many times with each symbol and each timeframe.

推荐产品
Quantum Falcon Signal Free is a smart visual trading indicator for MetaTrader 4 designed for Forex and Gold traders. The indicator combines: • Trend analysis • RSI momentum confirmation • MACD momentum filtering • ATR volatility filtering • Higher timeframe confirmation • Smart exit signal detection Main Features: • Smart Buy and Sell signals • Exit Buy / Exit Sell alerts • Real-time dashboard on chart • Professional candle arrows • Multi-timeframe trend confirmation • ATR market volatility filt
FREE
Email Drawdown Alert
Roman Starostin
5 (12)
Free informative Indicator-helper. It'll be usefull for traders who trade many symbols or using grid systems (Averaging or Martingale). Indicator counts drawdown as percent and currency separate. It has a number of settings: Count deposite drawdown according equity value and send e-mail or notifications to user if DD more than set; Sending e-mail when max open orders reached; Shows price and remaining pips amount before MarginCall on current chart and Account generally; Display summary trade lot
FREE
SMC Venom 模型 BPR 指標是針對在智慧貨幣 (SMC) 概念內工作的交易者的專業工具。它會自動辨識價格圖表上的兩種關鍵模式: FVG (公平價值缺口)是三根蠟燭的組合,其中第一根和第三根蠟燭之間存在缺口。它在水平之間形成一個沒有成交量支撐的區域,這通常會導致價格調整。 BPR (平衡價格區間)是兩種 FVG 模式的組合,形成一個「橋樑」 - 當價格以低成交量活動移動時,突破並返回到水平的區域,從而在蠟燭之間產生間隙。 這些模式可協助交易者透過分析圖表上的交易量和價格動態(大型市場參與者和普通參與者之間的互動)來識別關鍵的支撐/阻力位、突破區域和切入點。 此指標以矩形和箭頭的形式可視化模式,也支援靈活的警報設定。 主要特點: 模式顯示模式:選擇顯示 BPR 模式(看漲和看跌)或 FVG 模式(看漲和看跌)。 可以隱藏所有圖表分析模式。 以條數過濾:BPR 結構中 FVG 之間的最小/最大距離。 訊號的附加視覺化: 箭頭有 9 種類型可供選擇(標準、細、分形等)或手動輸入 Wingdings 代碼,其表格可以選擇性地顯示在圖表上。 使用 ATR 配置顏色、尺寸及其相對於價格
Secret Liquidity Zones Indicator User Manual Introduction Unlock the power of hidden market opportunities with the Secret Liquidity Zones Indicator . This cutting‐edge tool is designed to reveal critical price levels where market momentum may shift. With its dynamic adaptability and sleek gold visuals, it offers clear and elegant insights into key trading opportunities—making it the perfect secret weapon for traders who demand precision and clarity. Key Features Dynamic Timeframe Adaptation: A
Captain Gold
ThinkTech SRL
Many forex traders spend their time looking for that perfect moment to enter the markets or a telltale sign that screams "buy" or "sell". And while the search can be fascinating, the result is always the same. The truth is… there is no guaranteed way to trade the forex markets. As a result, traders must learn that there are a variety of indicators that can help to determine the best time to buy or sell a forex cross rate. Our indicator definitely does this! This strategy is created by traders fo
Royal Dutch Skunk
Sayan Vandenhout
ROYAL DUTCH SKUNK USES THE TREND WAVE INDICATOR AND IT CAN IDENTIFY THE BEGINNING AND THE END OF A NEW WAVE TREND MOVEMENT. AS AN OSCILLATOR, THE INDICATOR IDENTIFIES THE OVERBOUGHT AND OVERSOLD ZONES. IT WORKS GREAT TO CATCH THE SHORT TERM PRICE REVERSALS AND USES A MARTINGALE STRATEGY TO CLOSE ALL TRADES IN PROFIT. USE DEFAULT SETTINGS ON H1 OR HIGHER TIME FRAME ON ANY PAIR FOR MORE ACCURATE TRADES WHY THIS EA : Smart entries calculated by 6 great strategies The EA can be run on even a $20000
EARLY REMINDER: The Starting price is 65 price will rise soon up to 365$ and then 750$ after first 10 copies of sales. Grab this offer now! Introduction Hello, traders! Welcome to the demonstration of the Forex Beast Indicator , a comprehensive tool designed to assist aspiring traders in navigating the complexities of the forex market. This indicator incorporates seven essential components to provide a well-rounded trading experience: Moving Averages Colored Zones Support and Resistance Levels
Binary Option Signal
Yaroslav Varankin
Indicator for binary options arrow is easy to use and does not require configuration works on all currency pairs, cryptocurrencies buy signal blue up arrow sell signal red down arrow tips do not trade during news and 15-30 minutes before their release, as the market is too volatile and there is a lot of noise it is worth entering trades one or two candles from the current period (recommended for 1 candle) timeframe up to m 15 recommended money management fixed lot or fixed percentage of the depo
The new update makes this indicator a complete tool for studying, analyzing and operating probabilistic patterns. It includes: On-chart Multi-asset percentage monitor. Configurable martingales. Twenty-one pre-configured patterns , including Mhi patterns and C3. An advanced pattern editor to store up to 5 custom patterns. Backtest mode to test results with loss reports. Trend filter. Hit operational filter. Martingale Cycles option. Various types of strategies and alerts. Confluence between patte
我们的 Basic Support and Resistance 指示器是提高技术分析所需的解决方案。该指标允许您在图表/ MT5版本 功能 斐波那契水平的集成: 可以选择显示斐波那契水平以及支持和阻力水平,我们的指标使您对市场行为和可能的逆转区域有更深入的了解。 性能优化: 只能在每个栏的打开时更新扩展线,我们的指标可确保最佳性能,而无需牺牲支持和阻力级别的准确性。 输入 主设置 Timeframe:   通过此输入,您可以选择在图表上显示较高时间范围的支撑线和阻力线。 Support/Resistance Strength [Number of Bars]:  使用此输入,您可以确定支撑和电阻的强度。数量越高,支持/阻力越强。 Price mode: 此参数允许您选择哪种价格将用于计算支持和电阻水平。它可以是收盘价,最高价格,最低价格等。取决于您的策略和偏好,您可以选择最适合您需求的价格。 显示设置 Display Fibonacci levels: 此参数确定是否将显示斐波那契水平以及图表上的支持和电阻级别。斐波那契水平是技术分析中使用的关键水平,并使用斐波那契序列进行计算
MA Alignment Scanner
Benedict Jamora
5 (1)
This indicator scans and displays currency pairs that have recently aligned moving averages on a given timeframe. You can configure which pairs the indicator will scan. It also includes all types of alert options. Bullish MA Alignment =  MA1>MA2>MA3>MA4>MA5 Bearish MA Alignment =  MA1<MA2<MA3<MA4<MA5 Features Attach to one chart and scans all the currency pairs configured and visible in the Market Watch Window It can monitor all the available timeframes from M1 to MN1 and sends alerts on every
每日趋势黄牛 (DTS) 该指标是 RPTrade Pro Solutions 系统的一部分。 DTS 是使用价格行为、动态支撑和阻力的每日趋势指标。 它旨在供任何人使用,即使是绝对的交易初学者也可以使用它。 从不重新粉刷。 指示是从接近到接近给出的。 设计为单独使用,无需其他指标。 在一天开始时为您提供趋势和潜在的获利。 它是如何工作的 DTS 正在使用结合价格行为和动态支撑和阻力的突破策略。 分析夜间趋势和波动性以在第二天使用。 通过该分析确定突破限制(蓝色和深橙色线)以及止盈 由于历史数据,可以立即检查策略和设置的“成功”。 历史部分允许立即查看策略中是否存在任何“漏洞”,并最终选择另一个更适合的时间框架或符号。 实时从蜡烛收盘到蜡烛收盘,趋势指标等待信号条件有效,然后通过箭头显示(绿色表示买入,橙色表示卖出)。 红色点划线显示了止盈和最终止损的位置。 交易是一一指示的,永远不会同时进行两笔交易。 大多数交易(80%)在白天完成。 DTS 表示: 对于购物车上所有选定的符号: 在哪里打开您的交易。 获利和止损。 可以捕获的潜在点数。 DTS 作品 如果报价是隔夜提
Noize Absorption Index MT4
Ekaterina Saltykova
5 (1)
Noize Absorption Index - is the manual trading system that measures the difference of pressure between bears forces and bulls forces. Green line - is a noize free index that showing curent situation. Zero value of index shows totally choppy/flat market.Values above zero level shows how powerfull bullish wave is and values below zero measures bearish forces.Up arrow appears on bearish market when it's ready to reverse, dn arrow appears on weak bullish market, as a result of reverse expectation. S
MajorAlert
Sergei Vassunov
MajorAlert - is a professional trading indicator for MetaTrader 4 that combines two distinct market analysis approaches into one powerful tool. By integrating a counter‑trend entry logic (upper block) with a trend‑following filter (lower block), the indicator generates high‑probability signals on the chart with clearly separated arrow colors. Key Features Fully self‑contained   – no external indicators required; all calculations are built‑in. Versatile inputs   – adjust all parameters to suit a
Forex Gump
Andrey Kozak
2.4 (5)
Forex Gump is a fully finished semi-automatic trading system. In the form of arrows, signals are displayed on the screen for opening and closing deals. All you need is to follow the instructions of the indicator. When the indicator shows a blue arrow, you need to open a buy order. When the indicator shows a red arrow, you need to open a sell order. Close orders when the indicator draws a yellow cross. In order to get the most effective result, we recommend using the timeframes H1, H4, D1. There
Forex Dead Line Lite
Mikhail Kontsevoy
5 (1)
The indicator can help traders to assess in advance the number of Lots, Balance and Equity, if the price deviates from the current levels. The indicator will be useful for those who trade using Martingale. Features The indicator belongs to the category of risk management. The indicator helps to assess in advance the account change that would happen in case of possible price change from the current value to a threshold. It also recalculates swap, lock, pending orders, take profit and stop loss.
FREE
GeoWprPro
Georgij Komarov
WPR by Profile, or WPR for Professionals Geo_WprPro is one of the well-known currency profile indicators. It simultaneously displays two WPR indicators with different parameters in the matrix form on all timeframes of multiple currency pairs forming the currency profile . As follows from the description, " WPR is a leading indicator that often goes ahead of the price chart. The oscillator frequently reaches extreme values before the price reversal as if anticipating that event: it almost always
VR Cub
Vladimir Pastushak
VR Cub 这是获得高质量切入点的指标。该指标的开发是为了促进数学计算并简化对仓位入场点的搜索。多年来,该指标所针对的交易策略已被证明其有效性。交易策略的简单性是其巨大的优势,即使是新手交易者也能成功进行交易。 VR Cub 计算开仓点以及获利和止损目标水平,这显着提高了效率和易用性。查看使用以下策略进行交易的屏幕截图,了解简单的交易规则。 设置、设置文件、演示版本、说明、问题解决,可以从以下位置获取 [博客] 您可以在以下位置阅读或撰写评论 [关联] 版本为 [MetaTrader 5] 计算入场点的规则 开仓 要计算入场点,您需要将 VR Cub 工具从最后一个高点拉伸到最后一个低点。 如果第一个点在时间上早于第二个点,交易者等待柱线收于中线上方。 如果第一个点在时间上晚于第二个点,交易者等待柱线收于中线下方。 根据上述条件,严格在 柱线收盘 后建仓。 换句话说,如果我们在小时图上进行交易,那么从最高点到最低点的时间距离必须超过24小时,最高点和最低点之间的点数必须大于或等于平均价格变动每天。 维持和改变市场地位 可以有多个未平仓头寸;每个头寸都可以单独修改。 VR Cub
Candle Pattern Finder Candle Pattern Finder is a powerful MT4 indicator designed to help traders easily detect key candlestick patterns in real-time. Whether you're trading trends, reversals, or consolidations, this tool highlights important price action signals directly on the chart — helping you make faster and more confident trading decisions. Detects popular candlestick patterns: Bullish/Bearish Engulfing Hammer & Inverted Hammer Shooting Star & Hanging Man Three White Soldiers Three Black
FREE
FXPrimeOperator
Alain Andras Korodi
FXPRIMEOPERATOR MT4 具备智能交易管理、3 个输入参数和安全逻辑的多货币外汇 EA FxPrimeOperator 是一款适用于 MetaTrader 4 的多货币 Expert Advisor,专为外汇市场的自动化交易而设计。 EA 使用多时间框架逻辑,将短期入场信号与更高时间框架的市场背景相结合。在开仓前,系统会考虑趋势方向、动能、点差情况、波动率以及市场质量。 该系统专注于外汇货币对,并且只使用 3 个输入参数,使设置保持简单清晰。 主要功能 - 适用于 MetaTrader 4 的多货币外汇 EA - 仅 3 个输入参数 - 交易模式:QUALITY、BALANCED 和 AGGRESSIVE - 使用 M5、H1 和 H4 市场背景的多时间框架逻辑 - 自动交易管理 - 部分平仓逻辑 - Breakeven 和 Profit-Lock 管理 - 动态追踪止损逻辑 - 下单时直接设置止损保护 - 针对持仓的 SL watchdog - 点差、波动率、Spike 和 Whipsaw 过滤器 - 连续亏损和安全逻辑 - 针对强确认信号的受控加仓逻辑 -
Accuwiser
Arash Nikniazi
Accuwiser Expert Advisor We have developed a strategy for GOLD which is now available for everyone through Accuwiser Expert advisor. Tight money management and risk management have been applied to this expert. The way we handle losing trades is unique and 3 different methods are applied if any trade goes in loss. Furthermore Entering a trade is time-based and differs in various modes we recommend. Different risk levels which have been provided have no interaction with higher lot size. Only dif
Crypto_Forex 指标“晨星模式”适用于 MT4。 - 指标“晨星模式”是价格行为交易的非常强大的指标:无需重绘,无延迟。 - 指标检测图表上的看涨晨星模式:图表上的蓝色箭头信号(见图片)。 - 带有 PC、手机和电子邮件警报。 - 还有它的兄弟 - 看跌“黄昏之星模式”指标可用(点击以下链接)。 - 指标“晨星模式”非常适合与支撑/阻力位结合使用。 ................................................................................................................. 点击这里查看高质量的交易机器人和指标! 这是仅在此 MQL5 网站上提供的原创产品。
The Arrow Scalper
Fawwaz Abdulmantaser Salim Albaker
1 (2)
Dear Friend..  I share with you this simple Expert Adviser .. it is full automatic  this Expert Adviser following the trend of the pair you install on or any stocks or indices , it is works like that: - when the trend on H4 chart show a start of up trend the expert will wait till the 15M & 1H charts show an up trend the EA will open a buy order directly , and do the same for down trend and open a sell order the buy or sell  order lot size and take profit and stop loss will measured manually  by
FREE
TWO PAIRS SQUARE HEDGE METER INDICATOR Try this brilliant 2 pairs square indicator It draws a square wave of the relation between your two inputs symbols when square wave indicates -1 then it is very great opportunity to SELL pair1 and BUY Pair2 when square wave indicates +1 then it is very great opportunity to BUY pair1 and SELL Pair2 the inputs are : 2 pairs of symbols         then index value : i use 20 for M30 charts ( you can try other values : 40/50 for M15 , : 30 for M30 , : 10 for H1 ,
MT Unstoppable
Issara Seeboonrueang
Please feel free to contact me if you need any further information. Please let me know if you have any questions. I hope the above is useful to you. MT Unstoppable :  is a swing trade or trend strategy through signal filtering with experience.  indicator for trade by yourself TRADE: Forex TIME FRAME:  All Time Frame    (Not M1 ,  Introducing timeframe H1) SYMBOL PAIR: All Symbol  SETTINGS: TREND: Period, Trend Zone  and   Trend Zone Meter Multi Timeframe ( For backtest, history data
PZ Mean Reversion MT4
PZ TRADING SLU
3 (4)
采用专业和量化方法进行均值回归交易的独特指标。它利用了价格以可预测和可衡量的方式转移并返回均值这一事实,这允许明确的进入和退出规则大大优于非量化交易策略。 [ Installation Guide | Update Guide | Troubleshooting | FAQ | All Products ] 清晰的交易信号 非常容易交易 可定制的颜色和尺寸 实现性能统计 优于大多数交易策略 显示合适的止损和止盈水平 它实现了电子邮件/声音/视觉警报 这个怎么运作 该指标从更高的时间范围测量完全可定制的移动平均线的标准偏差,并使用趋势跟踪方法精确地找到交易。交易是通过深入当前图表的价格行为发现的,并在价格返回到平均价格区间时关闭,根据您选择的更高时间范围计算。由于其编码方式,该指标将远离高波动性和强劲趋势市场,并且仅在可预测的情况下进行交易,在可接受的波动性与方向性比率范围内,回归均值是可行的。 指标剖析 绿线是更高时间范围内的移动平均线(也就是平均值) 虚线区域是移动平均线周围的典型价格区间 蓝线是看涨交易的突破价格 红线是看跌交易的突破价格 交易是针对均值进行的,并在典型的价格
历史订单统计 (Advanced History Collector Panel) 历史订单统计 是一款专为 MetaTrader 平台设计的高级账户分析与可视化工具。它能够深度复盘您的交易历史,将枯燥的成交数据转化为直观的图表与详细的统计报表。 核心功能: 多维度数据统计 :精准计算每日/周/月的盈亏、订单总量、多空对比及手数分布。 可视化图表系统 :内置盈亏折线图、净值曲线、持仓品种分布柱状图等多种统计视图,支持实时动态绘制。 深度风险分析 :自动统计最大浮盈、最大浮亏及账户余额变动,助您洞察资金管理中的薄弱环节。 高度自定义 UI :支持字体、颜色、面板尺寸及统计时间范围的完全自定义,适配各种分辨率屏幕。 数据自动化 :支持历史数据导出与自动加载,确保统计结果的连续性与实时更新。 无论是复盘交易策略还是日常资金监控,本指标都是您提升交易纪律、优化风控的得力助手。
FREE
Market Maestro: Your Ideal Partner for Automated Forex Trading If you're looking for a reliable assistant for trading in the currency market, Market Maestro is exactly what you need. This modern Forex bot is built using the latest technologies and algorithms, allowing it to effectively analyze market data and make informed trading decisions in real-time. Key Features of Market Maestro 1. Multicurrency Capability for Broad Opportunities Market Maestro can work with a wide range of currency pairs,
| Fully-automated Smart Money Concept (ICT) inspired trading solution with multi-strategy capabilities | Built by a grid trader >> for grid traders.  This is MT4 version, click  here  for  Blue CARA MT5  (settings and logics are same in both versions)     Real monitoring signal  -->  Cara Gold Intro Blue CARA EA   ('CARA') - short for  C omprehensive  A lgorithmic R esponsive A dvisor is a next-gen  multi-currency    multi-timeframe  EA base on the widely known (and perhapse most popular) Inn
This product is a part of  ON Trade Waves Patterns Harmonic Elliot Wolfe you can test free version on EURJPY from this link  Wolf Waves Indicator 探索 Wolf Waves - 您的终极交易工具! 您是否正在寻找一种强大的工具,能够轻松地在任何时间框架上识别 Wolf Waves?不用再找了!我们的 Wolf Waves 指标可以轻松完成这项任务。以下是为您呈现它的理由: 主要特点: 自动检测: 我们的 Wolf Waves 指标使用复杂的算法自动查找关键点并在您的图表上绘制相应的线条。不再需要手动搜索模式。 用户友好: 无论您是专业交易员还是对 Wolf Waves 还不熟悉,我们的指标都非常易于使用。 精准性: 它非常精确,降低了虚假信号的数量,提高了您的信心。 信息丰富: 该指标不仅限于模式检测。它还提供入场点、止损水平和利润目标等重要交易信息,帮助您做出明智的交易决策。 适用于 EA: 如果您进行自动化交易,此指标可以无缝集成到您
该产品的买家也购买
Genesis Matrix Pro is a professional multi-timeframe trend detection indicator designed to help traders identify high-quality market alignment with clarity and structure. It combines 12 different technical indicators into one visual alignment matrix, allowing traders to quickly see when market conditions are bullish, bearish, or neutral. A signal is generated only when the selected strategies are aligned, helping reduce noise and improve decision-making. PLEASE CONTACT ME AFTER PURCHASE TO GET
Gann Made Easy
Oleg Rodin
4.83 (163)
Gann Made Easy 是一个专业且易于使用的外汇交易系统,它基于使用先生理论的最佳交易原则。 W.D.江恩。该指标提供准确的买入和卖出信号,包括止损和获利水平。您甚至可以使用推送通知在旅途中进行交易。 购买后请联系我,即可免费获得交易指导和超棒的额外指标! 您可能已经多次听说过江恩交易方法。通常 Gann 的理论不仅对于新手交易者而且对于那些已经有一定交易经验的人来说都是非常复杂的东西。这是因为江恩的交易方法在理论上并不那么容易应用。我花了几年时间来完善这些知识,并将最好的原则应用到我的外汇指标中。 该指标非常易于应用。您所需要的只是将其附加到您的图表并遵循简单的交易建议。该指标不断进行市场分析工作并寻找交易机会。当它检测到一个好的入口点时,它会为您提供一个箭头信号。该指标还显示止损和获利水平。 换句话说,当您像先生一样进行交易时,该指标会为您提供最佳江恩建议。江恩亲自告诉你此时此刻该做什么。但最好的部分是您不需要了解任何有关江恩交易原则的知识,因为该指标会为您完成整个市场分析工作。
The Propfolio Master Suite is the ultimate all-in-one analytical workstation for professional traders. Combining the power of the Beat The Market Maker (BTMM) methodology, Smart Money Concepts (SND/Liquidity), and Advanced Volume Profile, this suite replaces multiple different indicators with one optimized engine. Monitor up to 14 pairs simultaneously from a single chart, instantly identify market cycles, and seamlessly map institutional footprints with the click of a button. The Command Center
Scalper Inside PRO
Alexey Minkov
4.74 (69)
Scalper Inside PRO Scalper Inside PRO 是一款适用于 MetaTrader 4 的日内趋势与剥头皮指标,使用专有算法快速识别市场方向和关键目标价位。它能够自动计算进场价、出场价以及多级止盈目标,并显示详细的绩效统计,让您了解不同交易品种和策略以往的表现情况,从而帮助您为当前的市场环境选择最合适的交易工具。此外,您还可以将自己的箭头指标轻松接入 Scalper Inside PRO,快速评估其统计数据和历史表现。 该指标可用于任何交易品种和任何周期(建议在 M5 上进行日内交易),并内置多种交易策略,因此既可以作为独立的剥头皮工具使用,也可以作为您交易系统中功能强大的分析组件。 主要功能 通过专有算法(Next‑Generation Trend Detection Algorithm,NG TDA)快速识别当前市场趋势。 自动计算日内交易的进场价、出场价和多级止盈目标。 内置策略与统计模块,用于评估不同市场环境下各品种的表现。 支持接入自定义箭头指标(PRO 模式),并计算其详细信号统计数据。 适用于外汇、金属、指数、股票、商品、期货和加密货币等各类市
M1 Sniper
Oleg Rodin
5 (23)
M1 SNIPER 是一款易于使用的交易指标系统。它是一个专为 M1 时间框架设计的箭头指标。该指标可以作为独立的系统在 M1 时间框架下进行剥头皮交易,也可以作为您现有交易系统的一部分使用。虽然该交易系统专为 M1 时间框架交易而设计,但它也可以用于其他时间框架。我最初设计此方法是为了交易 XAUUSD 和 BTCUSD。但我发现这种方法在其他市场交易中也同样有用。 指标信号既可以顺势交易,也可以逆势交易。我教授一种特殊的交易技巧,帮助您利用指标信号进行双向交易。该方法基于使用特殊的动态支撑位和阻力位区域。 购买后,您可以立即下载 M1 SNIPER 箭头指标。此外,我还为所有 M1 SNIPER 工具用户免费提供下方屏幕截图所示的 Apollo Dynamic SR 指标!这两个指标的组合可以帮助您更轻松、更准确地利用 M1 时间框架进行交易。 购买后请联系我,免费获取交易提示和奖励指标! 祝您交易成功!
PRO Renko System
Oleg Rodin
5 (30)
PRO Renko Arrow Based System for trading renko charts.  准确的信号交易任何外汇工具. 另外,我将免费提供系统的附加模块! PRO Renko系统是RENKO图表上高度准确的交易系统。该系统是通用的。 该交易系统可应用于各种交易工具。 该系统有效地中和了所谓的市场噪音,打开了获得准确反转信号的通道。 该指标易于使用,只有一个参数负责产生信号。 您可以很容易地使算法适应您感兴趣的交易工具和renko酒吧的大小。 我很乐意通过提供任何咨询支持来帮助所有客户有效地使用该指标。 祝您交易成功!购买后,立即写信给我! 我将与您分享我的建议和我的renko发电机。 另外,我将免费提供系统的附加模块!
Auto Optimized Parabolic RSI: 高级 3D 动量引擎 大多数零售指标之所以失效,是因为它们依赖于静态输入,一旦市场波动率发生变化,这些输入就会崩溃。Auto Optimized Parabolic RSI 通过不断重新计算自身的数学优势,解决了“指标衰退”的问题,将机构级别的量化自适应能力直接引入您的 MT5 终端。 核心优势:定制的内存 3D 优化   标准的自动优化器通常会导致 MT5 平台卡顿,因为它们通过标准的指标调用使终端超载。该工具完全绕过了这些性能瓶颈。内部引擎采用定制的原生基于 RAM 的计算器构建,每次加载图表或更改时间周期时,它都会执行极速的 3D 网格搜索。它同时扫描 RSI 周期(频率)、SAR 步长(加速度)和 SAR 最大值(速度限制),在绝对的毫秒级时间内测试数以万计的参数组合,且完全不会拖慢您的平台。它不是仅仅寻找一个“不错”的设置,而是映射整个参数空间,以寻找资产当前动量结构的绝对全局最大值。 严格的财务评分与逼真的交易模拟   与基于抽象“指标点数”进行优化评分的业余工具不同,该引擎的 3.10 版本严格与资金数学挂钩。每
NAM Order Blocks
NAM TECH GROUP, CORP.
3.67 (3)
MT4多時限訂單塊檢測指示器。 特徵 -在圖表控制面板上完全可自定義,提供完整的交互。 -隨時隨地隱藏和顯示控制面板。 -在多個時間範圍內檢測OB。 -選擇要顯示的OB數量。 -不同的OB用戶界面。 -OB上的不同過濾器。 -OB接近警報。 -ADR高低線。 -通知服務(屏幕警報|推送通知)。 概括 訂單塊是一種市場行為,它指示從金融機構和銀行收取訂單。著名的金融機構和中央銀行帶動了外匯市場。因此,交易者必須知道他們在市場上正在做什麼。當市場建立訂單塊時,它會像發生大多數投資決策的範圍一樣移動。 訂單建立完成後,市場將朝著上升和縮小的方向發展。訂單大宗交易策略的關鍵術語是它包括機構交易者正在做的事情。由於它們是主要的價格驅動因素,因此包括機構交易在內的任何策略都可以。 您將在任何時間範圍內實時看到訂單塊,使用我們的控制面板,您將能夠在所選的歷史記錄週期內檢測常規,拒收和未大寫的訂單塊。 現在您可以接收到訂單塊接近警報,我們在MT4上顯示屏幕通知,並將通知推送到您的手機!
Smart Price Action Concepts
Issam Kassas
4.77 (13)
首先,值得强调的是,这个交易工具是非重绘、非重画和非滞后的指标,非常适合专业交易。 在线课程,用户手册和演示。 智能价格行动概念指标是一个非常强大的工具,既适用于新手,也适用于经验丰富的交易者。它将超过20个有用的指标合并到一个指标中,结合了高级交易思想,如内圈交易员分析和智能资金概念交易策略。该指标侧重于智能资金概念,提供有关大型机构交易方式的见解,帮助预测它们的动向。 它在流动性分析方面尤其擅长,有助于理解机构的交易方式。它擅长预测市场趋势,并仔细分析价格波动。通过将您的交易与机构策略对齐,您可以更准确地预测市场走向。该指标多才多艺,擅长分析市场结构,识别重要的订单区块,并识别各种模式。 它擅长识别BOS和CHoCH等模式,理解动量的转变,并突出显示供需强劲的关键区域。它还擅长发现强大的不平衡,并分析价格创造更高高点或更低低点的模式。如果您使用斐波那契回撤工具,该指标可以满足您的需求。它还可以识别相等的高点和低点,分析不同的时间框架,并通过仪表板显示数据。 对于使用更高级策略的交易者,该指标提供了工具,如公平价值差指标和优惠和折扣区域的识别。它特别关注高时间框架订单区块,并
Quants HL Break
Ferhat Mutlu
5 (2)
通過純價格行為進行高級計算,以找到 LH 和 HL 突破。 它會給你一個很好的市場反轉點。 LH 和 HL 信號也可用於 traingle 突破。 一旦突破發生,則表明強烈反轉。 移動平均線的漂亮過濾器。 我強烈建議將其與趨勢指標一起使用。 可用作支撐和阻力、供需指標的額外確認。 可以在以下外匯線程中找到更多詳細信息: 該指標未重新繪製。 Buffers :   SetIndexBuffer ( 0 ,UpBar);      SetIndexBuffer ( 1 ,UpBar2);           SetIndexBuffer ( 2 ,DnBar);      SetIndexBuffer ( 3 ,DnBar2);           SetIndexBuffer ( 4 ,UpBarTop);      SetIndexBuffer ( 5 ,UpBarLow);                    SetIndexBuffer ( 6 ,DnBarTop);      SetIndexBuffer ( 7 ,DnBarLow);           SetIn
Dynamic Forex28 Navigator
Bernhard Schweigert
4.43 (7)
Dynamic Forex28 Navigator - 下一代外汇交易工具。 当前 49% 折扣。 Dynamic Forex28 Navigator 是我们长期流行的指标的演变,将三种功能合二为一: 高级货币强度 28 指标 (695 条评论)+ 高级货币 IMPULSE 带警报 (520 条评论)+ CS28 组合信号(奖励)。 有关指标的详细信息 https://www.mql5.com/en/blogs/post/758844 下一代强度指标提供什么? 您喜欢的原始指标的一切,现在通过新功能和更高的精度进行了增强。 主要特点: 专有货币强度公式。  所有时间范围内的平滑和准确的强度线。 非常适合识别趋势和精确进入。 动态市场斐波那契水平(市场斐波那契)。  此指标独有的独特功能。 斐波那契应用于货币强度,而不是价格图表。 适应实时市场活动以获得准确的反转区域。 实时市场动量。  第 9 行显示市场是活跃还是被动。 对于定时交易至关重要。 全面的警报和显示。  每种货币最强的买入和卖出动量。 ​​28 对的双重动量买入和卖出。 超买/超卖警告外部范围和止损。 反转
PZ Harmonacci Patterns
PZ TRADING SLU
3.17 (6)
可以说,这是您可以为MetaTrader平台找到的最完整的谐波价格形成自动识别指标。它检测19种不同的模式,像您一样认真对待斐波那契投影,显示潜在的反转区域(PRZ),并找到合适的止损和获利水平。 [ 安装指南 | 更新指南 | 故障排除 | 常见问题 | 所有产品 ] 它检测19种不同的谐波价格形态 它绘制了主要,衍生和互补的斐波那契投影(PRZ) 它评估过去的价格走势并显示每个过去的形态 该指标分析其自身的质量和性能 它显示合适的止损和获利水平 它使用突破来表明合适的交易 它在图表上绘制所有样式比率 它实现了电子邮件/声音/视觉警报 受斯科特·M·卡尼(Scott M. Carney)的书的启发,该指标旨在满足最纯粹和最熟练的交易者的需求。但是,它采取了一种使交易更容易的方式:在向交易发出信号之前,它会等待Donchian朝正确方向突破,从而使交易信号非常可靠。 斐波那契投影与向量无关 它实现了电子邮件/声音/推送警报 它绘制了ABCD投影 重要提示: 为了符合 Scott M. Carney先生 的商标申诉,某些图案名称已重命名为不言自明的替代方式, Scott M.
RFI levels PRO
Roman Podpora
5 (1)
该指标能够准确显示反转点和价格回落区域。     行业领军人物 。您能洞察新趋势的形成,并以最高的精准度做出决策,掌控每一笔交易。 与……结合时,展现其最大潜力     趋势线专业版   指标  VERSION MT5 该指标显示的内容: 新趋势开始时的反转结构和反转水平及其激活。 显示屏   获利了结   和   止损   风险回报比最低的水平     RR 1:2       。 具有智能减值逻辑的止损。 显示指定指标中两种趋势类型的反转形态。 指标: 根据     趋势线     (全球趋势变化) 潮流专业版     (趋势快速变化) 简单有效   扫描器   实时趋势(新增)。 多时间框架工具筛选。 展示   利润   在 LOGIC AI 信号之后。 以下列出今日走势积极的金融工具。(RB键) 能够为终端启用通知(警报)功能,并向移动设备推送通知。 逻辑人工智能     — 利用人工智能寻找最佳切入点。 只有在启用 MTF(多时间框架分析)模式时,该功能才可用。 兼容性。 当与趋势线指标结合使用时,该指标能发挥其最大潜力。 这     RFI LEVELS PRO    
Trend Catcher ind
Ramil Minniakhmetov
趨勢捕捉指標 趨勢捕捉指標結合了作者獨有的客製化自適應趨勢分析指標,用於分析市場價格趨勢。它透過過濾掉短期噪音,並專注於潛在的動能強度、波動性擴張和價格結構行為,來識別真實的市場方向。此外,它還結合了平滑和趨勢過濾等客製化指標,例如移動平均線、相對強弱指標 (RSI) 和波動率過濾器。 您可以在這裡查看實際運行情況以及我的其他產品: https://www.mql5.com/en/users/mechanic/seller 請注意,我不會在 Telegram 上出售 EA 或任何設置,那是騙局。所有設定都可以在我的部落格上免費取得。 重要提示!購買後請立即聯繫我,以獲取使用說明和額外獎勵! 請注意,我不會在 Telegram 上出售 EA 或任何設置,那是騙局。所有設定都可以在我的部落格上免費取得。
Apollo SR Master
Oleg Rodin
5 (2)
Apollo SR Master 是一款支撑/阻力指标,其特殊功能使利用支撑/阻力区域进行交易更加便捷可靠。该指标通过检测局部价格顶部和底部,实时计算支撑/阻力区域,没有任何时间延迟。为了确认新形成的支撑/阻力区域,该指标会显示特殊信号,表明该支撑/阻力区域可以作为实际的卖出或买入信号。在这种情况下,支撑/阻力区域的强度会增强,因此从该区域进行交易的成功率也会更高。这正是该指标的核心理念。 SR区域也使止损和止盈的操作更加便捷。根据信号方向,可以将SR区域上方或下方的空间用作止损位。此外,相对的SR区域也可以用作潜在的止盈区域。 我还免费向所有 Apollo SR Master 指标的用户提供我的“Apollo 价格行为系统”指标。这两个指标结合使用将帮助您找到更好的入场点。 购买后请联系我,即可免费获得我的交易技巧以及我的“阿波罗价格行为系统”指标作为赠品!
Grabber System
Ihor Otkydach
5 (2)
向您介绍一款优秀的技术指标——Grabber,它是一套即开即用的“全包式”交易策略。 在一个代码中集成了强大的市场技术分析工具、交易信号(箭头)、提醒功能和推送通知。 每位购买该指标的用户还可免费获得以下内容: Grabber辅助工具:用于自动管理已开仓位 视频操作指南:逐步教学如何安装、设置和使用该指标进行交易 原创Set文件:可快速自动配置,帮助实现最佳交易效果 忘掉其他策略吧!只有Grabber能够真正激励你在交易中攀登新高峰! Grabber策略的主要特点: 交易周期:从M5到H4 适用资产:任意,但我推荐我亲自测试过的品种(GBPUSD、GBPCAD、GBPCHF、AUDCAD、AUDUSD、AUDSGD、AUDCHF、NZDUSD、NZDCAD、EURCAD、EURUSD、EURAUD、EURGBP、EURCHF、USDCAD、USDSGD) 交易时间:全天候 24/7 交易类型:波段交易(反转系统)
Advanced Supply Demand
Bernhard Schweigert
4.91 (300)
现在优惠 40%! 任何新手或专业交易者的最佳解决方案! 该指标是一款独特、高质量、且价格合理的交易工具,因为我们已经整合了许多专有功能和新公式。 依据此更新,您将能够显示双重时间帧区域。 您不仅可以显示一个较高的时间帧,还可以同时显示图表时间帧,加上更高的时间帧:显示嵌套时区。 供需双方所有交易者都会喜欢它。 :) 重要信息披露 高级供需的最大潜力,请访问 https://www.mql5.com/zh/blogs/post/720245   想象您的交易如何得以改善,是因为您能够精准定位入场或目标位吗? 构建于新的底层算法,它可以更轻松地识别出买卖双方之间的潜在失衡。 这是因为它以图形方式展示供需最强劲区域,及其过去的表现(显示旧区域)。 这些功能旨在帮助您更轻松地发现最佳入场区域和价位。 现在您可以针对您的交易品种和时间帧来优化和编辑区域强度! 高级供需指标适用于所有产品和时间帧。 它是一个新的公式,非常新的功能是两个区域强度函数可由用户输入进行调整! 这在交易中是一大优势。 当您学习如何使用专有功能,例如带有价格游离最小 X 因子的区域强度时,您能够判断该区域强劲与否。 供需
GoldRush Trend Arrow Signal
Kirk Lee Holloway
5 (2)
GoldRush 趨勢箭頭信號 GoldRush 趨勢箭頭信號 指標為 XAU/USD 中的高速、短期短線交易者提供精確、實時的趨勢分析。 專為1分鐘時間框架設計,此工具顯示方向箭頭以明確顯示入場點,使短線交易者能在波動市場中自信操作。 該指標包含主要和次要警示箭頭。主要信號為白色和黑色方向箭頭,用於指示趨勢方向的轉變;次要信號為藍色和紅色箭頭,用於確認主要箭頭指示的方向並提示潛在交易入場點。 注意:當趨勢方向發生變化後僅出現一個主要警報箭頭時,請注意可能會出現多個次要藍/紅箭頭。次要信號將在滿足信號標準的任何蠟燭圖後出現,因此在長期趨勢移動中,螢幕上將顯示大量次要箭頭(如附帶的截圖所示)。您可在設置中開啟或關閉任一箭頭類型。 以下是我使用此指標進行交易的方式: - 對於買入入場,我會耐心等待白箭頭在蠟燭收盤時出現,並在下一根可用蠟燭收盤時出現藍箭頭時進行買入交易。 - 對於賣出入場,我會耐心等待黑箭頭在蠟燭收盤時出現,並在下一根可用蠟燭收盤時出現紅箭頭時進行賣出交易。 - 獲利了結/止損設置由使用者自行負責,但我個人使用最低R:R為1:2,並發現這在倫敦/紐約開盤等
Introduction to Fractal Pattern Scanner Fractal Indicator refers to the technical indicator that makes use of the fractal geometry found in the financial market. Fractal Pattern Scanner is the advanced Fractal Indicator that brings the latest trading technology after the extensive research and development work in the fractal geometry in the financial market. The most important feature in Fractal Pattern Scanner is the ability to measure the turning point probability as well as the trend probabi
Advanced Currency Strength28 Indicator
Bernhard Schweigert
4.91 (657)
目前40%的折扣 任何新手或专家交易者的最佳解决方案! 这个指标是一个独特的、高质量的、可负担得起的交易工具,因为我们纳入了一些专有的功能和一个新的公式。只需一个图表,你就可以读出28个外汇对的货币强度!想象一下,你的交易将如何得到改善,因为你的交易是在你的手中进行的。想象一下,你的交易将如何改善,因为你能够准确地确定新趋势或剥头皮机会的触发点? 用户手册:点击这里  https://www.mql5.com/en/blogs/post/697384 这是第一本,原版的! 不要买一个毫无价值的崇拜者的克隆品。 特别的 子窗口中的箭头显示强劲的货币势头GAP将指导你的交易! 当基础货币或报价货币处于超卖/超买区域(外盘斐波那契水平)时,在个人图表的主窗口中出现警告信号。 当货币力量从外围区间回落时,回撤/反转警报。 十字星模式的特别警报 可选择多个时间框架,以快速查看趋势! 货币强度线在所有的时间框架中都非常平稳,当使用较高的时间框架来识别总体趋势,然后使用较短的时间框架来确定精确的入口时,效果非常好。你可以根据自己的意愿选择任何时间框架。每个时间框架都由其自身进行了优化。
Cycle Sniper
Elmira Memish
4.39 (36)
Please contact us after your purchase and we will send you the complimentary indicators to complete the system Cycle Sniper is not a holy grail but when you use it in a system which is explained in the videos, you will feel the difference. If you are not willing to focus on the charts designed with Cycle Sniper and other free tools we provide, we recommend not buying this indicator. We recommend watching the videos about the indiactor and system before purchasing. Videos, settings  and descri
Market Structure Patterns MT4
Samuel Manoel De Souza
5 (18)
Market Structure Patterns   is an indicator based on   smart money concepts   that displays   SMC/ICT   elements that can take your trading decisions to the next level. Take advantage of the   alerts ,   push notifications   and   email messages   to keep informed from when an element is formed on the chart, the price crosses a level and/or enters in a box/zone. Developers can access the values of the elements of the indicator using the   global variables  what allows the automation of trading d
Advanced UT BOT ALERTS for MT4 專業多重濾波趨勢識別系統|強化版 UT BOT 引擎 我們只提供高品質的指標。 Advanced UT BOT 為專業交易者設計,採用穩定的信號邏輯與安全運算結構,確保無延遲與錯誤更新。 它 不會重繪、不會重畫、不會刪除或修改 任何過去的信號。 所有 BUY 和 SELL 信號均在 K 線收盤後生成並固定 ,確保穩定性與準確性。 在即時行情中 不會重繪 ,信號會在收盤後即時出現。 限時優惠中 —— 下一次價格將調整為 49 美元。 請把握現在的優惠價格,售完即漲。 產品概述 Advanced UT BOT ALERTS   是新一代的趨勢信號系統,基於   UT BOT   的核心邏輯重新打造, 全面升級為 MT5 版本,融合多重濾波、動態視覺化與高精度警報系統。 UT Bot 指標最初由   Yo_adriiiiaan   開發,本版本由   PioneerAlgoFX   團隊深度強化, 在穩定性、精準度與自訂性方面均達到專業級水準,為實戰交易者而設計。 此系統能夠高精準地識別趨勢反轉與動能變化, 透過多層動態濾波與
购买后请联系我,获取基于此指标的奖励EA。 Self Optimizing Double MA Strategy 是一款专业级别的交易工具,旨在消除参数猜测。它由内置的自动优化引擎驱动,通过在后台模拟数千种参数组合,不断适应不断变化的市场条件,从而保持统计上的优势。 该指标不依赖于静态、过时的设置,而是动态更新其内部逻辑,为当前的时间周期和交易品种寻找最赚钱的配置。 核心功能 内置自动优化:系统会根据您选择的更新频率,定期重新计算快速 MA、慢速 MA 和 RSI 的周期,确保您的设置始终与当前的市场节奏保持一致。 MA 发散过滤器:一项核心的趋势强度指标,仅在移动平均线积极发散时才确认信号的有效性。这可以防止在均线收敛或平缓的盘整市场中产生虚假的入场信号。 时序评分引擎:内部模拟器在图表上绘制任何实时信号之前,会根据您的具体目标(例如最大化利润因子或最小化回撤)对历史信号进行评估。 动态 ATR 区域:根据实时市场波动率,自动计算并在图表上直观地投射出止盈和止损区域。 实时绩效仪表板:直接在您的图表上跟踪并显示实时的系统指标,包括历史胜率、平均回撤以及产生的总点数。 完美支持 EA
Day Trader Master
Oleg Rodin
5 (15)
Day Trader Master 是一个完整的日间交易者交易系统。该系统由两个指标组成。一个指标是买入和卖出的箭头信号。这是你得到的箭头指示器。我将免费为您提供第二个指标。第二个指标是专门设计用于与这些箭头结合使用的趋势指标。 指标不重复也不迟到! 使用这个系统非常简单。您只需按照当前趋势方向的箭头信号,显示为双色线。蓝色是买入趋势。红色是一种销售趋势。蓝色箭头是买入信号。红色箭头是卖出信号。您需要箭头的颜色和信号的方向来匹配趋势线的颜色。 箭头指标主要是为 M5 和 M15 时间间隔的日内交易而创建的。但从技术上讲,该系统可以用于其他时间间隔。 指示器配备带有推送消息功能的弹出警报。 购买后一定要写信给我!我将为您提供与系统交易的个人建议,以及我的趋势指标。此外,还有丰厚的奖励等着您!
Candle Power Pro
Thushara Dissanayake
4.5 (8)
这   蜡烛电源专业版   是一款旨在解码的复杂交易工具   实际成交量压力、报价数据不平衡以及机构订单流动态   通过测量   牛市蜱虫与熊市蜱虫之间的斗争   实时。该指标将原始   成交量数据转化为可操作的见解 ,帮助交易者识别   智能货币运动、流动性追逐和隐藏的市场心理   在每个价格 K 线图背后。通过分析   买方/卖方成交量百分比、分歧模式和基于成交量的确认 ,它弥补了   价格行为和交易量分析 ,对于关注以下交易者来说非常有价值     ICT、SMC 和机构交易方法 。 与传统的成交量指标不同,     蜡烛电源专业版   专注于   报价数据粒度 ,揭示每根蜡烛的走势是否与标的一致   牛市/熊市强度   或发出潜在信号   做市商陷阱、逆转或突破延续 。它与   基于时段的策略(伦敦/纽约杀戮地带)、公允价值缺口(FVG)和区间突破 ,提供对   市场流动性和参与者意图 。 工作原理: 指标流程   实时报价量数据 ,计算百分比   看涨交易与看跌交易   每根蜡烛内。这揭示了: 买家/卖家不平衡:     看跌蜡烛图上牛市跳动百分比较高,警告   潜在的逆
如果您进行外汇交易,了解货币强弱和货币对相关性等详细信息,可以让您的交易更上一层楼。通过相关性分析,您可以将风险减半,而强弱分析将帮助您最大化利润。 本指标通过结合货币强弱分析和货币对相关性,提供了一种混合的方法,帮助选择最合适的货币对进行交易。 如何使用货币强弱分析 假设您的交易策略在AUD/JPY上提供了买入机会,但通过KT货币强弱分析发现JPY比AUD更强。那么,这笔交易很可能以亏损告终。有了这个指标,您可以轻松避免此类亏损。 如何使用货币对相关性 假设您的交易策略同时在NZD/USD和GBP/JPY上提供了卖出机会。通过KT货币对相关性功能,您发现这两个货币对的相关性达到77%。  由于这些货币对高度相关,同时交易它们只会加倍您的风险。如果在NZD/USD上出现亏损,GBP/JPY上的交易也很有可能出现亏损。 功能特点 快速识别最强和最弱货币,用以验证交易策略生成的交易机会。 通过避免交易高度相关的货币对,将风险降低一半甚至三分之一。 当某个货币成为最强或最弱时,接收警报通知。 通过货币金字塔分析强弱报告,将货币按强到弱进行排序。 详细了解货币强弱分析 货币强弱分析通
Route Lines Prices -  是一款用于寻找价格方向的指标。其简洁的界面包含多种价格行为和未来方向计算算法。这些算法包括基于所用时间周期的波动率计算和价格平滑。 该指标只有一个参数,用于更改“ Calculating price values ”。默认值 1 提供均衡的自动计算, 无需手动配置即可使用。 通过手动更改 2 到 500 之间的值,您可以根据自己的交易系统自定义指标。 建议在 M1 到 H4 的时间周期内使用此指标。适用于任何交易品种。 信号箭头在蜡烛图收盘时生成;不会重绘历史数据。 主图表上提供重复箭头。 提供多种类型的警报。内置的线轨迹计数器基于收盘价工作。这意味着,当出现相反信号时,会确定价格轨迹的数值,并在信号结束后的下一根蜡烛图上显示这些数值。 总计数器将获得的值相加,以便在相应的图表上方便地调整参数。
KURAMA GOLD SIGNAL PRO(MT4版)— 7层过滤器、自动TP/SL、品质评分搭载 XAUUSD完整交易系统 不重绘。不重画。不延迟。每个信号永久固定。所见即所得。 福利:购买买断版许可证可免费获得 AI Zone Radar(价值$59)+ 完整PDF手册。购买后请给我发消息。 AI Zone Radar: https://www.mql5.com/en/market/product/175834 交易员的信赖:已被活跃的黄金交易员社区使用。因精度和易用性获得赞誉。 你的问题 — 以及解决方案 你知道黄金每天波动$30-50。你知道这里有钱可赚。但是: - 入场过早,价格反向$10后才朝你的方向走 - 每次MA触碰都入场,结果一半都失败 - 没有TP/SL系统,所以持仓太久或离场太早 - 在死寂时段交易,然后想为什么什么都不顺 KURAMA GOLD SIGNAL PRO解决了这一切。不是用一个过滤器,而是七个。 工作原理 — 3步 1. 图表上出现箭头信号 2. 在面板上查看TP价格、SL价格、品质评分、风险回报比 3. 下单并等待 无
头肩形态是一种图表形式,类似于具有三个峰的基线,外部两个峰的高度接近,中间峰最高。它可以预测牛市到牛市的趋势反转,并且被认为是最可靠的趋势反转模式之一。它是几种顶部模式之一,以不同程度的准确性发出趋势即将结束的信号。 [ 安装指南 | 更新指南 | 故障排除 | 常见问题 | 所有产品 ] 清除交易信号 可自定义的颜色和尺寸 实施绩效统计 可定制的斐波那契回撤水平 显示适当的止损和获利水平 该指标可用于查找连续或反转形态 它是不可重涂和不可重涂的 它实现了电子邮件/声音/视觉警报 设置 将指标加载到任何图表时,将显示一组选项作为输入参数。如果您认为它们太多,请不要感到失望,因为参数被分组为不言自明的块。这就是每个参数块的作用。 幅度-幅度表示替代价格点之间的最小柱线量。要找到大图案,请增加幅度参数。要查找较小的模式,请减小幅度参数。您可以在图表中多次加载具有不同幅度的指标。 闵。回撤-形态中所需的最小斐波那契回撤。设置为零不对其进行评估。 最大。回撤-形态中可能的最大斐波那契回撤。设置为零不对其进行评估。 领口扁平率-此参数描述图案领口必须如何“平坦”。 最大历史柱线-指标在图
作者的更多信息
The indicator alerts you when the market price crosses MA line. You can choose any MA line to use via the parameter input tab (see the screenshot below). Parameters (the same as the four parameters you have to choose when you add MA line on a chart): ma_period ma_shift  ma_method (0=Simple; 1=Exponential...) ma_apply (0=Close; 1=Open; 2=High; 3=Low...)  When the price crosses MA line, it will alert you with a message looking as follows: "Price crossing DOWN MA line, pair: EURUSD Period: 60" or "
This is a free demo version for USDJPY only. Here is the link to full version: https://www.mql5.com/en/market/product/25912 This product has no input parameters. The product helps you to open and close orders faster, include instant and pending orders. It helps you to open order faster and easier, to make an order you simply click on the button. Buttons List BUY/SELL: to open instant Buy or Sell orders. BUY STOP/BUY LIMIT/SELL STOP/SELL LIMIT: to open pending order. The distance to the current
FREE
This is an indicator that helps you to see what symbols have the best SCORE of SWAP and SPREAD. The SCORE is calculated as follows: SWAP/SPREAD. So, the higher SCORE/SPREAD symbols have, the better (because everyone wants their orders to have positive swap, while keeping spread small). This indicator will help traders have an advantage in swap when choosing symbols and type (buy or sell) to make an order. You can see (in the picture) that this indicator shows a list of symbols with their score b
MA CROSS ALARM
Cuong Pham
1 (1)
This indicator will help you show signals when the fast MA and slow MA (moving average) cross. The signals are displayed as up and down arrows (see picture). It can also give you a Pop Up Alert or Notification on your Phone or sending you an Email to inform the signal (this mode can be turned on/off in parameters). There are 2 MA crossovers to use: fast MA1 crosses slow MA1  fast MA2 crosses slow MA2 And there is one more MA line, MA3, to filter alert. When fast MA1 crosses slow MA1, the signal
MA ANGLE
Cuong Pham
MA_Angle calculates the angle value between MA line and horizontal line at every bar on the main chart. Suppose that there is a bar number n . MA line is specified by a line segment (view the screenshots below, that is the Red line connecting MA point value at bar n and bar number n+1 ). This indicator shows you the strength of the market trend (up or down). You can customize how angle is displayed by "alertAngle" parameter (view the screenshots below). The default angle value is 30 degrees. It
HC ARROW
Cuong Pham
The indicator shows you buy/sell signals and does not repaint. It works well with almost all pairs, while the best ones are GBPUSD, XAUUSD and EURUSD. The product works better on H1 and H4. You can change the parameters in the inputs tab to get the best signals and the best trade results on each pair. You can enable/disable alerts when signal appears. The indicator is easy to use. Parameters barstrip & Sensitive: amount of bars to process the highest and lowest prices (relates to the internal l
The indicator shows you time remaining till completion of the current candlestick of any timeframe you chose, showing struct (see details). Minute: second. The indicator has 3 parameters: TF - this parameter will help you choose timeframe you want, for example, if you want to show remaining time for M30, set TF=30. If you want to show remaining time of the current period you are seeing on chart, set TF=0 (like in default). Local - this parameter will help you choose location on the chart where t
The indicator help you to do alert when two MA lines cross action You can choose all parameters for two these MA lines to use via parameter input tab (see screenshot below). Parameters Same as 4 parameters you have to choose when you add MA line on chart. Fast MA:  ma1_period ma1_shift  ma1_method (0=Simple; 1=Exponential...) ma1_apply (0=Close; 1=Open; 2=High; 3=Low...)  Slow MA: ma2_period ma2_shift  ma2_method (0=Simple; 1=Exponential...) ma2_apply (0=Close; 1=Open; 2=High; 3=Low...)  When f
The indicator alerts you when 3 MA lines cross UP/DOWN (see the screenshot below). You can choose all parameters for these 3 MA lines to use via parameter input tab. Parameters Same as 4 parameters you have to choose when you add MA line on the chart. Fast MA:  ma1_period ma1_shift  ma1_method (0=Simple; 1=Exponential...) ma1_apply (0=Close; 1=Open; 2=High; 3=Low...)  Medium MA: ma2_period ma2_shift  ma2_method (0=Simple; 1=Exponential...) ma2_apply (0=Close; 1=Open; 2=High; 3=Low...)  Slow MA:
The EA created based on this strategy: This EMA crossover trading strategy is made with MACD. For MACD, you can avoid false signals from this EMA crossover. With this strategy, you can get more accurate signals. So this is more profitable . Strategy required FAST EMA SLOW EMA MACD with default setting How Signals come Buy Signal: When FAST EMA cross SLOW EMA from lower to upper, then you have to wait for MACD confirmation. After crossover, when you see MACD above 0.0 level, then you can take buy
This EA will help you to automatically put stop loss and take profit for all your orders. Stop loss point and take profit points can be selected in the tab of the input parameters. You can specify three symbols with SL and TP values (you can see symbol1 , symbol2 ... in the input tab below). The EA performs checks. If a new order with symbol1 appears, it puts SL and TP with stoploss1 and takeprofit1 values (in points). If a new order with symbol2 appears, it puts SL and TP with stoploss2 and tak
The indicator helps you to draw Ask line on the current chart and show the current spread. So, it helps you to do scalping trade easier. See the video below. It shows you how it works. Parameters line_color – Ask line color text_size – text size of spread value text_color – color of spread value Thank you! If you have any question, please contact me via Skype: cuongph149, or email: hungcuongkhmt51@gmail.com
Strategy requirements You need to set-up the chart manually for this strategy. You need three mt4 default indicator: FAST EMA (Exponential Moving Average of the close price) SLOW EMA (Exponential Moving Average of the close price) CCI (Commodity Channel Index) Buy signal: When FAST EMA is above the SLOW EMA, you can take buy when CCI crosses 0.0 level from bottom to top. Sell signal: When FAST EMA is below the SLOW EMA, you can take sell entry when CCI crosses 0.0 level from top to bottom . The
This indicator will help you to show ALL history trading statistics of any account you want. You just need to add it on any chart, and it will calculate important information from history of trading to help you to analyze trading result. It will help you to save your time to analyze any account's trading result, you will see win/lose rate of all trades on all pairs, trades number of all pairs, total lot on each pair, total lots on all pairs, total win/lose on this account... So, you will know wh
This utility tool help you to close all orders or apart of all (you can choose which symbol you want) immediately with only ONE CLICK, its work very fast ,so it will helpful for you in your trading to manage trading faster. If you want to close all orders, you just need to let symbol parameter is blank (like in default setting). If you want to close all orders of one pair (for example EURUSD orders) you need to put symbol =EURUSD (see screenshot below). This is a script, so its will be putted in
This utility tool help you to close all orders having profit immediatly with only ONE CLICK, its work is very fast. You can choose which symbol you want or close all symbols so it will helpful for you in your trading to manage trading faster. If you want it work on all symbols, you just need to leave symbol parameter blank (like in default setting). If you want it work on 1 symbol only (for example EURUSD orders) you need to put symbol =EURUSD (see screenshot below). This is a script, so its wil
This utility tool help you to close all orders which is having loss immediatly with only ONE CLICK, its work is very fast. You can choose which symbol you want or close all symbols so it will helpful for you in your trading to manage trading faster. If you want it work on all symbols, you just need to leave symbol parameter blank (like in default setting). If you want it work on 1 symbol only (for example EURUSD orders) you need to put symbol =EURUSD (see screenshot below). This is a script, so
The MACD ALERT 4 COLORS is an indicator, that helps you to check MACD's value changes easily with 4 clear colors: when MACD grows up and above 0, it will have green color when MACD goes down and still above 0, it will have white color when MACD goes down and below 0 value, it will have red color when MACD grows up and below 0 value, it will have yellow color The indicator also generates alerts for you, with two alert types (see screen shot): Alert1 : (true/false) the alert will trigger when MACD
The indicator alerts you when the market price crosses your line level (adjustable). You can change color, thickness and default pip distance for the line via the parameter in input tab (see the screenshot and video below). Parameters line_color : color for the line to be drawn line_thickness : thickness of the line sound : name of sound file if you want it to play at crossing time default_distancepip : at the first times you add the indicator on chart, it will use this param to draw the line w
This product has no input parameters. The product helps you to open and close orders faster, include instant and pending orders. It helps you to open order faster and easier, to make an order you simply click on the button. Buttons List BUY/SELL: to open instant Buy or Sell orders. BUY STOP/BUY LIMIT/SELL STOP/SELL LIMIT: to open pending order. The distance to the current price is "Dis" (below of these buttons). SL/TP: Distance in point far from the current price, to put stop loss and take prof
This tool will help you hide your stoploss and takeprofit prices of all trades, it will manage them to close your trade when market price reached these levels. And it will replace all these StopLoss, TakeProfit levels for trades when you removed it, so you don't need to worry about missing your StopLoss, TakeProfit level when you remove it. It draw a button for you to control On/Off of working, you can see your SL,TP and modify it easy by the way turn Off the button, then drag your SL,TP price,
The tool will help you to hide your pending orders (buy/sell limit; buy/sell stop) To run it, you just need to add it on any chart (only 1 chart needed). So, when you make any pending order, it will remember that order (with price to open, lot number, symbol, your stop loss, take profit....) then, it will delete your pending order (hide it with broker). And it will make trade when market price reached the open price of your pending order, will all same parameters get from your old pending order.
This is a support tool that will notify you when the price crosses a trend line, you can draw any trend line by manual, and you can change or drag it on chart in working time This tool will automatically update the new location of the trend line to alert you How to use: after added it on chart, you will draw a trend line and set name of the trend line same as in input of the tool (the parameter LineName ) There are 3 notification methods : Pop Up Alert, Send Email or Notification You can choose
This is a support tool that will notify you when a fast MA (Moving Average) Line crosses a slow MA Line, you can choose any fast MA Line and slow MA Line by parameters in input tab The Indicator will draw a red arrow where fast MA line crosses DOWN slow MA line and it will  draw a green arrow where fast MA line crosses UP slow MA line There are 3 Alert methods : Pop Up Alert, Send Email or Notification You can choose true or false to use or not for any Alert method in input tab You can choose Al
筛选:
无评论
回复评论