Flat finder
- 指标
- 版本: 1.0
- 激活: 5

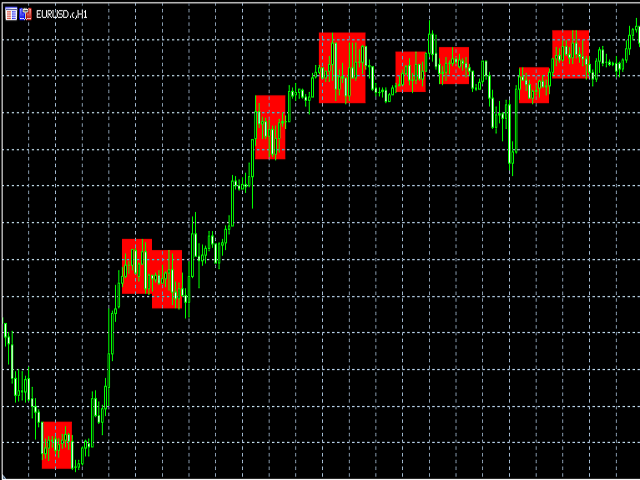
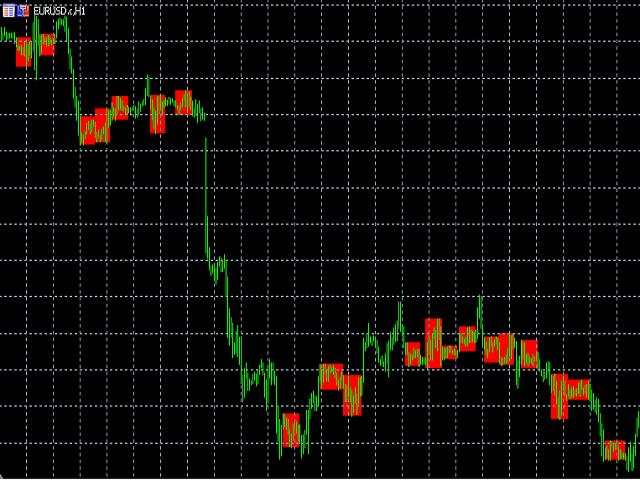
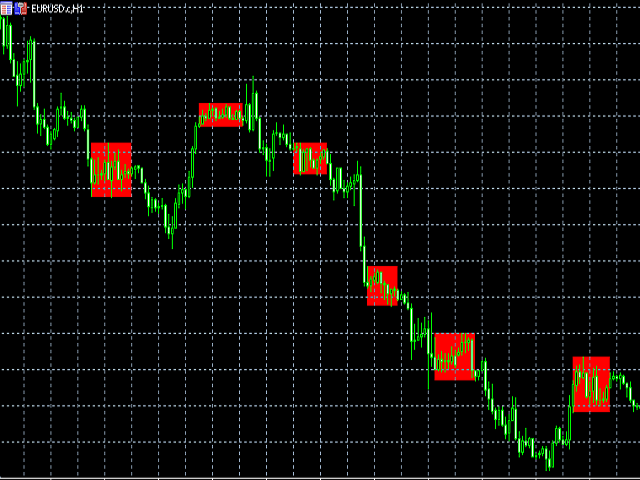
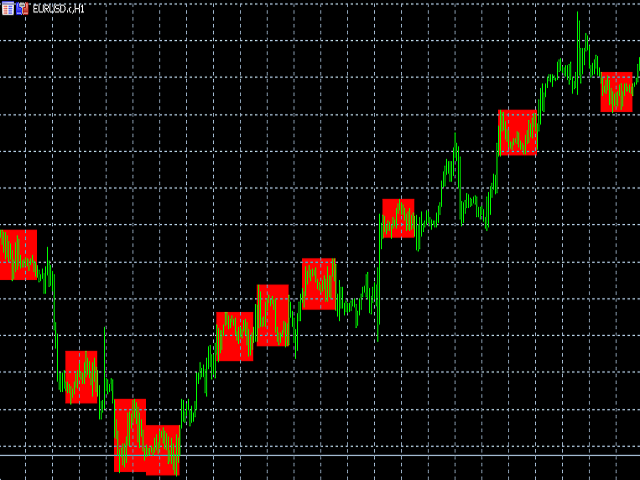
该指标检测平仓,并在发现的区域画上一个彩色的矩形。
该指标的主要思想是,当价格填满图表上的某个区域时,检测出一个平盘。
输入参数:
Color rectangle - 要着色的矩形的颜色。
Bars in rectangle - 矩形中允许的最小条数。
Density in % - 扁平的密度,设置为矩形区域的百分比。
__________________________________________________________________
__________________________________________________________________
________________________