Wall of worry MT5
- 指标
-
Illia Zhavarankau
 I program in MQL4 trading robots. I am looking for interesting people who are interested in this direction.
I run my blog https://botrader.org. - 版本: 1.0
- 激活: 5
Description:
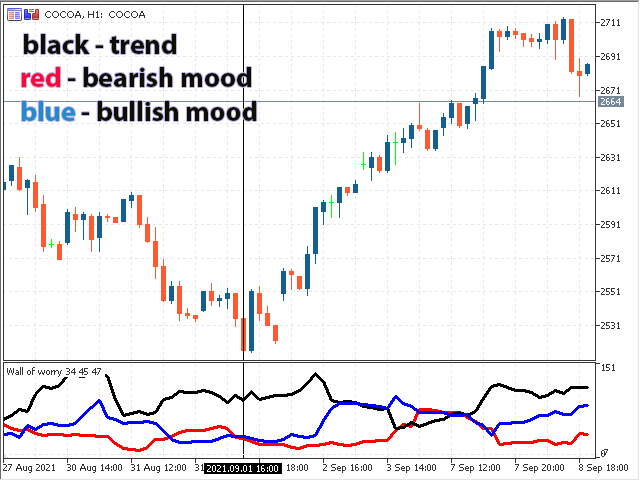
The Wall of Worry indicator allows you to assess market sentiment and possible reversals. The indicator represents three lines that are displayed in a separate window.
Black line (trend) - the amount of volumes in the candle body.
Red line (bears) - the amount of volumes in the upper shadow of the candlestick.
Blue line (bulls) - the amount of volumes in the lower shadow of the candle.
The idea is based on "Wall of Worry" - this is the periodic tendency of financial markets to overcome many negative factors and continue to grow.
The indicator is calculated based on tick volumes in the terminal. Then they are converted into horizontal volumes, then the lines themselves are calculated.
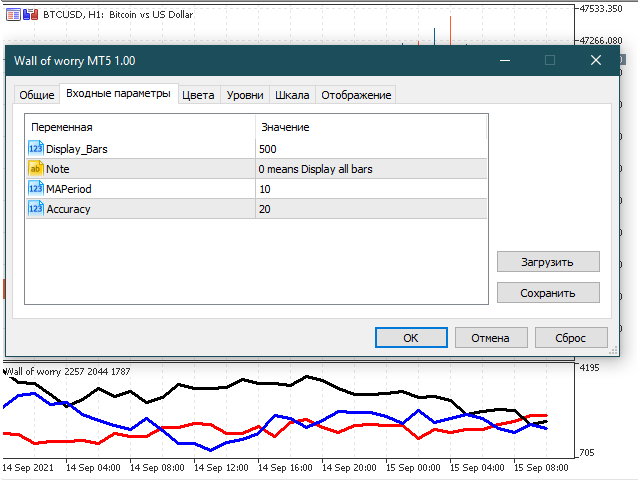
Input parameters:
Display_Bars = 500 - the number of displayed bars (at 0, all are displayed, but not always because it depends on the depth of history).
MAPeriod = 10 - period for calculating the moving average
Accuracy = 20 - calculation accuracy. The higher, the more accurate, but at the same time the load on the processor increases.
It can be used to determine:
- trend direction;
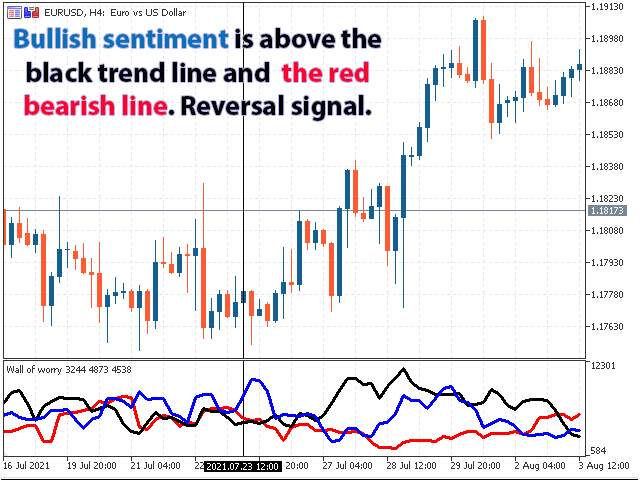
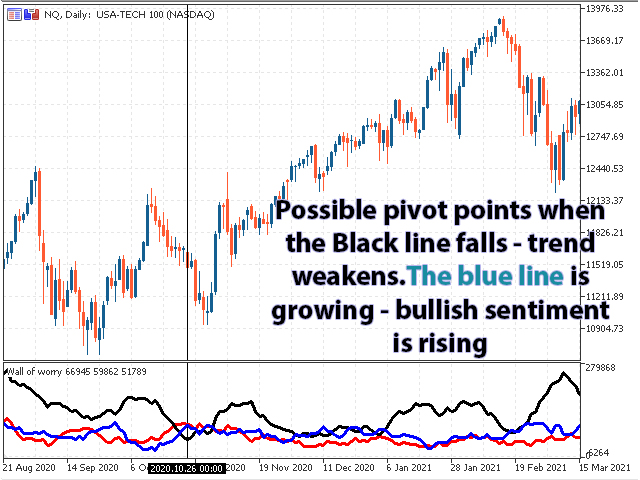
- identification of potential reversal points;
- the prevalence of market sentiment.