GDS Renko Mirror MT5 Multi-Scale Renko Structure Comparison for MetaTrader 5 GDS Renko Mirror MT5 is a premium Renko context indicator for MetaTrader 5. It helps traders compare Renko market structure across different brick sizes and read whether movement looks clean, noisy, aligned or fragmented. The purpose of Mirror is not to generate buy or sell signals. The purpose is to help the trader understand how the same market movement appears through different Renko scales before making a manual dec
Hi Traders, A clean and lightweight Linear Regression Channel indicator designed for precise trend and volatility analysis. The channel is calculated using true linear regression, providing a statistically accurate best-fit trend line with adaptive upper and lower bands based on standard deviation Key Features: True linear regression calculation (not a simple moving average) Adjustable regression period and channel width Multiple price options (Close, Open, High, Low, Median, Typical, Weighted)
Mine Farm is one of the most classic and time-tested scalping strategies based on the breakdown of strong price levels.
Mine Farm is the author's modification of the system for determining entry and exit points into the market...
Mine Farm - is the combination of great potential with reliability and safety.
Why Mine Farm?!
- each order has a short dynamic Stop Loss
- the advisor does not use any risky methods (averaging, martingale, grid, locking, etc.)
- the advisor tries to get the most
Professional Opening Range Breakout (ORB) indicator designed for precision session trading with automatic time handling, breakout alerts, and advanced target levels. This indicator automatically identifies the Opening Range for any configurable session, plots the High, Low, and Midpoint levels, and extends them across the trading day. Built-in breakout detection and alerts, range measurements, and extension targets provide traders with clear structure and actionable levels. Ideal for traders usi
The ATR Indicator Based on Heiken Ashi is a unique volatility analysis tool that combines the Average True Range (ATR) with Heiken Ashi candlestick calculations to provide a smoother and more reliable measure of market volatility. Unlike the traditional ATR, which uses standard candlesticks, this indicator applies the Heiken Ashi formula to filter out market noise and deliver a clearer volatility signal.
Key Features: • ATR Calculation Based on Heiken Ashi Candlesticks – Offers a more stable v
Multi-Timeframe Heiken Ashi (Smoothed with Dashboard) Professional Market Structure Visualization with Weighted Confluence Scoring Transform your trading with crystal-clear multi-timeframe analysis. This indicator combines smoothed Heiken Ashi candles with an intelligent weighted scoring system to give you unprecedented clarity in any market condition. YOUR TRADING QUESTIONS – ANSWERED INSTANTLY: 1. What's the REAL trend direction? Dashboard Reveals: Higher timeframe (MN1, W1, D1, H4) trend a
** All Symbols x All Timeframes scan just by pressing scanner button ** Discount: The price is $50$, But now it is just $39, Limited time offer is active.
*** Contact me to send you instruction and add you in "Trend Reversal group" for sharing or seeing experiences with other users. Introduction: Trendlines are the most famous technical analysis in trading . Trendlines continually form on the charts of markets across all the different timeframes providing huge opportunities for traders
"Impulses and Corrections 5" is created to help traders navigate the market situation. The indicator shows multi-time frame upward and downward "Impulses" of price movements. These impulses are the basis for determining the "Base" , which is composed of zones of corrections of price movements, as well as "Potential" zones for possible scenarios of price movement.
Up and down impulses are determined based on a modified formula of Bill Williams' "Fractals" indicator. The last impulse is always "U
Fractal Model Indicator for Metatrader , meticulously crafted around the renowned Fractal Model by TTrades. This powerful tool empowers traders to navigate price action with precision, leveraging multi-timeframe analysis to anticipate momentum shifts, swing formations, and trend continuations. Designed for MetaTrader , the Fractal Model Indicator combines advanced algorithmic insights with customizable features, making it an essential addition for traders seeking to capitalize on expansive mar
ICT Kill zone and Macros Indicator mark and display the following zone times on the chart: Kill zones Kill zone Forex Asian
London Open New York Open London Close Central Bank Dealing range
Kill zone Indices Asian London Open New York AM New York Lunch New York PM Power Hour
Macros London 1 London 2 New York Am 1 New York AM 2 New York Lunch New York PM 1 New York PM 2
Silver bullet London Open New York AM New York PM
Sessions Asian London New York
Chart The display of Kill zone , Macro ,
Overview Harmonic Patterns MT5 is a technical analysis indicator designed for the MetaTrader 5 platform. It identifies and displays harmonic price patterns, such as Butterfly, Cypher, Crab, Bat, Shark, and Gartley, in both bullish and bearish directions. The indicator calculates key price levels, including entry, stop loss, and three take-profit levels, to assist traders in analyzing market movements. Visual elements and customizable alerts enhance usability on the chart. Features Detects six ha
Advanced CRT Indicator MT5 — Candle Range Theory Tool
Advanced CRT Indicator MT5 is a professional analysis tool that automates Candle Range Theory. It identifies consolidation ranges, breakout levels, Fair Value Gaps (FVG), and profit targets, with a real-time dashboard and alerts.
Overview - Multi-timeframe candle range detection - Automatic breakout levels with buffer settings - Fair Value Gap identification and tracking - Up to three customizable target levels (Risk:Reward ratios)
BUY and SELL smart The BUY and SELL Smart Indicator is a next-generation trading tool engineered for precision scalpers, intraday strategists, and professional analysts who demand both speed and clarity in market visualization. It seamlessly integrates smart candle-based analytics, adaptive ATR logic, and real-time economic event awareness — giving you a fully synchronized view of market volatility and momentum. Through an elegant and optimized interface, FlashScalp delivers instant signal fee
Breakthrough Solution For Trend Trading And Filtering With All Important Features Built Inside One Tool! Trend PRO's smart algorithm detects the trend, filters out market noise and gives entry signals with exit levels. The new features with enhanced rules for statistical calculation improved the overall performance of this indicator.
Important Information Revealed Maximize the potential of Trend Pro, please visit www.mql5.com/en/blogs/post/713938
The Powerful Expert Advisor Version
Automatin
ALGOMA EA – An Intelligent Professional Scalping EA, the Result of 5 Years of Real Market Experience. It is the outcome of 5 years of research, experience, and real trading optimization, designed for traders who need a reliable, adaptable, and truly intelligent scalper for intraday trading.
Signal 1 : Live Myfxbook : Algoma EA Forex Trading System by Forex Trader MedRed
Setfile : Default setting came with standard version ️ Key Features of ALGOMA EA: Optimized Scalping Strategy
Noize Absorption Index - is the manual trading system that measures the difference of pressure between bears forces and bulls forces. Green line - is a noize free index that showing curent situation. Zero value of index shows totally choppy/flat market.Values above zero level shows how powerfull bullish wave is and values below zero measures bearish forces.Up arrow appears on bearish market when it's ready to reverse, dn arrow appears on weak bullish market, as a result of reverse expectation.
## ONLY GOLD
## Тiльки Золото
## **Mercaria Professional Trading Zones - Complete Guide** ## **Mercaria Professional Trading Zones - Повний посібник**
### **How Mercaria Zones Work / Як працюють зони Mercaria**
**English:** Mercaria Zones is an advanced trading indicator that identifies high-probability support and resistance areas using ZigZag extremes combined with mathematical zone calculations. The indicator works on multiple timeframes simultaneously, providing a comprehensive view
QUASIMODO PATTERN SCANNER - Professional Edition Automatic Detection of High-Probability Setups
WHAT IS THE QUASIMODO (QM) PATTERN? The Quasimodo Pattern is one of the most reliable and powerful reversal patterns in technical analysis. Used by professional traders
Harmonic Pattern Hunter Harmonic Pattern Hunter is a technical indicator for MetaTrader 5 that automatically identifies and draws high-probability harmonic patterns directly on the chart. It is designed to assist traders who use harmonic analysis as part of their trading methodology. How It Works The indicator scans historical and live price data for completed XABCD harmonic structures using Fibonacci ratio validation. When a valid pattern is detected, it draws the full pattern geometry, marks t
Axiom Point — Precision Structural Breakout Indicator Axiom Point is a high-performance analytical indicator designed to identify high-probability reversal zones using price-action behaviour and adaptive balance filtering.
The indicator applies a multi-layer analytical model to detect moments when price transitions beyond its normal equilibrium area, indicating a potential shift in market momentum. Unlike conventional trend-following tools, Axiom Point focuses on so-called points of no return —
What was IFM created for Our goal in creating IFM was to provide the tool to manage your Fibonacci Retrecements and other Fibo tools in MetaTrader 5. This indicator allows you to edit all of the settings without getting into it by right click on the tool. That is faster and easiest way to manage objects on your chart.
Inputs Font size - change font size of texts on the IFM panel. This is necessary, because some of users change font size in Windows settings Description of the Fibo levels (variab
中文翻译 No Supply No Demand VSA 指标 - MQL5 Market 说明 说明 No Supply No Demand 是一款基于经典威科夫理论的成交量价差分析指标,适用于 MetaTrader 5。它会自动扫描K线,寻找两种特定的形态,这些形态提示当前行情可能出现停顿或反转,并直接在图表上用简单的箭头符号标出。 No Demand(无需求)形态是一根阳线,收盘时成交量较低,且上下两端都带有影线,出现在价格已经向下测试过、但尚未收盘高于当前K线之后。这说明买方并没有以真正的力量入场。该形态会在K线上方用红色的 v 符号标出。 No Supply(无供应)形态是一根阴线,收盘时成交量较低,且上下两端都带有影线,出现在价格已经向上测试过、但尚未收盘低于当前K线之后。这说明卖方并没有以真正的力量入场。该形态会在K线最低点用绿色的向上箭头标出。 这两种形态都通过可调节的回溯周期进行确认,因此信号只有在根据近期收盘价验证之后才会出现,而不仅仅依据K线形状判断。 规格说明 识别 No Demand 形态,阳线,低成交量,带有影线的针形K线,在K线上方用红色 v 符号标出
Welcome to ENTRY IN THE ZONE AND SMC MULTI TIMEFRAME Entry In The Zone and SMC Multi Timeframe is a professional trading indicator built on Smart Money Concepts (SMC) , combining market structure analysis with a No Repaint BUY / SELL signal system in a single indicator. It helps traders understand market structure more clearly, identify key price zones, and focus on higher-quality trading opportunities. By combining Multi-Timeframe Analysis , Points of Interest (POIs) , and real-time signals, th
Neuro Poseidon is a new indicator by Daria Rezueva. It combines precise trading signals with adaptive TP/SL levels - creating best possible trades as a result!
Message me and get Neuro Poseidon Assistant as a gift to automize your trading process!
What makes it stand out?
1. Proven profitability on all assets and timeframes
2. Only confirmed BUY and SELL signals present on the chart
3. Adaptive TP & SL levels generated by the software for each trade
4. Easy to understand - suitable for al
Crystal Heikin Ashi Signals - Professional Trend & Signal Detection Indicator Advanced Heikin Ashi Visualization with Intelligent Signal System for Manual & Automated Trading
Final Price: $149 ---------> Price goes up $10 after every 10 sales .
Limited slots available — act fast .
Overview Crystal Heikin Ashi Signals is a professional-grade MetaTrader 5 indicator that combines pure Heikin Ashi candle visualization with an advanced momentum-shift detection system. Designed for both manual traders
ARIPoint is a powerful trading companion designed to generate high-probability entry signals with dynamic TP/SL/DP levels based on volatility. Built-in performance tracking shows win/loss stats, PP1/PP2 hits, and success rates all updated live. Key Features: Buy/Sell signals with adaptive volatility bands Real-time TP/SL/DP levels based on ATR Built-in MA Filter with optional ATR/StdDev volatility Performance stats panel (Success, Profit/Loss, PP1/PP2) Alerts via popup, sound, push, or email Cu
FX Power:分析货币强度,助您做出更明智的交易决策 概述
FX Power 是一款专业工具,帮助您全面了解主要货币和黄金在任何市场条件下的真实强度。通过识别强势货币用于买入,弱势货币用于卖出, FX Power 简化了交易决策,并帮助您发现高概率的交易机会。不论您是想跟随趋势还是通过极端的 Delta 值预测反转,这款工具都能完美适应您的交易风格。别再盲目交易——用 FX Power 让您的交易更加智慧。
1. 为什么 FX Power 对交易者极具价值 实时货币和黄金强度分析
• FX Power 实时计算并显示主要货币和黄金的相对强度,助您全面了解市场动态。
• 监控领先或落后资产,轻松识别值得交易的货币对。 全面的多时间框架视图
• 跟踪短期、中期和长期时间框架的货币和黄金强度,以便将您的交易策略与市场趋势保持一致。
• 无论是快进快出的短线交易还是更长期的投资策略, FX Power 都能为您提供所需的信息。 Delta 动态分析用于趋势和反转
• 极端 Delta 值常常预示反转机会,而平缓的 Delta 变化则确认趋势延续。
• 使用 Delta 分析,轻
The Oracle Pro:用于 MT5 的合成多周期偏向引擎 ️ 夏季上市优惠 — 早期买家可以 199 USD 获得 The Oracle Pro。价格将随关注度上升;最终价格 399 USD。 The Oracle Pro 是一款面向高要求与专业交易者的 MetaTrader 5 高级多周期 偏向引擎 。它以纪律回答一个问题:当前每个周期的方向偏向是什么、强度如何、各周期之间的一致程度如何?一切仅在已收盘的 K 线上计算——绝不重绘。 The Oracle Pro 是一套多因子共识系统。它将专有指标与优化算法整合为单一而精密的共识向量,并在单个指标实例内,跨当前周期与更高周期的堆栈进行读取——而不是在多个图表上堆叠互不相关的工具。 它是 Oracle 共识方法的专业进化版:完整重建为高级操作控制台,面向希望在一个纪律化工作流中获得深度、多周期背景与背离洞察的交易者。 是偏向引擎,而非信号生成器 The Oracle Pro 明确自身定位。它是一款提供纪律化方向背景的 多周期多因子偏向指标 。它 不是 信号生成器:不承诺入场、出场或盈利。偏向是背景——你在其方向上交易自己的设置
BTMM State Engine Pro is a MetaTrader 5 indicator for traders who use the Beat The Market Maker approach: Asian session context, kill zone timing, level progression, peak formation detection, and a multi-pair scanner from a single chart. It combines cycle state logic with a built-in scanner dashboard so you do not need the same tool on many charts at once.
What it does
Draws the Asian session range; session times can follow broker server offset or be set in inputs. Tracks level progression (L
IX Power:解锁指数、大宗商品、加密货币和外汇市场洞察 概述
IX Power 是一款多功能工具,可分析指数、大宗商品、加密货币和外汇市场的强弱表现。 FX Power 提供针对货币对的最高精度,利用所有可用货币对数据进行分析,而 IX Power 专注于基础资产的市场数据。这使得 IX Power 成为非外汇市场的理想选择,同时在需要简单外汇分析时也非常可靠。它可以无缝适用于任何图表,提供清晰的、有行动价值的洞察,帮助提升您的交易决策。
1. 为什么 IX Power 对交易者非常有价值 多市场强弱分析
• IX Power 分析指数、大宗商品、加密货币和外汇市场的强弱表现,为每个市场提供量身定制的洞察。
• 监控 US30、WTI、黄金、比特币等资产的表现,发现交易机会。 适用于更广泛的市场
• 对于外汇交易, FX Power 提供无与伦比的精度,通过分析所有相关货币对。
• IX Power 专注于基础资产的市场数据,非常适合非外汇市场及简化的外汇分析。 实时适应性
• 借助自适应算法, IX Power 实时响应市场数据变化,保持分析的最新性。
• 实时更新
Market Structure Patterns is an indicator based on smart money concepts that displays SMC/ICT elements that can take your trading decisions to the next level. Take advantage of the alerts , push notifications and email messages to keep informed from when an element is formed on the chart, the price crosses a level and/or enters in a box/zone. Developers can access the values of the elements of the indicator using the global variables what allows the automation of trading d
TPA True Price Action indicator reveals the true price action of the market makers through 100% non-repainting signals strictly at the close of a candle!
TPA shows entries and re-entries, every time the bulls are definitely stronger than the bears and vice versa. Not to confuse with red/green candles. The shift of power gets confirmed at the earliest stage and is ONE exit strategy of several. There are available now two free parts of the TPA User Guide for our customers. The first "The Basics"
MACD indicators https://mql5.com This MACD indicator looks slightly different from the MACD indicator found in many other charting software. When the value of the signal line parameter is greater than the value of the MACD parameter, the indicator will give a buy prompt, and when the signal line parameter is less than the value of the MACD parameter, the indicator will give a sell prompt.
https://www.mql5.com A double moving average indicator This indicator uses the system's own two different time period of moving average indicators to reflect the movement of market prices. It is recommended that you use the default parameter Settings, which you can set according to your own experience to get the best predictive power. I hope it can provide some help for your trading.
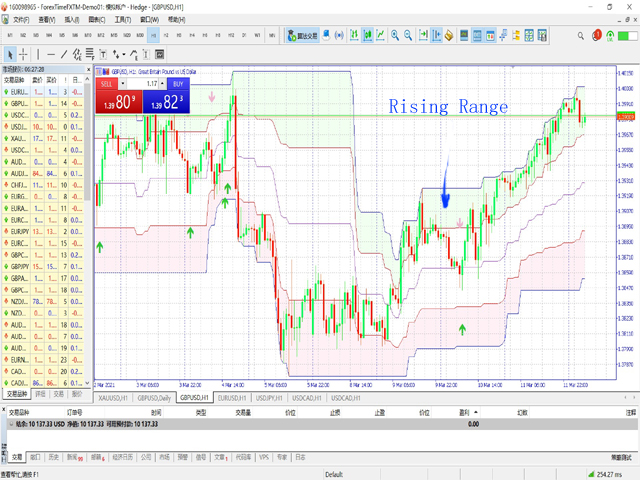
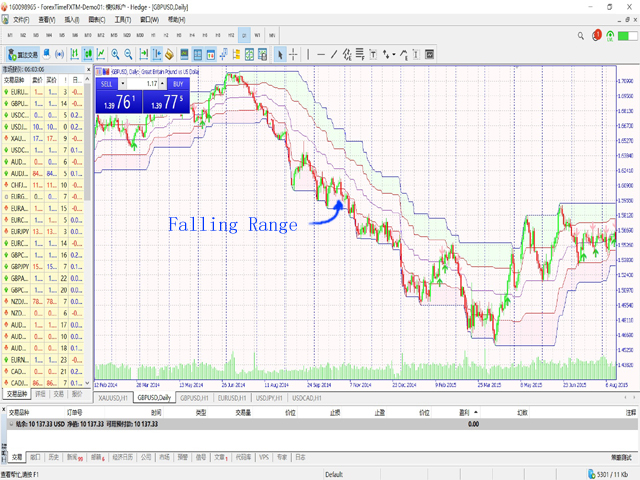
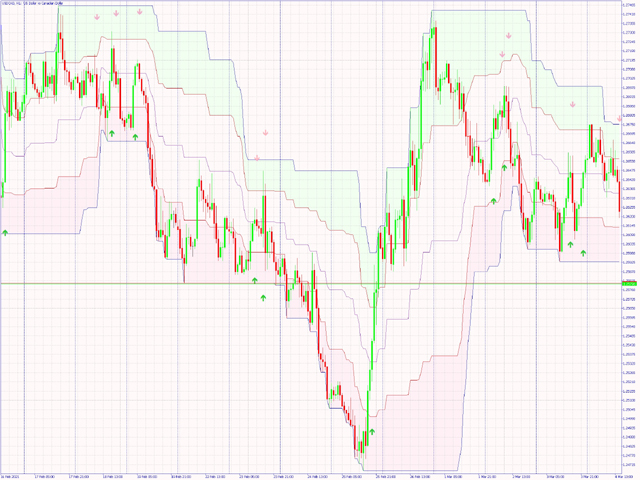
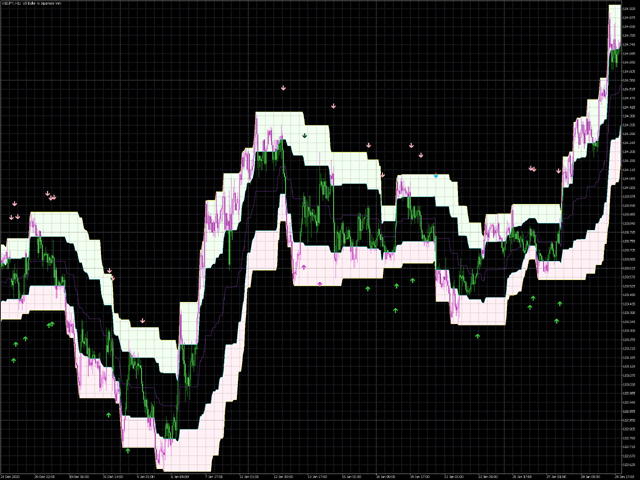
https://www.mql4.com The price trend indicator
The price trend indicator accurately shows the changes in market prices , At the same time, this index also shows the future trend of the market price . The indicator does not redraw and does not lag. The recommended time frame is not less than H1 . When the market price is in the light green range, the market is in the rising range, and when the market price is in the light purple range, the market is in the falling range