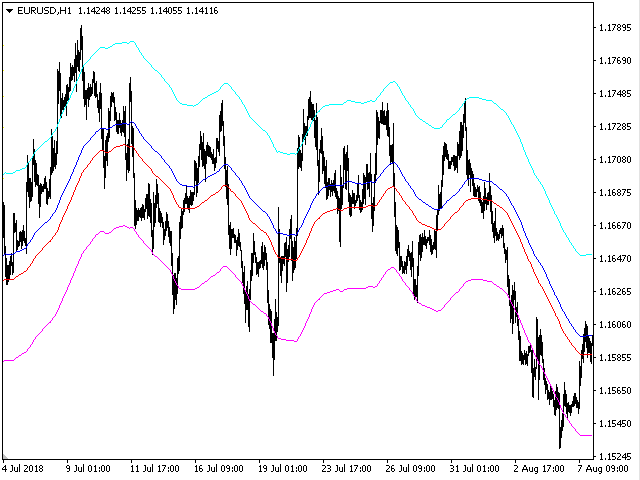
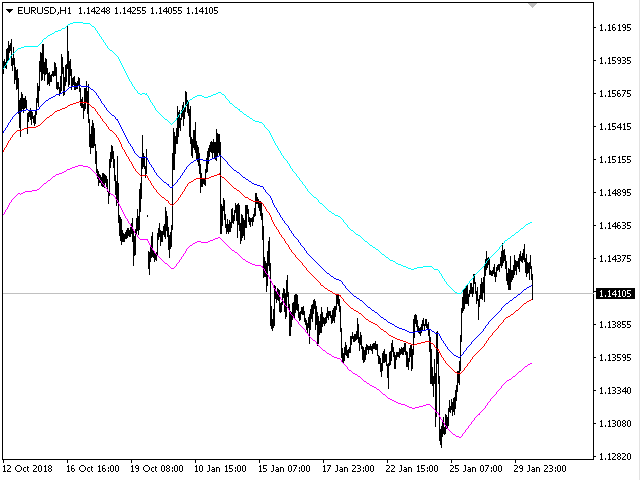
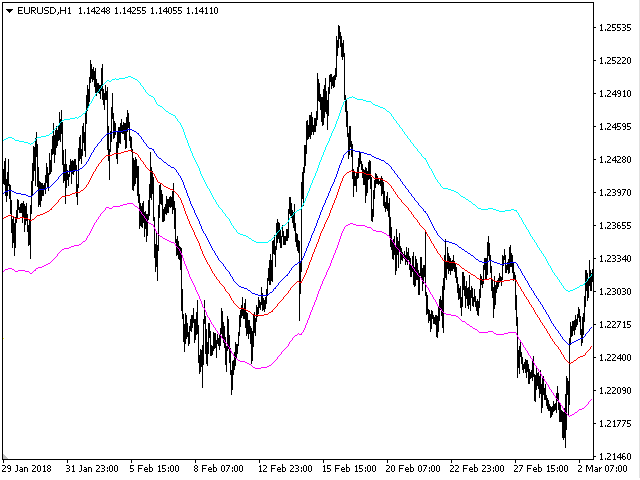
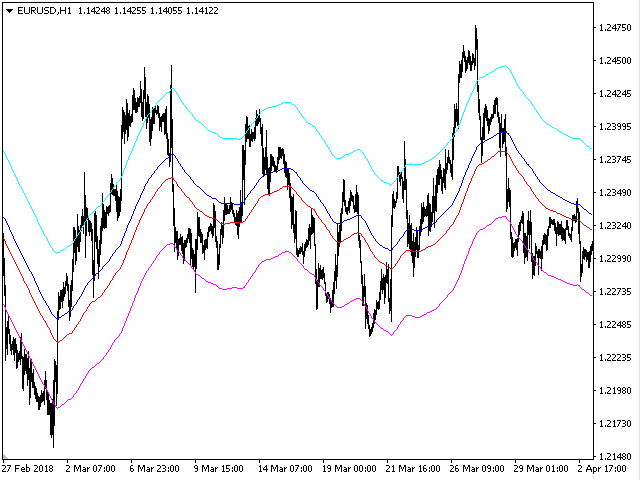
Trend formation channel
- 指标
-
Ivan Simonika
 List of the best products: https://www.mql5.com/ru/users/dragonivan/seller
e-mail: dragon.ivan.sym@gmail.com - 版本: 1.0
- 激活: 5
Trend formation channel is a set of lines. The two central lines of the indicator represent moving averages of the specified type and period, they also form a small channel. The large channel is formed - the central lines of the indicator plus / minus the standard deviation estimate, multiplied by the coefficient selected by the user. The basic rule for plotting is that about 5% of prices should be outside these lines, and 95% - inside. If the price crosses the upper or lower line too often, the period should be increased, and if the price rarely reaches the outer bands, the period should be decreased.
The indicator works equally well on any timeframe. For trends of medium duration, it is recommended to use the standard setting. For the analysis of short-term trends, it is better to use a lower indicator value. To study long-term trends, it is recommended to use an indicator value greater than the standard. Most often, the exponential method is used to calculate the indicator, but other varieties can also be used.