MarketPoints
- 指标
-
Ivan Simonika
 List of the best products: https://www.mql5.com/ru/users/dragonivan/seller
e-mail: dragon.ivan.sym@gmail.com - 版本: 1.0
- 激活: 5
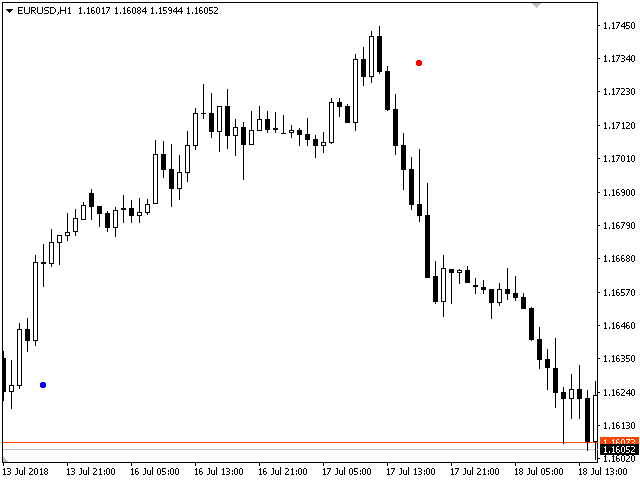
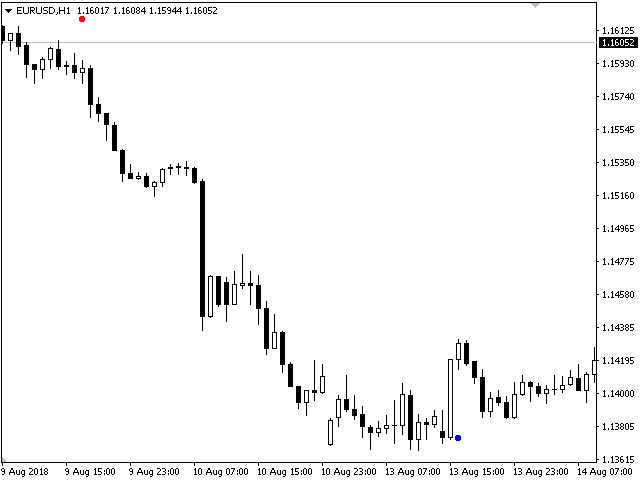
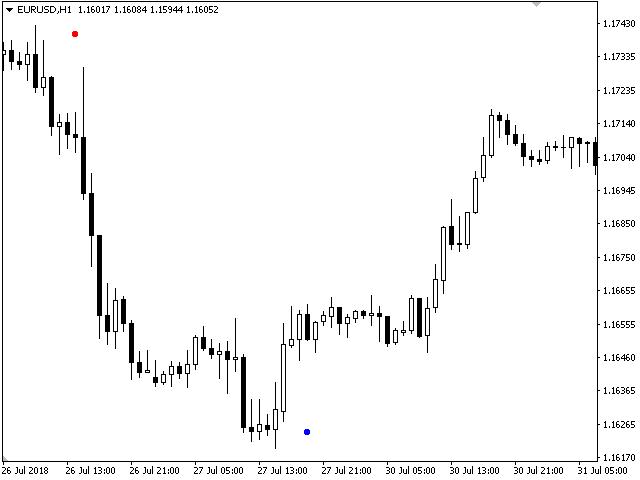
This indicator gives signals about a trend change, shows successful signals. High probability of a successful trend, it can be used with an
optimal risk to profit ratio. The indicator does not redraw and is not late; it can be used both for piping on small periods and for long-term
trading. The indicator algorithm works using open prices, and you can work with a zero bar. It works on all currency pairs and on all
timeframes.