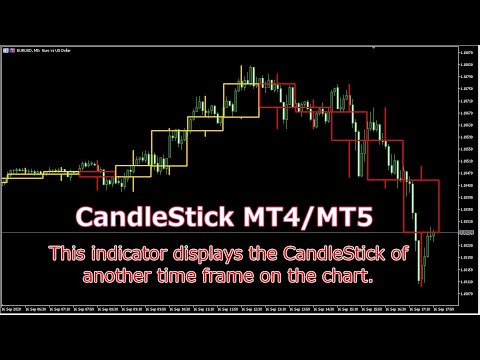
CandleStick MT5

5

What you can do with CandleStick

CandleStick is a useful indicator for doing MTF analysis.
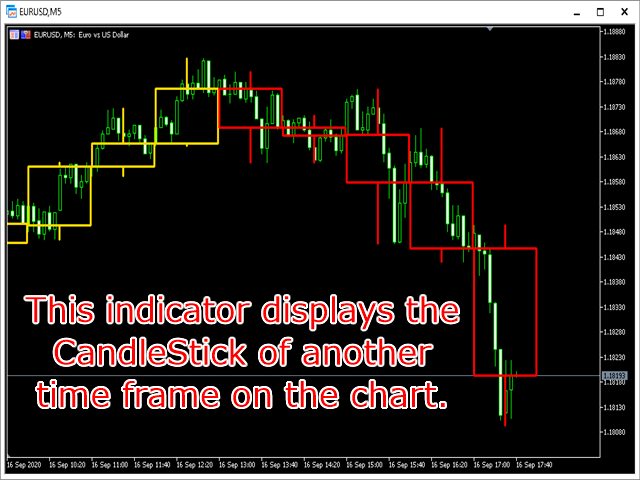
This indicator displays the CandleStick of another time frame on the chart.
By understanding the information in multiple time charts at the same time, it is easier to understand the overall market view.
It is also a useful tool for validating and studying past quotes and trades.
There are similar products made by others, but I designed and developed it so that it is easy for me to use.

Features of CandleStick only

When I trade, the important thing is operability.
There are traders who operate by opening multiple charts of different time frame on the display.
But I don't.
It's hard to see and hard to understand.
I open one chart for one currency pair.
While switching the chart's timeframe, I trade using MTF analysis to get the information I need.

Until now, similar indicators existed, but there was a problem that only one time frame could be set.
For example, if I set H1-CandleStick to draw, I could draw on the 15-minute chart, but could not draw on the daily chart.
Therefore, this indicator allows you to set the CandleStick time frame for each MT4/MT5 chart.
In other words, the specified CandleStick can be displayed by switching to any chart.
This way is easy to see and understand.
This way also makes MT4/MT5 work lighter and more comfortable.
I developed the CandleStick to get the best performance in this way.

What can be set in the property
  • Can set CandleStick time frame for each MT4/MT5 chart.
  • Supports 8 types of CandleStick: M5, M15, M30, H1, H4, D1, W1, MN1.
  • You can switch Show/Hide the CandleStick by pressing a key on the keyboard.( The default key is “C”)
  • CandleStick can specify the line color, line width, and line type. ( However, the line type can be set only when the line width is 1.)
  • It is possible to set whether or not to display the CandleStick when loading the indicator.
  • The recommended value for the “Calculation Range” is 2000-10000. The higher this number, the more CandleSticks will be drawn, but slower.Adjust according to the specifications of your computer.

My settings


As I said, I only open one chart for one currency pair and use it by switching the time frame.
I don't want the Candle Stick to appear when I switch between timeframes.
I don't always want to see it.
I want to see it when I need it.
Therefore, set ”Show on load” to false. (Default is true)

Use the Show/Hide key to display the CandleStick.

You can assign a-z keys to “Show/Hide” keys. (Default is C)

In the case of H1 chart, I want to display CandleStick of D1, so set it in the property to do so.
Set the other time frames in the same way.

Also set CandleStick Color, Line Width, and Line Style.
In my case…
Bullish CandleStick Color=Gold.
Bearish CandleStick Color=Red.
Line Width=1.
Line Style=Solid.

Calculation Range is 5000 by default.
I have no trouble with this setting.
Change it if necessary.

评分 2
krisnara123
2180
krisnara123 2024.08.04 13:27 
 

Tian-san,I request a small feature to add Range "High-Low" of the HTF candle .Kindly also provide options for Font color and Font Size.Thanks !I am really hoping that you will implement this feature.I will say special thanks in my post.

推荐产品
DAILY OH/OL SDEV QUANT MODEL - STATISTICAL TRADING WITH PRECISION RISK MANAGEMENT TRADE WITH MATHEMATICAL CERTAINTY - KNOW YOUR EXACT STOP-LOSS AND TAKE-PROFIT BEFORE YOU ENTER This indicator analyzes 5,000+ days of price history to give you: Exact entry levels (sigma bands locked at daily open) Exact stop-loss distance (from M
This MT5 indicator provides real-time updates of classic Renko charts. Renko charts focus on price movement, filtering out noise and highlighting trends. What are Renko candles? Renko charts display price movement using "bricks" of equal size, ignoring time. A new brick is drawn only when the price moves by a specified amount. They help visualize trends by removing time-based noise. Parameters - BrickSizePoints  (20): Renko brick size in points - HistoryDepthSec  (3600): Historical data to ini
FREE
Renko Plus
Eadvisors Software Inc.
With Renko Plus you can use the features in the Indicator functionality, just add it to the Metatrader5 chart.             The Renko chart is a type of chart, developed by the Japanese, that is constructed using price movement rather than standardized prices and time intervals like most charts. It is believed to be named after the Japanese word for bricks, "renga", as the graphic looks like a series of bricks.             A new brick is created when the price moves a specified pri
Mario Order Blocks
Sandeep Kumar Tiwary
Mario Order Block Indicator Overview The Professional Order Block Indicator is an advanced technical analysis tool that automatically identifies and displays institutional order blocks on your chart. Based on smart money concepts, this indicator helps traders identify high-probability support and resistance zones where institutional traders have placed significant orders. Key FeaturesAutomatic Order Block Detection Identifies bullish and bearish order blocks based on pivot point analysis Uses so
This indicator uses a mathematical calculation algorithm . This algorithm calculates the remainder between the updated model and the actual values and produces the possible progress of the graph on the graph. It is not a super prophet in trading, but it is very good for the trader when entering the market and to analyze it before entering. Applicable for all currencies. Данный индикатор использует алгоритм математических вычислений . Данный алгоритм вычисляет остаток между обновленной моделью и
Gino Renko
Stephane, Andr Valette
1 (1)
Another renko-based indicator. It returns different usable values ​​for an EA, and is directly displayed on the main chart. Its setting is very simple: The size of the renko The number of bars taken into account The falling color The color on the rise Returned values: Buffer 0 : Value of the middle Buffer 1 : Value of the Top Buffer 2 : Value of the Bottom Buffer 3 : Direction of renko (0.0 for top ; 1.0 for bottom) Buffer 4 : Ratio of the renko, for example, if it is twice, 3 times, ro more of
Trend Direction ADX indicator for MT5
Renaud Herve Francois Candel
Trend Direction ADX indicator Trend Direction ADX is part of a serie of indicators used to characterize market conditions. Almost any strategy only work under certain market conditions. Therefore it is important to be able to characterize market conditions at any time: trend direction, trend strength, volatility, etc.. Trend Direction ADX is an indicator to be used to characterize trend direction: trending up trending down ranging Trend Direction ADX is based on ADX standard indicator. Tre
Separating Lines Trading System for MetaTrader 5 Separating Lines Trading System is a price action indicator for MT5 designed to detect 2-bar continuation patterns where both candles share the same opening level and the second candle resumes the prevailing trend. A detailed user guide is available on the author’s MQL5 Blog . Additional updates are available through the author’s   MQL5 Channel . Depending on the current support policy, buyers may receive additional access to selected companion t
该指标建立当前报价,可以与历史报价进行比较,并在此基础上进行价格走势预测。指示器有一个文本字段,用于快速导航到所需日期。 选项: 符号 - 选择指标将显示的符号; SymbolPeriod - 选择指标从中获取数据的时段; IndicatorColor - 指示器颜色; HorisontalShift - 由指标绘制的报价移动指定的柱数; Inverse - true 反转引号,false - 原始视图; ChartVerticalShiftStep - 图表垂直移动(键盘上的向上/向下箭头); 接下来是文本字段的设置,您可以在其中输入日期,您可以通过按“回车”立即跳转到该日期。 接下来是文本字段的设置,您可以在其中输入日期,您可以通过按“回车”立即跳转到该日期。
Renko Charts Pro
Makarii Gubaydullin
过滤掉小的价格波动,专注于更大的趋势 . Renko 图表指标将帮助您过滤掉小的价格波动,以便您可以专注于整体趋势。 价格必须移动指定的数量才能创建一个 Renko 砖块。 这使得识别价格当前移动的方向变得容易。 多功能实用工具 : 包含 66+ 功能  |   联系我  如果您有任何问题  |    MT4 版本 在指标的设置中,您可以配置: 计算设置: 计算 块 大小的 方法 : 点差   / 点; 块大小; 将 用于 计算的 时间框架 ; 指标样式: 块颜色; 程序文件应放置在 " Indicators " 目录中。 //--------------------------- 多功能实用工具 : 包含 66+ 功能  |   联系我  如果您有任何问题  |    MT4 版本 //-----------------------
Advanced 4xZeovo MT5 Indicator (MetaTrader 5)   Product Description  4xZeovo is a powerful trading indicator system monitoring 24/7 financial markets. Metatrader5 tool designed to find the best buying/selling opportunities and notifies the user.    Making life easy for traders in helping with the two most difficult decisions with the use of advanced innovate trading indicators aiming to encourage users to hold the winning positions and take profit at the best times.    Equipped with a unique tra
SMC Guardian
Mohammed Mamdouh Abdel Fattah Mohammed El Sayed
5 (2)
GUARDIAN: The Ultimate Trend & Security Indicator GUARDIAN is a sophisticated technical analysis tool designed for traders who prioritize precision and capital preservation. This indicator acts as a vigilant protector of your trades, filtering market noise and identifying high-probability trend reversals with institutional-grade accuracy. Core Features: Adaptive Trend Detection: Utilizes advanced algorithms to detect market shifts before they become obvious. Smart Risk Management: Built-in signa
FREE
This SMT (Smart Money Technique) divergence indicator identifies discrepancies in price movement between two different trading symbols, helping traders detect potential market reversals. This tool compares the price action of two correlated assets, such as two currency pairs or indices, to spot divergences where one asset's price moves in the opposite direction of the other. For example, while one symbol may be making higher highs, the other might be making lower highs, signaling a divergence. T
FREE
All about time and price by ICT. This indicator provides a comprehensive view of ICT killzones, Silver Bullet times, and ICT Macros, enhancing your trading experience.  In those time windows price either seeks liquidity or imbalances and you often find the most energetic price moves and turning points. Features: Automatic Adaptation: The ICT killzones intelligently adapt to the specific chart you are using. For Forex charts, it follows the ICT Forex times: In EST timezone: Session: Asia: 20h00-0
Reversal Pattern AI MT5
Stanislav Konin
5 (2)
Reversal Pattern AI — an absolute breakthrough in the world of indicator development, combining artificial intelligence algorithms, multi-level market analysis, and classical methods of technical analysis. It not only detects reversal patterns but also evaluates market inefficiencies, generating highly accurate trading signals. Thanks to a hybrid model that uses price action analysis, Volumes, Volatility, VWAP, and Volume AVG %, the indicator easily adapts to any market conditions.              
Trend Bands 5
Leonid Basis
Bands are a form of technical analysis that traders use to plot trend lines that are two standard deviations away from the simple moving average price of a security. The goal is to help a trader know when to enter or exit a position by identifying when an asset has been overbought or oversold. This indicator will show upper and lover bands. You can change input parameters nPeriod and  nMethod to calculate those bands for each timeframe. Aqua clouds represent up or down trends.
The ATR Indicator Based on Heiken Ashi is a unique volatility analysis tool that combines the Average True Range (ATR) with Heiken Ashi candlestick calculations to provide a smoother and more reliable measure of market volatility. Unlike the traditional ATR, which uses standard candlesticks, this indicator applies the Heiken Ashi formula to filter out market noise and deliver a clearer volatility signal. Key Features: • ATR Calculation Based on Heiken Ashi Candlesticks – Offers a more stable v
FREE
Order Book, known also as Market Book, market depth, Level 2, - is a dynamically updated table with current volumes of orders to buy and to sell specific financial instument at price levels near Bid and Ask. MetaTrader 5 provides the means for receiving market book from your broker, but in real time only, without access to its history. The indicator OrderBook Cumulative Indicator accumulates market book data online and visualizes them on the chart. In addition, the indicator can show the market
TrendPicoeur
Askar Koibagarov
TrendPicoeur — 该指标不重绘。基于波动率的ParabolicSAR算法。该指标可用于移动止损,作为信号指标或趋势指标。 如需添加警报系统(弹窗、声音、电子邮件、Telegram、WhatsApp),请在评论区留言 。 该指标可用于追踪止损,也可作为信号指标或趋势指标使用。 连接方式: 通过缓冲区连接到智能交易系统 (EA)。该指标有两个缓冲区: SetIndexBuffer(0, sarBuffer, INDICATOR_DATA);   — 缓冲区 (0):存储图表上箭头标记所在的价格水平。 SetIndexBuffer(1, colorBuffer, INDICATOR_COLOR_INDEX);   — 缓冲区 (1):定义箭头的颜色。 颜色缓冲区 (1) 提供以下信号: 0 = 红色 = 看跌信号 (卖出) 1 = 蓝色 = 看涨信号 (买入) 指标参数设置: input int trendPeriod = 14;   // 趋势计算周期 input ENUM_APPLIED_PRICE trendPrice = PRICE_CLOSE;   // 趋势计算
FREE
Renko Chart
Marcin Konieczny
3.56 (9)
This indicator allows to display Renko charts in the indicator window. Renko charts show only price movements that are bigger than the specified box size. It helps to eliminate noise and allows to focus on main trends. Time is not a factor here. Only price movements are taken into account. That's why Renko chart is not synchronized with the main chart it is attached to. Indicator works in two modes: CLOSE - only close prices are taken into account while building the chart HIGH_LOW - only high/l
FREE
Advanced CRT Indicator MT5 — Candle Range Theory Tool Advanced CRT Indicator MT5 is a professional analysis tool that automates Candle Range Theory. It identifies consolidation ranges, breakout levels, Fair Value Gaps (FVG), and profit targets, with a real-time dashboard and alerts. Overview - Multi-timeframe candle range detection   - Automatic breakout levels with buffer settings   - Fair Value Gap identification and tracking   - Up to three customizable target levels (Risk:Reward ratios)  
Delta Profile Volume 3IN1
Patrick Omar Sanduyogan
This indicator combines three powerful market analysis tools into one clean system , designed for traders who analyze volume behavior, liquidity zones, and order flow to understand market movement. It is especially useful for traders following strategies similar to Favio Valentini , where identifying volume imbalances and weak price areas is an important part of the trading process. Instead of installing multiple indicators, this tool integrates everything into one optimized indicator , making c
Inside Bar PA MT5
Yury Emeliyanov
"Inside Bar PA" is a technical indicator for the MetaTrader 5 platform, designed to automatically detect the Inside Bar pattern on the chart. An Inside Bar is a candle whose high and low are completely within the range of the previous candle (mother bar). This pattern often signals market consolidation and can precede a strong price movement. Features: • Automatic detection of all Inside Bars on the chart • Visual marking with arrows: green up arrow for bullish Inside Bars (close >= open), gr
FREE
Smart Harvest XAU
Endra Setiyanto
SMART HARVEST XAU:高级回撤止损网格 SMART HARVEST XAU 是一款新一代智能交易系统 (EA),专为把握市场回撤和价格回调机会而设计。与传统的、高风险的平均交易或马丁格尔系统不同,后者会在强劲趋势下盲目开市价单,而这款 EA 采用高度精密的智能追踪挂单网格策略。 通过使用动态买入止损单和卖出止损单,智能追踪当前市场价格,该 EA 确保仅在市场真正反转或回调时才激活新的网格层。这种独特的方法提供了更安全的入场点,大幅降低浮动回撤,并保护您的资金。 SMART HARVEST XAU 配备实时新闻过滤器、多层账户保护和交互式图表仪表盘,是您交易黄金 (XAUUSD) 和主要货币对的理想自动化交易伙伴。  高级功能与创新  智能追踪挂单(回调入场) 当价格走势不利于您时,EA 不会立即下单。相反,它会在预先计算好的距离处设置一个挂单止损单。如果趋势延续,挂单会进一步追踪价格走势。只有当价格回调时,挂单才会触发,确保您精准把握市场修正。  动态 ATR 和安全趋势网格 网格间距并非固定不变。EA 利用平均真实波幅 ​​(ATR) 指标,在市场波动剧
The Buy Sell MT5 indicator is a professional trend-following tool designed to detect high-precision market reversals using Trailing Stop-Loss logic . It works best on volatile markets such as Gold (XAUUSD) , Nasdaq (NAS100) , and DAX (GER40) . Recommendations works on all symbols and timeframes. For best results, it performs exceptionally well on volatile markets such as GBPUSD, USDJPY, SPX500, NAS100, DAX30, BTCUSD and XAUUSD (Gold), especially on M30, M5, and M15 timeframes. Key Features Zero
CosmiCLab FIBO
Kirils Subins
CosmiCLab SMC FIBO CosmiCLab SMC FIBO is a professional trading indicator designed for traders who use Smart Money Concepts (SMC), market structure analysis and Fibonacci retracement levels. The indicator automatically detects market swings and builds Fibonacci levels based on the latest impulse movement. It also identifies market structure changes such as BOS (Break of Structure) and CHOCH (Change of Character), helping traders understand the current market direction. CosmiCLab SMC FIBO also pr
Smooth Patterns
Roman Vashchilin
Trading patterns on Forex is considered to be the highest level of trading, since it usually requires years of mastering various patterns (shapes and candle combinations) and the ways they affect the price. Patterns are different combinations of Japanese candles on a chart, shapes of classical technical analysis, as well as any regularities of the market behavior repeating many times under the same conditions. After the patterns appear on a chart, the price starts behaving in a certain way allow
Price Magnet — Price Density and Attraction Levels Indicator Price Magnet is a professional analytical tool designed to identify key support and resistance levels based on statistical Price Density. The indicator analyzes a specified historical period and detects price levels where the market spent the most time. These zones act as “magnets,” attracting price action or forming a structural base for potential reversals. Unlike traditional Volume Profile tools, Price Magnet focuses on price-time d
WickAndBody Volume Flow
Henry Armando Baltazar
WickAndBody Volume Flow v5.2 Order Flow Analysis through Candle Segmentation The WickAndBody Volume Flow is an advanced diagnostic tool for MetaTrader that allows traders to "see" inside every Japanese candlestick. Unlike conventional volume indicators, this algorithm utilizes Multi-Timeframe (MTF) technology to break down real volume and determine exactly how much capital was traded in the wicks versus the candle body . Key Features Volume Detection: Uses lower timeframe data (M1/M5) to reconst
FREE
Renko Builder GLX1
Eranga Thilina Dhanushka Gallage
GLX1 Renko Builder   Expert Advisor (EA) can create the Renko bar charts on any symbol. The Renko charts are generated as real-time custom symbol charts which can be further used for technical analysis with any MT5 compatible indicator.  Find the free   GLX1 Renko Euro   Expert Advisor from here.  https://www.mql5.com/en/market/product/115074 Included Features: Truly responsive Renko Charting on a custom symbol chart Accurate automatic live chart update Ability to attach any MT5 indicator Abi
该产品的买家也购买
ARIPoint
Temirlan Kdyrkhan
ARIPoint is a powerful trading companion designed to generate high-probability entry signals with dynamic TP/SL/DP levels based on volatility. Built-in performance tracking shows win/loss stats, PP1/PP2 hits, and success rates all updated live. Key Features: Buy/Sell signals with adaptive volatility bands Real-time TP/SL/DP levels based on ATR Built-in MA Filter with optional ATR/StdDev volatility Performance stats panel (Success, Profit/Loss, PP1/PP2) Alerts via popup, sound, push, or email Cu
SuperScalp Pro
Van Minh Nguyen
4.57 (21)
SuperScalp Pro – 高级多重过滤剥头皮指标系统 SuperScalp Pro 是一款高级剥头皮交易指标,将经典 Supertrend 与多种智能确认过滤器结合,帮助识别交易机会。它可高效运行于 M1 至 H4 多个时间周期,并针对 XAUUSD、BTCUSD 及主要外汇货币对进行了优化。 该指标提供清晰的 Buy 和 Sell 信号,并基于 ATR 自动计算入场价、止损和止盈水平,帮助交易者更有效地管理风险。Fibonacci Take Profit 功能可在关键价格水平提前平仓,并在到达这些水平时发送通知,从而提升交易管理效率与稳定性。 默认配置已启用 Fibonacci Take Profit,专注于更稳定、更持续的交易体验。您只需将指标加载到图表即可立即开始使用,无需额外设置。对于高级用户,所有参数均可完全自定义,以适应不同交易策略和偏好。 SuperScalp Pro 集成了 EMA、RSI、ADX、Volume、VWAP、Bollinger Bands 和 MACD Divergence 等多种过滤器,有助于减少虚假信号并提高入场质量。指标还包含图表内交互控制面
Divergence Bomber
Ihor Otkydach
4.9 (86)
购买该指标的每位用户将额外免费获得以下内容: 原创工具“Bomber Utility”,该工具会自动跟踪每一笔交易,设置止损和止盈点,并根据策略规则自动平仓; 适用于不同交易品种的指标设置文件(Set 文件); 三种不同风险模式下的 Bomber Utility 设置文件:“最低风险”、“平衡风险” 和 “观望策略”; 一套详细的 视频操作手册,帮助您快速完成安装、配置并开始使用本交易系统。 注意: 要获取以上所有赠品,请通过 MQL5 的私人消息系统联系卖家。 我为您介绍原创的自定义指标 “Divergence Bomber”(背离轰炸机),它是一套基于 MACD 背离交易策略 的“全功能”交易系统。 该技术指标的主要任务是识别 价格与 MACD 指标之间的背离,并发出交易信号(包括推送通知),指示未来价格可能的运动方向。平均而言,这些信号的准确率超过 98%。有关该指标如何工作的详细说明,请观看本页面上的视频演示。 该系统使用 止损订单 和 动态回撤平仓机制 来管理交易。 Divergence Bomber 指标的主要特点: 支持交易的品种: AUDCAD、AUDCHF、AUDSG
Entry In The Zone and SMC Multi Timeframe is a real-time 2-in-1 market analysis tool that combines market structure analysis and a No Repaint BUY / SELL signal system into a single indicator, built on Smart Money Concepts (SMC) — a widely adopted framework used by professional traders to understand market structure. This indicator helps you see the market more clearly, make decisions based on structure rather than guesswork, and focus on high-probability zones where price is more likely to react
Quantum TrendPulse
Bogdan Ion Puscasu
5 (23)
介绍 Quantum TrendPulse   ,这是一款终极交易工具,它将 SuperTrend   、   RSI 和 Stochastic 的强大功能整合到一个综合指标中,以最大限度地发挥您的交易潜力。该指标专为追求精准和效率的交易者而设计,可帮助您自信地识别市场趋势、动量变化以及最佳进入和退出点。 主要特点: 超级趋势整合: 轻松跟随当前的市场趋势并乘上盈利浪潮。 RSI 精度: 检测超买和超卖水平,非常适合把握市场逆转时机,可用作 SuperTrend 的过滤器 随机精度: 利用随机振荡在波动的市场中寻找隐藏的机会, 用作超级趋势的过滤器 多时间范围分析: 从 M5 到 H1 或 H4,在不同时间范围内关注市场动态。 可定制的警报: 当您的自定义交易条件得到满足时收到通知,这样您就不会错过任何交易。 无论您是新手还是经验丰富的交易员,   Quantum TrendPulse 都能为您提供所需的优势,帮助您增强策略并自信地进行交易。借助这一强大的指标,将洞察力转化为利润 — 掌控您的交易! ***购买 Quantum TrendPulse,即可免费获得 Quantum Tr
Power Candles MT5
Daniel Stein
4.75 (8)
Power Candles – 适用于所有市场的基于强度的入场信号 Power Candles 将 Stein Investments 经过验证的强度分析直接带入价格图表。与仅对价格作出反应不同,每一根蜡烛都基于真实的市场强度进行着色,使交易者能够立即识别动能累积、强度加速以及清晰的趋势转换。 一套逻辑,适用于所有市场 Power Candles 可自动适用于 所有交易品种 。该指标会检测当前品种是否为外汇货币对或非外汇市场,并在内部自动应用相应的强度模型。 外汇与黄金 使用 FX Power Delta 数值(绝对范围最高至 100) 指数、加密货币和 CFD 使用 IX Power 强度数值(绝对范围最高至 50) 所需的强度计算已直接嵌入 Power Candles。本指标在蜡烛着色和信号逻辑方面无需额外安装任何其他指标。 以强度状态替代价格噪音 每根蜡烛都会被归类为九种清晰定义的强度状态之一: 中性 轻度、中度、强烈、极端空头 轻度、中度、强烈、极端多头 这种基于状态的方法能够过滤随机的价格波动,专注于有意义的市场参与行为。它帮助交易者识别新的方向性阶段正在形成,而不是对单根蜡
Azimuth Pro
Ottaviano De Cicco
5 (7)
Azimuth Pro V2:MT5合成分形结构分析与确认入场 概述 Azimuth Pro 是 Merkava Labs 推出的多层级波段结构指标。四层嵌套波段层级、锚定波段的VWAP、ABC形态识别、三时间框架结构过滤以及收盘确认入场——一个图表,一个从微观波段到宏观周期的完整工作流程。 这不是盲目的信号产品。它是一个以结构为先的工作流程,专为重视位置、背景和时机的交易者打造。 V2上市优惠 — Azimuth Pro V2售价USD 399(接下来的100份)。最终价格:USD 499。 1. V2的变化 合成多时间框架引擎 高时间框架分析从零开始重建,采用与Meridian Pro相同的专有合成架构。更清晰的HTF背景、稳定的实时行为、无经典MTF同步问题。合成引擎还解锁了 固定比率时间框架级联 (x2、x3、x4、x6)——不再在经纪商的固定时间框架之间任意跳转,您可以按图表时间框架的固定倍数分析结构,在每个尺度上保持相同的分形关系。 确认入场箭头 作为稳定且可恢复的执行层而设计的收盘确认箭头。当ABC设置形成且自适应确认逻辑在收盘K线上验证方向时,箭头会写入下一根K线的
Gann Made Easy MT5
Oleg Rodin
5 (2)
Gann Made Easy   是一个专业且易于使用的外汇交易系统,它基于使用先生理论的最佳交易原则。 W.D.江恩。该指标提供准确的买入和卖出信号,包括止损和获利水平。您甚至可以使用推送通知在旅途中进行交易。 购买后请联系我,即可免费获得交易指导和超棒的额外指标! 您可能已经多次听说过江恩交易方法。通常 Gann 的理论不仅对于新手交易者而且对于那些已经有一定交易经验的人来说都是非常复杂的东西。这是因为江恩的交易方法在理论上并不那么容易应用。我花了几年时间来完善这些知识,并将最好的原则应用到我的外汇指标中。 该指标非常易于应用。您所需要的只是将其附加到您的图表并遵循简单的交易建议。该指标不断进行市场分析工作并寻找交易机会。当它检测到一个好的入口点时,它会为您提供一个箭头信号。该指标还显示止损和获利水平。 换句话说,当您像先生一样进行交易时,该指标会为您提供最佳江恩建议。江恩亲自告诉你此时此刻该做什么。但最好的部分是您不需要了解任何有关江恩交易原则的知识,因为该指标会为您完成整个市场分析工作。
购买此指标即可免费获得我的专业交易管理器。 首先,值得强调的是,这个交易系统是一个非重绘、非重画和非滞后的指标,这使得它非常适合手动和机器人交易。 在线课程,手册和下载预设。 “智能趋势交易系统 MT5”是专为新手和经验丰富的交易者量身定制的综合交易解决方案。它结合了超过 10 个优质指标,具有 7 多个强大的交易策略,使其成为适用于各种市场条件的多功能选择。 趋势跟随策略:提供精确的入场和止损管理,以有效地跟随趋势。 反转策略:识别潜在的趋势反转,使交易者能够利用区域市场的机会。 剃头策略:专为快速准确的日内交易和短期交易而设计。 稳定性:所有指标都不会重绘、不会重画和不会滞后,确保可靠的信号。 定制:支持自定义策略,以满足个人交易偏好。超过 7 种策略和组合可帮助您找到最佳策略。 信号清晰度:提供箭头信号,以指示清晰的入场和退出点。 实时警报:通过交易进出警报使交易者保持了解。 深入分析:提供更高时间框架的趋势分析和实时交易监控。 自适应颜色编码:利用蜡烛颜色编码来显示成交量、趋势和反转蜡烛信号。通过蜡烛颜色分析市场方向。 “智能趋势交易系统 MT5”赋予交易者必要的工具,以便在
FX Trend MT5 NG
Daniel Stein
5 (4)
FX Trend NG:新一代多市场趋势智能分析工具 概述 FX Trend NG 是一款专业的多时间周期趋势分析与市场监控工具,帮助您在几秒钟内全面了解市场结构。 无需在多个图表之间来回切换,您可以立即看到哪些品种处于趋势中、哪里动能正在减弱,以及哪些时间周期之间存在强烈共振。 限时发布优惠 – 仅需 $30(6个月) 或 $80 终身授权 即可拥有 FX Trend NG 。 已经是 Stein Investments 客户? -> 发送消息 以获取专属客户群访问权限。 需要帮助或安装指导? -> 请访问 Stein Investments 官方页面 。 1. FX Trend NG 的核心优势 三状态趋势逻辑 —— 不只是 Buy 或 Sell • 大多数指标仅显示两种状态:Buy 或 Sell。 • FX Trend NG 增加第三种状态: Fade 。 • Fade 表示趋势强度正在减弱,在完全反转之前提前发出信号。 这种结构化逻辑让您看到趋势变化过程,而不仅仅是简单方向信号。 多时间周期分析(M1 至 MN1) • 从短线交易到中长线交易全面覆盖。 • 快速识别趋势
SignalTech MT5
Yue Wang
5 (3)
SignalTech MT5 is a trading system for EURUSD, USDCHF, USDJPY, AUDUSD, NZDUSD, EURJPY, AUDJPY, NZDJPY, CADJPY H2 and H3 Timeframe.  It can generate signals with Buy/Sell Arrows and Pop-Up/Sound Alerts. Each signal has clear Entry and Stop Loss levels, which should be automatically flagged on the chart, as well as potential Targets 1, 2, and 3. The Entry and TP levels are fixed after the trade is taken. The exit level is dynamic. If there are signs of a potential short-term trend reversal, the
SMC Intraday Formula
Kareem Abbas
5 (4)
让我们先坦诚一点。 没有任何一个指标可以单独让你实现盈利。如果有人告诉你可以,那他是在向你兜售一个梦想。任何显示完美买卖箭头的指标都可以被做得看起来毫无瑕疵——只需要放大历史中的某一段并截取成功交易的截图。我们不会这样做。 SMC Intraday Formula 是一个工具。 它为你读取市场结构,标记出概率最高的价格区域,并用简单直白的语言准确告诉你当前智能资金的行为轨迹。你仍然需要做决定。你仍然需要执行交易。但现在,你是带着精确性执行,而不是靠希望。 我们已经在黄金(XAUUSD)以及主要外汇货币对的日内剥头皮交易中使用该指标将近三年。这是我们在 M1、M5、M15 和 M30 上的日常主力工具。它之所以有效,是因为它不试图预测未来——它展示的是当前正在形成的高概率交易机会,并解释 为什么 。 它与其他所有指标有什么不同? 大多数交易指标只做一件事。移动平均线交叉。振荡指标触及某个水平。出现一个箭头。你进场交易。你亏损。你责怪指标。重复。 SMC Intraday Formula 将多个机构级概念整合为一个统一的市场解读: - 斐波那契共振引擎 不只是普通的斐波那契水平——该指标
介绍     Quantum Breakout PRO   ,突破性的 MQL5 指标,正在改变您交易突破区域的方式!由拥有超过13年交易经验的资深交易员团队开发,     量子突破 PRO     旨在通过其创新和动态的突破区域策略将您的交易之旅推向新的高度。 量子突破指标将为您提供带有 5 个利润目标区域的突破区域的信号箭头,以及基于突破框的止损建议。 它既适合新手交易者,也适合专业交易者。 量子 EA 通道:       点击这里 重要的!购买后请私信我领取安装手册。 建议: 时间范围:M15 货币对:GBPJPY、EURJPY、USDJPY、NZDUSD、XAUUSD 账户类型:ECN、Raw 或 Razor,点差极低 经纪商时间:GMT +3 经纪商:IC Markets、Pepperstone with Raw 和 Razor 的点差最低 规格: 不重漆! 最多 5 个建议利润目标区域 建议止损水平 可定制的盒子。您可以设置自己的 Box Time Start 和 Box Time End。 接触 如果您有任何疑问或需要帮助,请通过私人消息与我联系。
Grabber System MT5
Ihor Otkydach
4.83 (23)
向您介绍一款优秀的技术指标——Grabber,它是一套即开即用的“全包式”交易策略。 在一个代码中集成了强大的市场技术分析工具、交易信号(箭头)、提醒功能和推送通知。 每位购买该指标的用户还可免费获得以下内容: Grabber辅助工具:用于自动管理已开仓位 视频操作指南:逐步教学如何安装、设置和使用该指标进行交易 原创Set文件:可快速自动配置,帮助实现最佳交易效果 忘掉其他策略吧!只有Grabber能够真正激励你在交易中攀登新高峰! Grabber策略的主要特点: 交易周期:从M5到H4 适用资产:任意,但我推荐我亲自测试过的品种(GBPUSD、GBPCAD、GBPCHF、AUDCAD、AUDUSD、AUDSGD、AUDCHF、NZDUSD、NZDCAD、EURCAD、EURUSD、EURAUD、EURGBP、EURCHF、USDCAD、USDSGD) 交易时间:全天候 24/7 交易效果:我分享自己的真实交易结果,并在此教学如何操作: https://www.mql5.com/ru/market/product/134563?source=Site+Market+MT5+Indic
Meravith MT5
Ivan Stefanov
5 (1)
做市商工具。 Meravith 将: 分析所有时间周期并显示当前正在运行的趋势。 标注流动性区域(成交量均衡区),即多头与空头成交量相等的位置。 在您的图表上直接显示来自不同时间周期的所有流动性水平。 生成并展示基于文本的市场分析供您参考。 根据当前趋势计算目标位、支撑位和止损位。 计算交易的风险回报比。 根据您的账户余额计算仓位大小,并估算潜在利润。 在市场出现重大变化时,Meravith 还会发出警告。 指标的主要线条: 多头/空头成交量衰竭线 —— 作为目标位使用。 趋势线 —— 指示市场趋势方向。根据市场是多头还是空头而改变颜色,并作为趋势支撑。其颜色主要反映市场情绪。 成交量均衡线(Eq)—— Eq(Volume Equilibrium)是系统的核心。它表示买卖双方成交量的平衡点,即市场流动性所在位置。向上突破 Eq 表示多头倾向,向下突破 Eq 表示空头倾向。突破后,应等待回调——当价格回到相反趋势的偏离线或衰竭线附近时。 使用方法:只需将其添加到图表中。 Meravith 可以分析一切——趋势和回调。 趋势线与某条成交量衰竭线之间的距离越大,说明该方向的成交量越高。 趋势
Trend Screener Pro MT5
STE S.S.COMPANY
4.85 (104)
使用趋势筛选指标释放趋势交易的力量:由模糊逻辑和多货币系统提供支持的终极趋势交易解决方案! 使用趋势筛选器(由模糊逻辑提供支持的革命性趋势指标)提升您的趋势交易。 它是一个强大的趋势跟踪指标,结合了超过 13 种高级工具和功能以及 3 种交易策略,使其成为使您的 Metatrader 成为趋势分析器的多功能选择。 限时优惠:趋势筛选指标终身仅需 50 美元。 ( 原价 250$ ) (优惠延长) 体验趋势筛选器 100% 无需重新绘制的准确性,确保您的交易决策不受过去价格变化的影响。 释放多时间框架和多货币功能的多功能性,使您能够以无与伦比的信心在外汇、商品、加密货币和指数领域进行交易。 利用 Trend Screener 的综合策略套件增强您的交易: - 趋势跟踪策略和趋势延续策略 :趋势筛选器的趋势跟踪策略提供清晰的趋势延续信号,让您有效捕捉趋势走势并管理风险。 - 反转策略和早期入场点策略 :趋势筛选器的反转策略可检测市场方向的潜在变化,使您能够预测趋势反转并利用疲弱的市场趋势。通过早期入场点,您可以在潜在的趋势变化之前定位自己 获取可观的利润。 - 倒卖策略: 趋势筛选器的倒卖
CGE Trading Suite
Carl Gustav Johan Ekstrom
5 (2)
Institutional-Grade Analytics for MT5 C GE Trading Suite delivers the analytical edge typically reserved for professional trading desks. The platform integrates a full suite of analytical tools into one seamless workflow: dynamic grid mapping, liquidity behavior analysis, ECM, trend lines, MIDAS, trade cycles, and directional channel projections. Together, these provide a unified view of market structure and momentum. Directional clarity is further enhanced by the capital flow index, which meas
Power Bar MT5
Daniel Stein
在冒真金白银之前, 先看看哪种策略真正适合你的品种。 Power Bar 可在任何品种和任何时间周期上检测 极端价格K线 , 然后即时回测3种不同的交易策略, 让你并排比较胜率、盈亏比和收益。全部集成在一个交互式面板中。 无需猜测。无需过度拟合。只看数据。 Power Bar 有何独特之处? 大多数指标只给你一个信号, 让你猜测它是否有效。Power Bar 更进一步: 它用 三种策略 测试每个信号并展示统计数据。一键切换 FlipFlop、Momentum 和 Reversal, 即刻看到数据变化。 FlipFlop - 始终持仓。信号入场, 反向信号出场。我们的研究表明, 这在 US30、US500 和 DAX 等趋势性指数上效果最佳。 Momentum - 顺信号方向交易。基于 ATR 的固定 SL/TP。适用于趋势延续形态的均衡方法。 Reversal - 逆信号交易(反向操作)。我们的回测显示, 在 JPY 外汇交叉盘上胜率超过 70%, 因为极端K线标志着衰竭而非延续。 更改参数, 即时查看结果 无需打开指标属性。直接在面板中通过 +/- 按钮调整 ATR 倍数、周期、
Btmm state engine pro
Garry James Goodchild
5 (4)
BTMM State Engine Pro is a MetaTrader 5 indicator for traders who use the Beat The Market Maker approach: Asian session context, kill zone timing, level progression, peak formation detection, and a multi-pair scanner from a single chart. It combines cycle state logic with a built-in scanner dashboard so you do not need the same tool on many charts at once. What it does Draws the Asian session range; session times can follow broker server offset or be set in inputs. Tracks level progression (L
Atomic Analyst MT5
Issam Kassas
3.94 (31)
首先值得强调的是,该交易指标是非重绘、非延迟的指标,这使其成为手动和机器人交易的理想选择。 用户手册:设置、输入和策略。 Atomic Analyst是一种PA价格行动指标,利用价格的力量和动量来寻找市场上更好的机会。配备了高级过滤器,可帮助去除噪音和假信号,并提高交易潜力。使用多层复杂的指标,Atomic Analyst扫描图表,并将复杂的数学计算转化为任何初学者都能理解并用来做出一致交易决策的简单信号和颜色。 “Atomic Analyst”是专为新手和经验丰富的交易者量身定制的综合交易解决方案。它将高级指标和一流功能融合为一体的交易策略,使其成为所有类型交易者的多功能选择。 日内交易和剥头皮策略:专为快速准确的日内交易和短期交易而设计。 日内和摆动交易策略:可用作追求价格大幅波动的日内和摆动交易者的可靠工具。 多货币和市场:凭借其可靠的精度,在不同的工具和市场上运作。 多个时间框架:可在多个时间框架上使用,性能良好。 稳定性:所有指标均不重绘、不重绘和不滞后,确保可靠的信号。 信号清晰度:提供箭头信号,用于清晰的入场和出场点。 实时警报:通过交易入场、SL和TP警报通知交易者
FX Power MT5 NG
Daniel Stein
5 (31)
FX Power:分析货币强度,助您做出更明智的交易决策 概述 FX Power 是一款专业工具,帮助您全面了解主要货币和黄金在任何市场条件下的真实强度。通过识别强势货币用于买入,弱势货币用于卖出, FX Power 简化了交易决策,并帮助您发现高概率的交易机会。不论您是想跟随趋势还是通过极端的 Delta 值预测反转,这款工具都能完美适应您的交易风格。别再盲目交易——用 FX Power 让您的交易更加智慧。 1. 为什么 FX Power 对交易者极具价值 实时货币和黄金强度分析 • FX Power 实时计算并显示主要货币和黄金的相对强度,助您全面了解市场动态。 • 监控领先或落后资产,轻松识别值得交易的货币对。 全面的多时间框架视图 • 跟踪短期、中期和长期时间框架的货币和黄金强度,以便将您的交易策略与市场趋势保持一致。 • 无论是快进快出的短线交易还是更长期的投资策略, FX Power 都能为您提供所需的信息。 Delta 动态分析用于趋势和反转 • 极端 Delta 值常常预示反转机会,而平缓的 Delta 变化则确认趋势延续。 • 使用 Delta 分析,轻
OmniSync Projection
Antonio-alin Teculescu
5 (1)
Chronos Fractal Engine is an innovative price projection indicator for MetaTrader 5, designed to transform your technical analysis by intelligently identifying and projecting historical price patterns. Built upon an advanced correlation algorithm and the fractal principles of the market, this powerful tool visualizes potential future price movements, giving you a unique edge in your trading decisions. What is Chronos Fractal Engine? At its core, the Chronos Fractal Engine employs a sophisticat
Bill Williams Advanced
Siarhei Vashchylka
5 (11)
Bill Williams Advanced is designed for automatic chart analysis using Bill Williams' "Profitunity" system. The indicator analyzes four timeframes at once. Manual (Be sure to read before purchasing) Advantages 1. Analyzes the chart using Bill Williams' "Profitunity" system. Signals are displayed in a table in the corner of the screen and on the price chart. 2. Finds all known AO and AC signals, as well as zone signals. Equipped with a trend filter based on the Alligator. 3. Finds "Divergence Bar
Berma Bands
Muhammad Elbermawi
5 (8)
Berma 波段 (BBs) 指标对于寻求识别和利用市场趋势的交易者来说是一种有价值的工具。通过分析价格与 BBs 之间的关系,交易者可以辨别市场是处于趋势阶段还是区间波动阶段。 访问[ Berma Home Blog ] 了解更多信息。 Berma 带由三条不同的线组成:上 Berma 带、中 Berma 带和下 Berma 带。这些线围绕价格绘制,直观地表示价格相对于整体趋势的变动。这些带之间的距离可以洞察波动性和潜在的趋势逆转。 当 Berma Bands 线相互分离时,通常表明市场正在进入横盘或区间波动时期。这表明缺乏明确的方向性。交易者可能会发现在这些时期内很难识别趋势,因此可能需要等待更清晰的趋势出现。 当 Berma Bands 线汇聚成一条线时,通常表示趋势环境强劲。这种汇聚表明存在明显的方向性偏差,因为价格波动性足以随趋势而变化。交易者可能会发现在这些时期更容易识别潜在的入场点和出场点,因为趋势的势头可以提供有利的交易机会。然而,重要的是要注意整体趋势中的潜在回调或修正。 Berma 带根据价格蜡烛图与上带和下带的相互作用提供明确的买入和卖出信号。当价格蜡烛图首
Market Structure Order Block Dashboard MT5 是一款专为希望直接在图表上解读市场结构和主要价格反应区域的交易者设计的MT5指标。它结合了BOS、ChoCH、订单块(Order Blocks)、公允价值缺口(FVG)、流动性、Kill Zones、成交量分布图以及一个紧凑的面板,便于快速分析。 本指标面向使用市场结构、ICT和Smart Money概念作为决策框架的交易者。它可以帮助以更结构化的方式识别趋势延续、可能的反转、价格失衡、流动性目标和关注区域。 面向买家的资源 购买后可通过MQL5私信申请获取完整的PDF使用指南和参数配置建议。通过MQL5私信提供直接技术支持。 1.20版本带来两项重要新增: Pending BOS / Pending ChoCH 检测 和 可拖动面板 (按住面板标题栏即可将其拖动到图表任意位置,不影响图表本身)。当K线收于前一摆动点之外时,Pending Breaks 立即显示待确认的结构突破,无需等待经典的摆动确认。 重要 本产品仅为指标。它不会自动开仓、平仓或管理仓位。它不是EA(智能交易系统)。 主要功能 市场
Auto Optimized Parabolic RSI: 高级 3D 动量引擎 大多数零售指标之所以失效,是因为它们依赖于静态输入,一旦市场波动率发生变化,这些输入就会崩溃。Auto Optimized Parabolic RSI 通过不断重新计算自身的数学优势,解决了“指标衰退”的问题,将机构级别的量化自适应能力直接引入您的 MT5 终端。 核心优势:定制的内存 3D 优化 标准的自动优化器通常会导致 MT5 平台卡顿,因为它们通过标准的指标调用使终端超载。该工具完全绕过了这些性能瓶颈。内部引擎采用定制的原生基于 RAM 的计算器构建,每次加载图表或更改时间周期时,它都会执行极速的 3D 网格搜索。它同时扫描 RSI 周期(频率)、SAR 步长(加速度)和 SAR 最大值(速度限制),在绝对的毫秒级时间内测试数以万计的参数组合,且完全不会拖慢您的平台。它不是仅仅寻找一个“不错”的设置,而是映射整个参数空间,以寻找资产当前动量结构的绝对全局最大值。 严格的财务评分与逼真的交易模拟 与基于抽象“指标点数”进行优化评分的业余工具不同,该引擎的 3.10 版本严格与资金数学挂钩。每一个历史
Crystal Heikin Ashi Signals
Muhammad Jawad Shabir
5 (2)
Crystal Heikin Ashi Signals - Professional Trend & Signal Detection Indicator Advanced Heikin Ashi Visualization with Intelligent Signal System for Manual & Automated Trading Final Price: $149 ---------> Price goes up $10 after every 10 sales . Limited slots available — act fast . Overview Crystal Heikin Ashi Signals is a professional-grade MetaTrader 5 indicator that combines pure Heikin Ashi candle visualization with an advanced momentum-shift detection system. Designed for both manual traders
Meridian Pro
Ottaviano De Cicco
5 (1)
Meridian Pro:MT5专业多时间框架趋势矩阵 概览 Meridian Pro 是 Merkava Labs 推出的多时间框架趋势矩阵,将方向状态、强度、动量条件和矩阵一致性压缩到一个紧凑面板中。一个自适应引擎,从M1到W1一致应用。无需逐品种调参。无需堆叠指标。一个结构化读数覆盖所有资产和所有时间框架。 上市优惠 — Meridian Pro 优惠价 USD 99 (限时)。常规价格:USD 149 。 1. Meridian Pro 为何不同 一个引擎,而非互不相连的指标仪表盘 许多MTF仪表盘只是在各时间框架重复原始指标状态。Meridian Pro在整个矩阵中使用一个自适应趋势引擎,面板中的每一行都来自同一个结构化框架。这使其读取快速、使用简洁,在真实图表条件下实用。 合成时间框架架构 Meridian Pro不依赖常规的零售MTF方法,而是从 M1数据 构建统一的内部矩阵结构。无经典MTF同步问题。无因脆弱的高时间框架拼接导致的重绘或延迟。无因不稳定时间框架依赖导致的面板冻结。在不同高时间框架数据质量的经纪商之间具有更好的稳健性。 2. 面板显示内容 Bias — 每
FX Levels MT5
Daniel Stein
5 (13)
FX Levels:适用于所有市场的高精度支撑与阻力 快速概览 想要精准确定适用于任何市场(外汇、指数、股票或大宗商品)的支撑与阻力吗? FX Levels 将传统的“Lighthouse”方法与前沿的动态分析相结合,实现近乎通用的准确性。依托真实经纪商经验和自动化的每日与实时更新, FX Levels 帮助您捕捉价格反转点、设置合理的盈利目标,并自信地管理交易。立即使用,体验更准确的支撑/阻力分析如何助力您的交易更上层楼! 1. 为什么 FX Levels 对交易者非常有利 极度精准的支撑 & 阻力区 • FX Levels 专为不同经纪商提供的行情源和时间设置而设计,可生成几乎相同的价位区,解决数据不一致的常见问题。 • 这意味着无论您在哪里交易,都能获得稳定一致的水平线,为策略打下更加牢固的基础。 结合传统与先进技术 • 通过将久经考验的“Lighthouse”方法与动态分析相融合, FX Levels 不仅限于每日刷新,还可针对新的价格波动进行即时更新。 • 您可以选择经典的静态方式,或实时捕捉新出现的水平,以贴近最新的市场行为。 识别清晰的反转点 • FX Lev
Entry Points Pro for MT5
Yury Orlov
4.48 (138)
这款指标用于 MT5,可提供准确的入场交易信号,且无重绘。 它可应用在任何金融资产:外汇、加密货币、贵金属、股票、指数。 它将提供极其精准的评估,并告诉您何时开仓和平仓的最佳时机。 观看 视频 (6:22),其中包含一个仅处理单一信号的示例,该信号即可值回指标购价! 大多数交易者在 Entry Points Pro 指标的帮助下,在第一个交易周内即改善了他们的交易结果。 订阅我们的 Telegram 群 ! Entry Points Pro 指标的益处。 入场信号无重绘 如果信号出现,并得到确认,则它不会再消失;不像是重绘指标,它会导致重大的财产损失,因为它们可以在显示信号后再将其删除。 无差错开仓 指标算法可令您找到入场交易(买入或卖出资产)的理想时机,从而提高每位交易者的成功率。 Entry Points Pro 可操作任何资产 它允许您在 MT5 平台上交易任何经纪商的加密货币、股票、贵金属、指数、大宗商品和货币。 提供任何方向的信号 Entry Points Pro 指标提供针对任意价格走势的入场交易信号 - 上涨、下跌或横盘(横向)。 最大盈利潜力 离场信号
作者的更多信息
TimePrice Free
Du Zhi Shan Tian
1 (1)
Display the date, time and price according to the movement of the mouse cursor on the chart This is useful for discretionary trading. It is an indispensable tool for verifying and studying past market prices and trades. Characteristic Date,Time and Price are displayed. The value follows the movement of the mouse. You can change the color of the text. Please refer to the video on youtube. For MT5 only.
FREE
TimePrice MT4
Du Zhi Shan Tian
Display the date, time and price according to the movement of the mouse cursor on the chart This is useful for discretionary trading. It is an indispensable tool for verifying and studying past market prices and trades. Large and easy-to-read characters It is easy to see even if your eyesight is weak. Also, you can tell the date and price to YouTube and webinar viewers in an easy-to-understand manner. Characteristic Date,Time and Price are displayed. The value follows the movement of the mouse.
CandleStick MT4
Du Zhi Shan Tian
What you can do with CandleStick CandleStick is a useful indicator for doing MTF analysis. This indicator displays the CandleStick of another time frame on the chart . By understanding the information in multiple time charts at the same time, it is easier to understand the overall market view. It is also a useful tool for validating and studying past quotes and trades. There are similar products made by others, but I designed and developed it so that it is easy for me to use. Features of Candle
TimePrice MT5
Du Zhi Shan Tian
Display the date, time and price according to the movement of the mouse cursor on the chart This is useful for discretionary trading. It is an indispensable tool for verifying and studying past market prices and trades. Large and easy-to-read characters It is easy to see even if your eyesight is weak. Also, you can tell the date and price to YouTube and webinar viewers in an easy-to-understand manner. Characteristic Date,Time and Price are displayed. The value follows the movement of the mouse.
筛选:
krisnara123
2180
krisnara123 2024.08.04 13:27 
 

Tian-san,I request a small feature to add Range "High-Low" of the HTF candle .Kindly also provide options for Font color and Font Size.Thanks !I am really hoping that you will implement this feature.I will say special thanks in my post.

3086440 Thiet
27
3086440 Thiet 2022.05.21 10:06 
 

I have receive your indicator , but this indicator have not H2 Candle on Chart M15. Can you update for me. thank very much.

回复评论