Overview Cardwell Range Analyze reads the market through an RSI range regime, inspired by Andrew Cardwell's RSI rules, combined with a trend filter. It adds higher timeframe confirmation and an ADX filter to avoid weak, sideways markets. When momentum and trend agree, the indicator prints a Buy or Sell signal and draws a complete trade plan on the chart: Entry, Stop Loss and three Take Profit targets, with shaded risk and reward zones. A compact dashboard summarizes the market state at a glance.
Laguerre SuperTrend Clouds adds an Adaptive Laguerre averaging algorithm and alerts to the widely popular SuperTrend indicator. As the name suggests, Laguerre SuperTrend Clouds (LSC) is a trending indicator which works best in trendy (not choppy) markets. The SuperTrend is an extremely popular indicator for intraday and daily trading, and can be used on any timeframe. Incorporating Laguerre's equation to this can facilitate more robust trend detection and smoother filters. The LSC uses the
The Accumulation / Distribution is an indicator which was essentially designed to measure underlying supply and demand. It accomplishes this by trying to determine whether traders are actually accumulating (buying) or distributing (selling). This indicator should be more accurate than other default MT5 AD indicator for measuring buy/sell pressure by volume, identifying trend change through divergence and calculating Accumulation/Distribution (A/D) level. Application: - Buy/sell pressure: above
An indicator of pattern #31 ("Long Island") from Encyclopedia of Chart Patterns by Thomas N. Bulkowski. The second gap is in the opposite direction.
Parameters: Alerts - show alert when an arrow appears Push - send a push notification when an arrow appears (requires configuration in the terminal) GapSize - minimum gap size in points ArrowType - a symbol from 1 to 17 ArrowVShift - vertical shift of arrows in points ShowLevels - show levels ColUp - color of an upward line ColDn - color of a d
Noize Absorption Index - is the manual trading system that measures the difference of pressure between bears forces and bulls forces. Green line - is a noize free index that showing curent situation. Zero value of index shows totally choppy/flat market.Values above zero level shows how powerfull bullish wave is and values below zero measures bearish forces.Up arrow appears on bearish market when it's ready to reverse, dn arrow appears on weak bullish market, as a result of reverse expectation.
SMART ATR GRID PRO++ – Adaptive Grid Intelligence Suite is a next-generation, institutional-grade grid trading indicator engineered for traders who demand precision, adaptability, and comprehensive market structure analysis. By seamlessly integrating Adaptive Volatility Grid System , KAMA Candle Trend Filtering , Multi-Factor Trend Detection (ADX + EMA20/50) , Dynamic Heatmap Zone Engine , and Real-Time Market Regime Classification , this indicator delivers a complete decision-making
** All Symbols x All Timeframes scan just by pressing scanner button ** Discount: The price is $50$, But now it is just $39, Limited time offer is active.
*** Contact me to send you instruction and add you in "Trend Reversal group" for sharing or seeing experiences with other users. Introduction: Trendlines are the most famous technical analysis in trading . Trendlines continually form on the charts of markets across all the different timeframes providing huge opportunities for traders
CosmiCLab SMC FIBO CosmiCLab SMC FIBO is a professional trading indicator designed for traders who use Smart Money Concepts (SMC), market structure analysis and Fibonacci retracement levels. The indicator automatically detects market swings and builds Fibonacci levels based on the latest impulse movement.
It also identifies market structure changes such as BOS (Break of Structure) and CHOCH (Change of Character), helping traders understand the current market direction. CosmiCLab SMC FIBO also pr
Think of an indicator that instantly shows you all supports, resistances and turncoats and can send a notification to your phone or an alarm on your computer. In addition to all these, it groups how many times it has entered each field and, accordingly, the strength of the field. Supply Demand And Turncoat is at your service. Setup for any TimeFrame and Chart you want and enjoy easy trading. Features: Ability to select the fields to be shown (weak, untested, turncoat, verified, proven) Merge fie
Visual CrossPulse Dynamics: Trade with the Market's True Rhythm Unlock a new level of market insight with Visual CrossPulse Dynamics, a sophisticated trading indicator designed to adapt to ever-changing volatility and reveal the true direction of the trend. Are you tired of indicators that lag in fast-moving markets or give false signals during consolidation? The Visual CrossPulse Dynamics indicator solves this problem by using an advanced, adaptive algorithm that intelligently adjusts to the m
TRI Visualizer MT5 – Thermodynamic Market Analysis Overview
The TRI (Thermal Range Indicator) Visualizer Enhanced is a rare market analysis indicator that goes beyond conventional technical analysis, applying principles of thermodynamics from physics. It interprets market price fluctuations as “thermodynamic energy,” enabling the highly accurate detection of subtle market changes that are often overlooked. Innovative Mechanisms 1. Dual Calculation Engines Classic TRI Mode Formula: |Close
The SuperTrend indicator is a popular technical analysis tool used by traders and investors to identify trends in the price of a financial instrument, such as a stock, currency pair, or commodity. It is primarily used in chart analysis to help traders make decisions about entering or exiting positions in the market. this version of super trend indicator is exactly converted from trading view to be used in MT5
Unlock profitable buy setups with the DC Dynamic Scalping Indicator for Crash , purpose-built for consistent scalping and small account growth. This expertly crafted, non-repainting indicator detects optimal buy signals on Crash indices , ensuring you're in sync with the trend thanks to the built-in Dynamic Trend Filter . A clean blue background template is also included for seamless charting and visual clarity. Key Features: Trend-Based Signal Logic – The Dynamic Trend Filter ensures all b
Price Magnet — Price Density and Attraction Levels Indicator Price Magnet is a professional analytical tool designed to identify key support and resistance levels based on statistical Price Density. The indicator analyzes a specified historical period and detects price levels where the market spent the most time. These zones act as “magnets,” attracting price action or forming a structural base for potential reversals. Unlike traditional Volume Profile tools, Price Magnet focuses on price-time d
Crash 1000 Scalping Indicator for the Crash 1000 Deriv Synthetic Index. Introduction The Crash 1000 Scalping Indicator is a specialized tool designed for the Crash 1000 index on the Deriv Synthetic market. This indicator is particularly useful for scalping on the M1 timeframe, helping traders to identify precise entry and exit points for buy positions. It is designed to be non-repainting, providing clear signals with audible alerts and push notifications, and is compatible with mobile devices th
HAT IT DOES MONTHLY HIGH & LOW — AUTO-DRAWN EVERY MONTH Draws the High and Low of every month for the current year (or any year you set). Each level extends as a horizontal ray into the future so you always see where price is reacting to historical monthly extremes. Color-coded (blue = high, red = low), labeled (JAN HIGH, FEB LOW etc.), fully customizable width and style. Toggle individual months on or off. WEEKLY HIGH & LOW
Advanced Lot & Profit Monitor PRO is a powerful MT5 indicator that provides real-time monitoring of your trading positions directly on the chart. It displays the number of orders, total lot sizes, and profit (including swap) for Buy and Sell positions separately, as well as the overall account performance. Designed with a clean and customizable interface, this tool helps traders stay in control of their exposure and risk at all times. Key Features: Real-time monitoring of open positions Sepa
Cumulative delta indicator As most traders believe, the price moves under the pressure of market buying or selling. When someone redeems an offer standing in the cup, the deal is a "buy". If someone pours into the bid standing in the cup - the deal goes with the direction of "sale". The delta is the difference between purchases and sales. A cumulative delta - the difference between the cumulative sum of purchases and sales for a certain period of time. It allows you to see who is currently contr
Multi Timeframe Smc Bias Finder Trading in alignment with higher timeframe structure is one of the most consistently profitable habits a trader can build. The difficulty has always been execution: switching between timeframes, manually reading structure, and keeping track of whether the Daily, 4-Hour and 1-Hour are all pointing in the same direction before committing to a position. Multi Timeframe Smc Bias Finder resolves that entirely. Three tools in one indicator: A live multi-timeframe bias d
Trend Indicator Multi-timeframe trend scoreboard with box system, ATR impulse arrows and automatic score for MetaTrader 5.
Panel Position The scoreboard panel can be freely positioned in the chart using X and Y coordinates.
Parameter Default Description X 260 Horizontal position of the panel (pixels from left) Y 25 Vertical position of the panel (pixels from top)
Timeframes The scoreboard displays three columns. Each column can be set to any timeframe independently.
Parameter Default Descri
GOLD FIBONACCI SNIPER M5 Description GOLD FIBONACCI SNIPER M5 is a professional MetaTrader 5 indicator specially developed for XAUUSD (Gold) on the M5 timeframe. The indicator uses Fibonacci retracements combined with trend analysis, volatility filters, candle rejection patterns, and market strength confirmation to identify high-probability entry opportunities. The system automatically detects retracement zones between the 38.2, 50, and 61.8 Fibonacci levels, which are commonly considered instit
The Trend Duration Forecast MT5 indicator is designed to estimate the probable lifespan of a bullish or bearish trend. Using a Hull Moving Average (HMA) to detect directional shifts, it tracks the duration of each historical trend and calculates an average to forecast how long the current trend is statistically likely to continue. This allows traders to visualize both real-time trend strength and potential exhaustion zones with exceptional clarity. KEY FEATURES Dynamic Trend Detection: Utiliz
What Is Trend Master Pro? Trend Master Pro is a professional-grade trend trading indicator built for MetaTrader 5. It was designed with one goal in mind — to keep you on the right side of the market at all times by combining three powerful technical tools into a single, clean, easy-to-read display directly on your price chart. Instead of cluttering your screen with multiple separate indicators, Trend Master Pro fuses an EMA Ribbon trend filter , a ZigZag swing point engine , and a breako
Fibo Daily Channel Indicator The Indicator is a powerful tool for traders, providing precise daily support and resistance levels based on Fibonacci retracement and extension calculations. This indicator automatically draws key pivot points (PP, R1, R2, S1, S2) as well as additional extension levels (R3, R4, S3, S4), helping traders identify potential reversal and breakout zones with ease. It includes customizable alerts and push notifications, allowing traders to receive updates whenever the pr
Welcome to ENTRY IN THE ZONE AND SMC MULTI TIMEFRAME Entry In The Zone and SMC Multi Timeframe is a professional trading indicator built on Smart Money Concepts (SMC) , combining market structure analysis with a No Repaint BUY / SELL signal system in a single indicator. It helps traders understand market structure more clearly, identify key price zones, and focus on higher-quality trading opportunities. By combining Multi-Timeframe Analysis , Points of Interest (POIs) , and real-time signals, th
Neuro Poseidon is a new indicator by Daria Rezueva. It combines precise trading signals with adaptive TP/SL levels - creating best possible trades as a result!
Message me and get Neuro Poseidon Assistant as a gift to automize your trading process!
What makes it stand out?
1. Proven profitability on all assets and timeframes
2. Only confirmed BUY and SELL signals present on the chart
3. Adaptive TP & SL levels generated by the software for each trade
4. Easy to understand - suitable for al
ARICoin is a powerful trading companion designed to generate high-probability entry signals with dynamic TP/SL/DP levels based on volatility. Built-in performance tracking shows win/loss stats, PP1/PP2 hits, and success rates all updated live. Key Features: Buy/Sell signals with adaptive volatility bands Real-time TP/SL/DP levels based on ATR Built-in MA Filter with optional ATR/StdDev volatility Performance stats panel (Success, Profit/Loss, PP1/PP2) Alerts via popup, sound, push, or email Cust
Crystal Heikin Ashi Signals - Professional Trend & Signal Detection Indicator Advanced Heikin Ashi Visualization with Intelligent Signal System for Manual & Automated Trading
Final Price: $149 ---------> Price goes up $10 after every 10 sales .
Limited slots available — act fast .
Overview Crystal Heikin Ashi Signals is a professional-grade MetaTrader 5 indicator that combines pure Heikin Ashi candle visualization with an advanced momentum-shift detection system. Designed for both manual traders
ARIPoint is a powerful trading companion designed to generate high-probability entry signals with dynamic TP/SL/DP levels based on volatility. Built-in performance tracking shows win/loss stats, PP1/PP2 hits, and success rates all updated live. Key Features: Buy/Sell signals with adaptive volatility bands Real-time TP/SL/DP levels based on ATR Built-in MA Filter with optional ATR/StdDev volatility Performance stats panel (Success, Profit/Loss, PP1/PP2) Alerts via popup, sound, push, or email Cu
GEM Signal Pro GEM Signal Pro 是一款適用於 MetaTrader 5 的趨勢跟隨指標,專為希望在圖表上獲得更清晰訊號、更有結構的交易設定,以及更實用風險管理的交易者而設計。 它不僅僅顯示一個簡單的箭頭,GEM Signal Pro 還能以更清晰、更易讀的方式呈現完整的交易思路。當條件確認完成後,指標可在圖表上顯示進場價、止損價與止盈目標,幫助交易者更有效率地評估交易設定。 運作方式 該指標首先根據其內部邏輯識別有效的初始訊號。 當確認條件滿足後,GEM Signal Pro 會在圖表上顯示完整的交易設定。這讓交易者可以更清楚地看到交易結構,並減少手動分析與計算的工作量。 圖表上的交易價位 對於已確認的訊號,GEM Signal Pro 可顯示: 進場價
止損價
止盈 1
止盈 2
止盈 3
風險報酬比 這讓交易設定更容易理解,也有助於讓圖表分析更有條理。 內建風險管理 風險管理是此指標設計的重要部分。 止損位基於近期市場結構,結合附近的擺動高低點與可選的 ATR 緩衝距離。這能讓交易價位更貼近當前市場條件,而不只是依賴固定距離。 圖表資訊面板 GEM Si
SkyHammer Signal Pro Professional No-Repaint Trend Signal Indicator with Locked Entry, SL and TP Levels SkyHammer Signal Pro is a structured trend and momentum signal indicator designed for traders who want clear, fixed, and verifiable trading signals. It works best on lower timeframes such as M1 and M5 . The indicator does not try to predict tops or bottoms. Instead, it waits for confirmed market structure, trend direction, momentum strength, volatility quality, and target space before generati
BTMM State Engine Pro is a MetaTrader 5 indicator for traders who use the Beat The Market Maker approach: Asian session context, kill zone timing, level progression, peak formation detection, and a multi-pair scanner from a single chart. It combines cycle state logic with a built-in scanner dashboard so you do not need the same tool on many charts at once.
What it does
Draws the Asian session range; session times can follow broker server offset or be set in inputs. Tracks level progression (L
FX Power:分析货币强度,助您做出更明智的交易决策 概述
FX Power 是一款专业工具,帮助您全面了解主要货币和黄金在任何市场条件下的真实强度。通过识别强势货币用于买入,弱势货币用于卖出, FX Power 简化了交易决策,并帮助您发现高概率的交易机会。不论您是想跟随趋势还是通过极端的 Delta 值预测反转,这款工具都能完美适应您的交易风格。别再盲目交易——用 FX Power 让您的交易更加智慧。
1. 为什么 FX Power 对交易者极具价值 实时货币和黄金强度分析
• FX Power 实时计算并显示主要货币和黄金的相对强度,助您全面了解市场动态。
• 监控领先或落后资产,轻松识别值得交易的货币对。 全面的多时间框架视图
• 跟踪短期、中期和长期时间框架的货币和黄金强度,以便将您的交易策略与市场趋势保持一致。
• 无论是快进快出的短线交易还是更长期的投资策略, FX Power 都能为您提供所需的信息。 Delta 动态分析用于趋势和反转
• 极端 Delta 值常常预示反转机会,而平缓的 Delta 变化则确认趋势延续。
• 使用 Delta 分析,轻
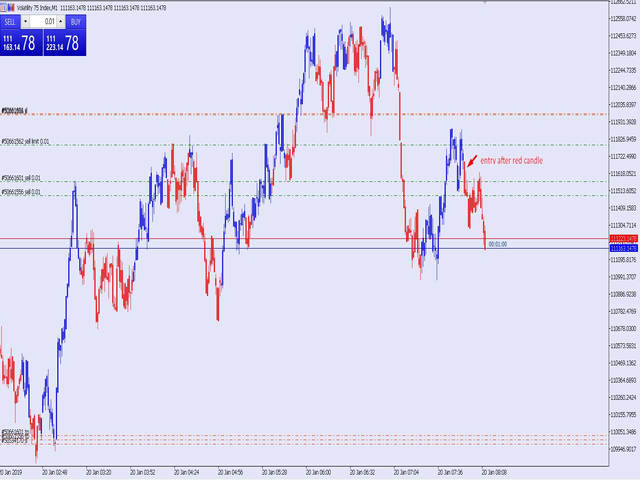
This indicator is equipped with a risk and reward calculation, whether it is the calculation of lots to be used, the determination of the price of stop loss and take profit, and also the notification of whether the colors that occur can be used or not. You can adjust the risks that make you calm by changing the settings provided in the indicator menu. this indicator can work well using H1 time frame. You only wait for an indicator command when you want to open an position.
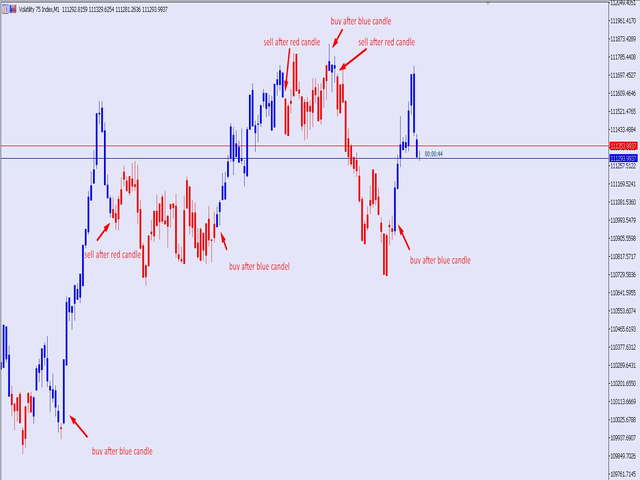
this indicator very simple and easy if you understand and agree with setup and rule basic teknical sba you can cek in link : please cek my youtube channel for detail chanel :
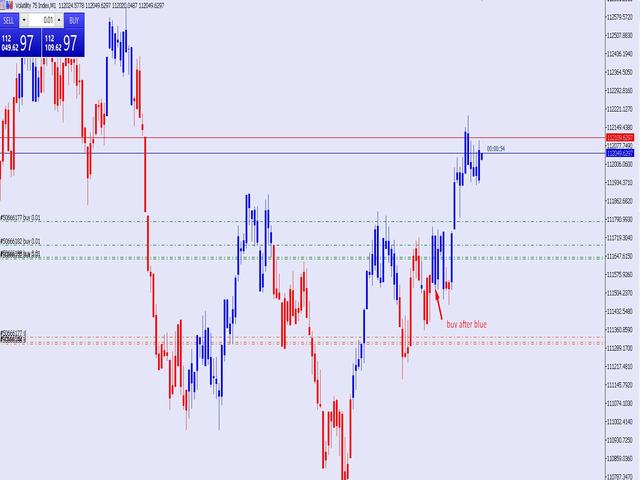
an for detail info contact me basicly setup buy (long) for this indicator is Magenta- blue and green candle or magenta - green and green candlestik and for setup sell (short) is Black - yellow - and red candle or black - red and red candlestik
this is an indicator to clarify seeing Low and High in the market and is very useful for facilitating those who are studying technical price action
this is a type of indicator that gives color to the candlestick where the indicator is divided into 3 colors red = bearish green = Bullish
Gray = base
this indicator can be used on the forex market or the mt5 binary market. https://t.me/SBA_FOREX_SIGNAL