VSA System Patterns Hunter
- 指标
- 版本: 1.0
- 激活: 5

If you are using volume spread analysis, whether your are a beginner or an expert, this system will give you a lot of features and help in your analysis.
Please watch the video to see all the features.
Features
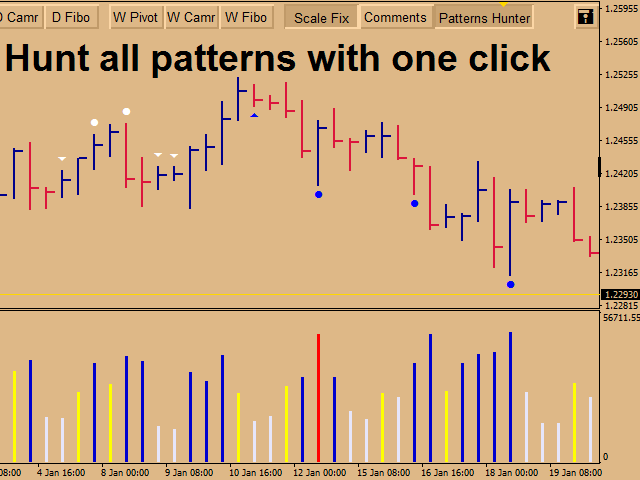
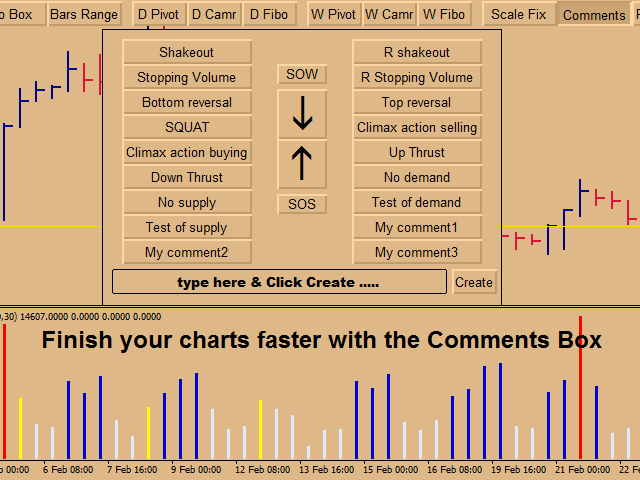
- With one click you will find all the VSA patterns on your chart.
- Bars without opening price.
- Easy to read volume indicator.
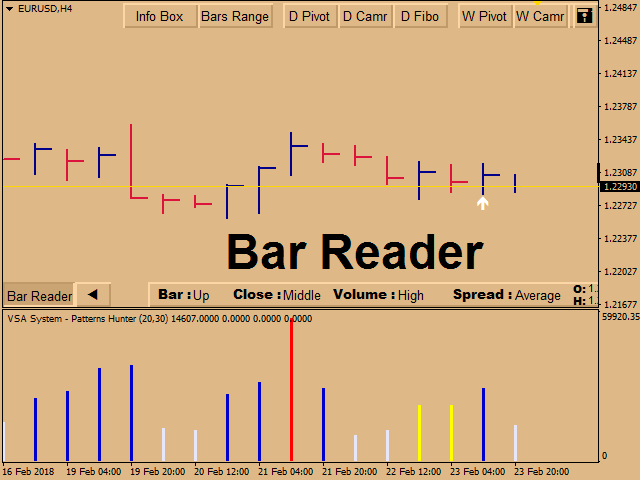
- Bar reader (Bar type - Close type - Volume type - Spread type).
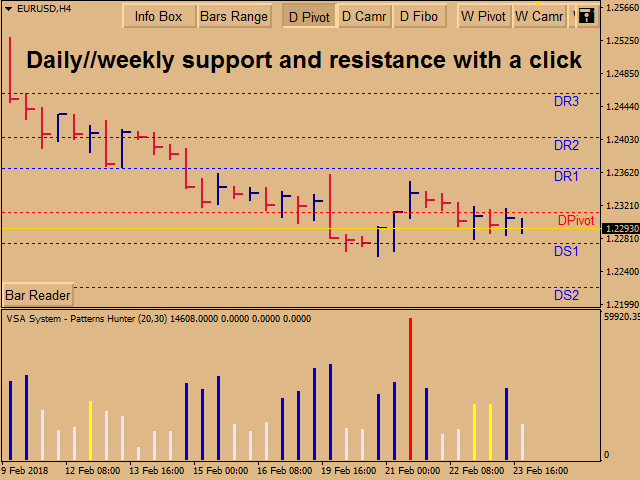
- Daily and weekly levels (Pivot - Camarilla - Fibo).
- Very light on the trading platform and moving between time frames is very fast.
- And more....
Indicator parameters
- Number_Of_Bars - Choose the number of bars you want to appear on the chart.
- Bars_WIDTH - Choose the width of bars, 1-2-3-4....
- All_Bars_Same_Color - If true, all bars will take color from input All_Bars_Colo, if false, up bars will take color from Up_Bars_Color and down bars from Down_Bars_Color.
- All_Bars_Color
- Up_Bars_Color
- Down_Bars_Color
- VAPeriod - When the system determines the volume type, it will read the volume of the previous bars, choose the number of this bars, 20 or 30 are good numbers.
- StdDeviation_Period - The standard deviation of the volume value in the current bar, It is calculated to determine whether the current volume is very abnormal from the rest of the previous bars or not, 30 good number.
- StdDeviation_Factor - Deviation factor in standard deviation equation, 2.0 good number,
- SAPeriod - When the system determines the spread type, it will read the spread of the previous bars, choose the number of this bars, 20 or 30 are good number.
- Arrow_Color - When you turn on the bar reader, an arrow appears below the bars, choose its color from here.
- Daily_Levels_parameters - from here choose the color and width and style for daily levels.
- Weekly_Levels_parameters - from here choose the color and width and style for weekly levels.
- Patterns_Hunter_parameters - from here, choose the SOS and SOW signals color on the chart, you can also choose the patterns you want to appear and prevent others.
- Comments_Box_parameters - in this system we have a very useful feature "comments box", from here you can edit its contents as you like, comments color - comments size - comments angle on chart - comments font name - etc.
All inputs are explained in the video.