Average True Power MT5
- 指标
-
Farhad Kia
 I have extensive experience as an algo-trader and a skilled MT4/5 tool developer. I have created over 1000 EAs, indicators, and scripts for MT4/5, and have won several Forex contests. Apart from programming, I also possess valuable expertise as a successful algo-trader, which allows me to provide
 - 版本: 1.0
- 激活: 5
Strongest and Weakest Currency Analysis
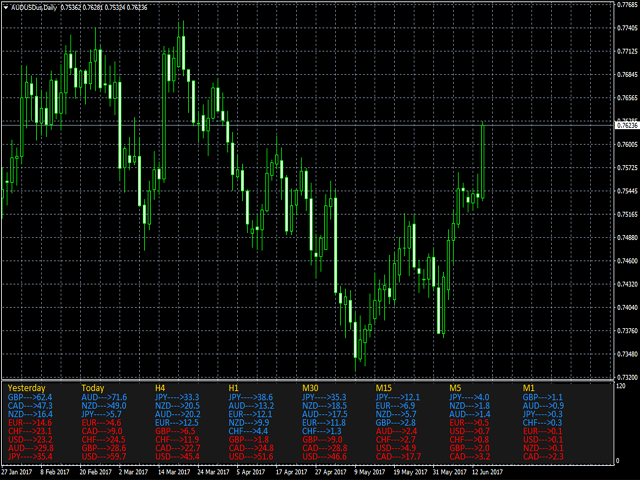
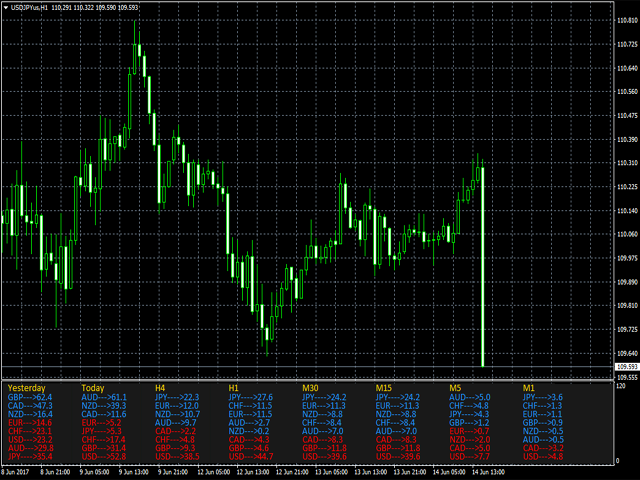
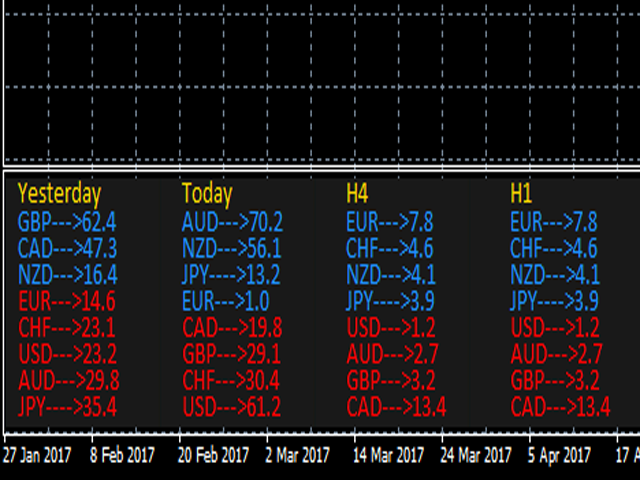
This product shows the strength of the main currencies in FOREX based on average pip gain/loss in different time-frames!
Depending on the strength of the currency, the indicator colors changes from blue to red also the orders may also be changed, allowing you to find the strongest and weakest currency at a glance!
Advantages
Whatever your trading method and strategy are, it is always important to choose the correct pairs, so this indicator will help you answer this question by calculating the average pip gain/loss of each currency and also help you to find the direction of the trends!
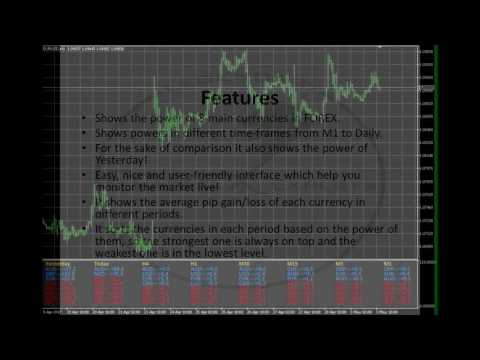
Features
- Shows the power of 8 main currencies in FOREX.
- Shows powers in different time-frames from M1 to Daily.
- For the sake of comparison it also shows the power of Yesterday!
- Easy, nice and user-friendly interface which help you monitor the market live!
- It shows the average pip gain/loss of each currency in different periods.
- It sorts the currencies in each period based on the power of them, so the strongest one is always on top and the weakest one is in the lowest level.
Input Parameters
You can put the indicator on any Currency pairs (Suggested EURUSD) and on any Time-frames (Suggested M1).
- BackGround – You can set your favorite color for panel-background, default is Black;
- Time_frames – You can set your favorite color for time-frames, default is Gold;
- Bullish – You can set your favorite color for Bullish currency, default is DodgerBlue;
- Bearish – You can set your favorite color for Bearish currency, default is Red;
Notes
When the color of the value is red, it means it is less than zero (we don’t show the minus sign).