Samurai Scalping Indy

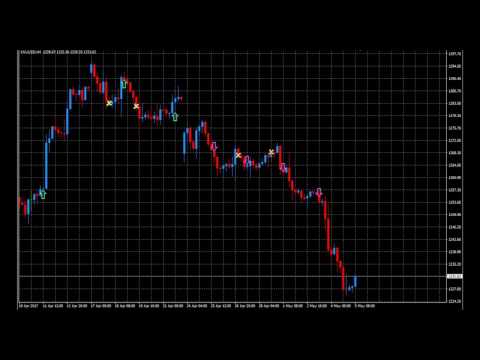
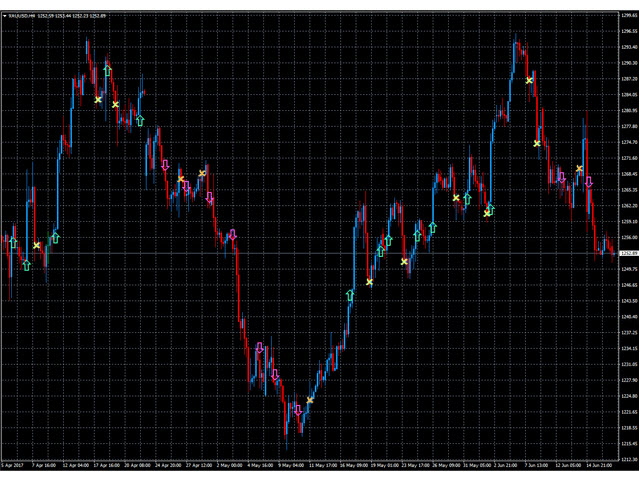
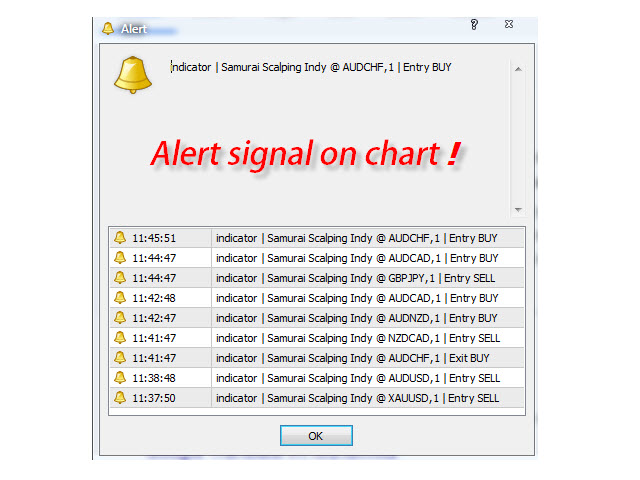
Samurai Scalping Indy is indicator signal strategy trading with Heiken Ashi, Smoothed Moving Average, and Ichimoku.

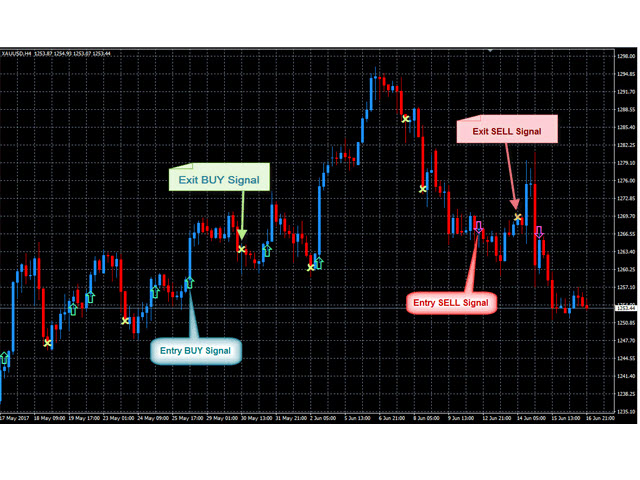
It'll alert signal with an audio or pop up on the chart for Entry BUY/SELL and Exit BUY/SELL alert signal.

Helpful for your system trading.

Its easy use to filter major trend and help for scalping strategy to follow the trend.

You can ON/OFF audio alert signal on the chart, Notifications alert on mobile, Email message alert.

(Setting the alert on Mobile/Email in MT4. Go to Tools >> Options >> Notifications/Email)


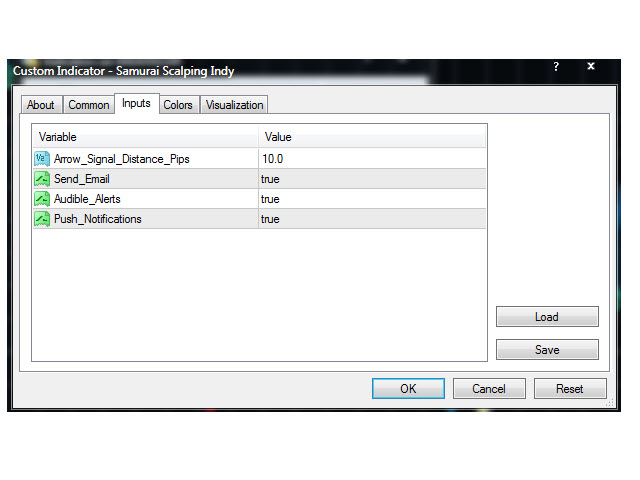
Indicator Parameters

  • Arrow_Signal_Distance_Pips - Setting distance signal between Arrow's signal and Candle (Pips).
  • Send_Email - true/false for enabling or disabling to the email alert.
  • Audible_Alerts - true/false for enabling or disabling to the audio alert.
  • Push_Notifications - true/false for enabling or disabling to the mobile alert.
推荐产品
Impulse fractals indicator - is counter-trend oriented complex market fractal pattern.  Market creates bull/bear impulse, trend starts, fractals on impulsed wave are an agressive pullback signals. Buy arrow is plotted when market is bearish and it's impulse showed up-side fractal, and sell arrow is plotted when market is bullish and it's impulse showed dn-side fractal. Main indicator's adjustable inputs : impulsePeriod - main period of impulse histogram  filterPeriod  - smoothes impulse accordi
EMA Pro Universal
Isaac Alexander Pinero Garcias
EMA Pro Universal EMA 9 / 200|全局风险控制|全经纪商通用 EA EMA Pro Universal 是一款基于 EMA 9 / EMA 200 均线交叉策略 的专业级 Expert Advisor,专为追求 稳定性、真实风险控制 以及 完全兼容任意经纪商与账户类型 的交易者而设计。 这不是一个实验型 EA。 而是基于 稳健交易逻辑、先进回撤管理机制 ,并在 CENT、PRO、Standard 及 Zero Spread 账户中经过大量实盘与回测验证的成熟系统。 主要功能特点 经过验证的清晰策略:EMA 9 / EMA 200 交叉 兼容 任何经纪商 与 任何账户类型 专业级风险管理:基于百分比的 全局累计止损(Global SL) 智能 Recovery 系统(非盲目加仓) 可控马丁格尔机制,触发全局止损后自动重置 结构性止损(基于K线)或固定止损(可选) 高级实时统计面板 针对真实回测环境优化 不依赖特定点差 无隐藏逻辑、无欺骗性策略 ️ 真实风险管理(不是营销噱头) 与市面上大多数 EA 不同:
Metatrader 4 的三个 MA 买入和卖出信号 PRO 指标是 3 MA 的交易系统,只要趋势转向相反方向,它就会发出买入和卖出信号。 该系统指标由使用 3 个不同时期的 3 条移动平均线组成。 该指标以箭头形式提供实际交易买卖信号。 在 MT4 交易平台上下载并安装指标后,它应该如下图所示。 关键点 趋势信号指标 非重绘箭头 初学者友好 非常值得添加到您的指标集合中 该指标可以与任何现有的交易策略或系统一起作为趋势反转信号确认工具。 基本交易信号 来自 Metatrader 4 的三个 MA 买入和卖出信号 PRO 指标的信号很容易解释,如下所示: 买 一旦图表上印有绿色信号箭头,就会发出买入信号。 将止损设置在支撑下方。 为预定的利润目标退出买入交易或等待卖出信号。 卖 一旦紫色信号箭头印在图表上,就会发出卖出信号。 将止损置于短期阻力之上。 为预定的利润目标退出卖出交易或等待买入信号。 可调参数和设置 MA方法,更快的MA周期,更慢的MA周期 随意探索指标的不同参数和设置以创建您自己的个性化指标设置。 关于该指标的更多信息 货币对:适用于任何货币对 交
ZhiBi Fast Scalp是很好的快速剥头皮指标系统,信号依据趋势加震荡,频繁给出Buy和Sell信号。适合所有市场品种和时间周期。 出现向上箭头即可下单Buy;出现向下箭头即可下单Sell; 参数设置说明: 【Signal_line_period】:小周期信号线的平均周期。 【Trend_line_period】:大周期趋势线的平均周期。 【Alert_No_Off】:弹窗消息的开或关;true=开、false=关; 【SendMail_No_Off】:电子邮件的开或关;true=开、false=关; 【SendNotification_No_Off】:消息推送到移动终端的开或关;true=开、false=关; 更多好用的指标网址: https://www.mql5.com/en/users/zhengqiuyang/seller
AW Three MA EA
AW Trading Software Limited
1.5 (2)
在两条移动平均线的交叉点交易的 Expert Advisor 使用第三条移动平均线来过滤当前趋势方向。它具有灵活但同时简单的输入设置。 问题解决 ->   这里 /MT5版本 ->   这里 /使用说明 ->       这里   好处: 直观简单的设置 适用于任何类型的工具和任何时间范围 具有三种类型的通知 将第一个订单与最后一个订单重叠的可插拔系统 能够自动计算交易量 专家顾问策略。 EA 使用三个移动平均线来开仓。主要的是两个移动的,快的和慢的。第三个是过滤掉市场噪音的幻灯片。 如果快速移动的信号从下向上穿过慢速移动的信号,那么这是一个买入信号。 如果快速移动的信号从上到下穿过慢速移动的信号,那么这是一个卖出信号。 使用第三次滑动时: 当快速和慢速移动平均线低于过滤移动平均线(下降趋势)时,只有卖出信号有效。 当过滤移动平均线低于(上升趋势)快速和慢速移动平均线时,只有买入信号起作用。 最快的周期最小,最慢的周期更长,滤波器滑动周期最大。 如果禁用过滤,则: 在快速和慢速移动平均线的每个交叉点,EA 将打开交易 Input variables: Main settings Si
Scalper Mars
Igor Bulgakov
3.5 (4)
Scalper Mars EA uses intraday scalping strategy. The Expert Advisor uses standard indicators MACD, RSI, EMA in its trading, does not use martingale and an order grid. A stop order is placed near local extrema, if it does not exceed the maximum value specified by the MaxStopLoss parameter. The EA uses take profit equal to the stop. The Expert Advisor is influenced by news releases. Requirements Recommended for work on the M1 timeframe. It can be traded on any currency pairs, when calculating resu
FREE
Deep Analyst Expert Advisor    (mt5  https://www.mql5.com/en/market/product/163998 ) Deep Analyst   is a professional analytical tool powered by a specialized algorithm designed for deep analysis of market cycles and price amplitude fluctuations. By analyzing market conditions over a specific timeframe, the Expert Advisor determines price strength and amplitude using a unique indicator system based exclusively on real-time data. When the global trend and its vector shift, the algorithm automati
CRT Pro WHAT PROBLEM DOES CRT PRO SOLVE? --------------------------------- When trading on low timeframes such as M1, M5, M15 or M30, it is easy to lose sight of the broader market structure. CRT Pro solves this  by overlaying H1 candles and H4 High/Low range lines directly behind your  low timeframe chart, in real time, so you always know where the higher timeframe market structure sits relative to current price — without switching charts or opening multiple windows. -----------------------
Smart Market Analyser
Elias Mtwenge
5 (1)
REMINDER: Early buyers hot price discount: Price subject to rise after first 20 copies. Starting price $65 and final price will be $1275. Secure your discounted copy Now! Smart Money Analyser Indicator User Manual 1. Introduction Welcome to the   Smart Money Analyser Indicator This powerful tool provides traders with comprehensive market analysis by combining various technical indicators to generate actionable trading signals. Designed to be user-friendly, this indicator helps traders of all
Индикатор канала с адаптивной шириной, который помогает видеть перекупленность/перепроданность , пробои границ и даёт стрелочные сигналы Buy/Sell с аккуратными оповещениями без спама . Индикатор подходит для: скальпинга и внутридневной торговли; поиска точек отката от границ канала; торговли пробоев (breakout) и возвратов (re-entry); ручной торговли и полуавтоматизации через алерты. Как работает индикатор Сглаживание (Nadaraya-Watson) Строится “умная” сглаженная линия цены (ядровая регрессия с
[ MT5 Version ]  [ Kill Zones ]  [ SMT Divergences ] How to trade using Order Blocks:  Click here User Interface Performance:  During testing in the strategy tester, the UI may experience lag. Rest assured, this issue is specific to the testing environment and does not affect the indicator's performance in live trading. Elevate your trading strategy with the  Order Blocks ICT Multi TF  indicator, a cutting-edge tool designed to enhance your trading decisions through advanced order block analys
Moving Pivot Average    The pivot indicator compares the selected period with its counterpart from the previous period. The indicator uses very flexible algorithm for pivot value calculating. It allows you to allocate in days a certain time intervals (custom bars) and calculate the average pivot value based on High, Low and Close prices of these bars. How many custom bars will be taken into account is determined by the "Days" setting. The pivot line can be considered an average trend line and us
The Trend Professor is a moving average based indicator designed for the purpose of helping the community of traders to analyse the price trend. The indicator will be displayed in the main chart as it is indicated on the screenshot section. How it works The indicator has lines of moving averages and colored histograms to depict the direction of the trend. There will be a fast signal line colored blue/yellow/red at some points. The red/yellow colored lines stands for bearish trend/signal while th
WONNFX create arrow tester. Сonstructor/Tester. Tester for buffer indicators. Converting a buffer indicator into an arrow signal on the chart. Combining two buffer indicators into one arrow signal. Filter by candle color. You can move the arrow signal several bars forward (useful in cases where the indicator gives signals 2-3 bars late "WONNFX create arrow tester" is a tool designed specifically for traders who use buffer indicators in their trading strategies. This tester converts the buffer
FREE
The product has been removed from sale。 Sales suspended, do not download. 2025/1/28 The product has been removed from sale。 Sales suspended, do not download. 2025/1/28 产品已下架  产品已下架 The product has been removed from sale。Sales suspended, do not download. 2025/1/28 The product has been removed from sale。Sales suspended, do not download. 2025/1/28 产品已下架 产品已下架 The product has been removed from sale 产品已下架 The product has been removed from sale 产品已下架  The product has been removed from sale The product
The EA trades when MACD signal cross 3 times . Best time frame 30 mins, Any pair any broker no limited, recommend minimum deposit 500$ SETTING Symbole - Set symbol to trade. Fast_EMA_period - Set Fast EMA period. Slow_EMA_period -   Set Slow EMA period. Signal_period - Set signal period. Lots - start lot. Multiple_lots - Multiply lot for next order. Max_lots -    maximum lot. Grid_boost -  Frequency of opening position (Less more order). Grid_minimum_pips - Check distance grid from last order.
Trend driver bars is the manual trading system, which defines current trend continue or it's pull-back/reverse. "Driver" bars - are price action patterns that has powerfull affect on market, defining it's near future direction. Generally, driver bars represents trend "skeleton" and often anticipates new market impulse. System plots arrows when market shows 3 pattenrs in a row(most powerfull combo-pattern), and makes fast scalping of incomming movement. Loss positions closes by common profit. Lot
Cloud Stair
Sutthichai Mungdee
Cloud Stair is an Indicator has 2 Cloud (Up Trend and Down Trend). Cloud will turn Red when trend go down. Cloud will turn Blue when trend go up. You can use this indicator as a Support and Resistance level. Trend very strong when there are no opposite side. Open Buy position when the indicator show blue cloud and no red cloud. Open Sell position when the indicator show red cloud and no blue cloud.
Ultimate Simple
Narek Avetisyan
5 (1)
Ultimate Simple - полностью автоматизированная торговая система. Торговый робот работает на любых валютных парах и на любом таймфрейме. Работа робота основана на принципе дивергенции(против основного тренда). Объем входа в рынок и риски жестко контролируются на основе алгоритмов. Количество сделок ограничено уровнем свободной маржи в процентах, которое по умолчанию равно 1500% (во входных параметрах level = 1500.00). Объем входа в рынок зависит от количества свободных средств на счету, а если с
Adjustable Consecutive Fractals  looks for 2 or more fractals in one direction and sends out a on screen alert, sound alert and push notification, for strong reversal points . Adjustable Consecutive Fractals, shows the fractals on chart along with a color changing text for buy and sell signals when one or more fractals appear on one side of price. Adjustable Consecutive Fractals is based Bill Williams Fractals . The standard Bill Williams fractals are set at a non adjustable 5 bars, BUT withe th
Infinity Trader EA
Lachezar Krastev
5 (18)
ULTIMATE SALE! Get Infinity Trader EA with a huge –60% discount ! Special Ultimate Price: $217 (Regular Price: $547 — You Save $330! Don't Miss!) Infinity Trader EA Live Results:  https://www.mql5.com/en/signals/2290275 Infinity Trader EA seamlessly integrates the strengths of Chat GPT and Gemini AI, providing unparalleled market insights and in-depth fundamental analysis. It actively adapts to ever-changing market conditions, identifying statistically significant price patterns with remarkab
Godfather
Ivan Simonika
The intelligent algorithm of the Godfather indicator accurately determines the trend, filters out market noise and generates entry and exit levels. The indicator will help in finding entry points when analyzing the price chart. The program first receives a "snapshot" of the graph, then analyzes it. The results are reported to the trader in the form of signals. The main purpose of this indicator is to determine the moments of entries and exits from transactions, so the indicator displays only th
趋势入场直方图:精准识别反转并优化您的入场点 趋势入场直方图 是一款强大的警报指标,旨在帮助您 检测趋势或价格走势何时接近其生命周期的终点并即将反转 。当市场结构发生变化时,它会及时发出警告,这通常预示着即将发生重大反转或下跌。 当新的高点或低点在可能的 耗尽点 附近形成时,该指标会仔细监测 突破和价格动量 。当根据当前趋势识别出 高概率交易设置 时,该指标会通过 绘制直方图 来将其可视化。当价格疲软到 收盘价高于或低于该绘制的直方图矩形 时,就预示着市场可能发生转变。 想看看该指标如何运作吗?请观看下面的视频! 主要特点: 早期反转警报: 在关键的耗尽点精确通知您潜在的市场结构变化,让您在市场中占据先机,预测转变。 自动结构绘制: 当价格达到耗尽水平时,指标会自动在您的图表上绘制短期市场结构,无需手动操作即可提供清晰的视觉提示。 通用兼容性: 无缝支持 所有品种和时间周期 ,为任何交易工具或策略提供多功能应用。 趋势交易者的理想选择: 非常适合确定整体趋势方向并在 较大时间周期 上精确定位最佳入场点,帮助您与主要的市场流向保持一致。 多时间周期确认: 在较低时间周期图表上寻找来自较
Market Structure Zig Zag
Lesedi Oliver Seilane
4.66 (29)
Free Market structure zig zag to assist in price action trading the screenshots describe how to use and how to spot patterns new version comes with alerts, email alert and  push notification alert can be used on all pairs  can be used on all timeframes  you can add additional confirmation indicators the indicator shows you your higher high and low highs as well as your lower lows and lower highs  the indication makes price action analysis easier to spot.
FREE
Goal Time
Mourad Ezzaki
GOAL TIME is an expert advisor based on the notion of time, it studies the change of price according to time, and it finally detects the best time to execute a good order. The EA is based on an indicator that draws a price curve in relation to time, this curve is deduced by an algorithm that analyzes old data. Then, the EA exploits the generated curve and executes the correct order. In case of incorrect choice, the EA has the mission to limit the losses. After a thorough study of this strategy o
Revolutionize Your Trading with This Powerful Indicator-Based System Are you struggling to find accurate entry and exit points in trading? Do you want a proven, indicator-driven system that helps you maximize profits and minimize risks ? Introducing our Advanced Trading System —a powerful, easy-to-use technical analysis tool designed for forex, stocks, and crypto traders . Key Features & Benefits: Precision Buy & Sell Signals – Our system generates crystal-clear buy (green) and sell (red
LordAutoFibonnaci
Igor Pereira Calil
5 (2)
Lord Auto Fibonnaci is a free indicator for Meta Trader, in order to show the most famous chart in the financial market known as "Fibonnaci". As we can see in the images below, the fibonnaci table will automatically analyze the graph for you, with trend factors through percentage, almost infallible use, you can always work when the percentage is low or high, start shopping and sales on time, great for analyzing entries! In the images below we can see an example in gold in H4, where we are at
FREE
Koala Trend Pro MT4
Ashkan Hazegh Nikrou
考拉趋势线介绍: 我创建了这个指标来帮助交易者更好地发现趋势。该指标可以显示当前趋势线。 如您所知,趋势线必须在两个最高或最低点之间。 因此,基本逻辑是找到最高和最低点。 该指示器查找历史上所有的最高和最低点,并用红色和蓝色点显示它们。 这些最高和最低点是根据深度值计算的。深度值是可调的,可以由用户更改。 深度是什么意思? 如果深度为10,则表示任何最高的烛台应该是10根蜡烛之间的最高蜡烛。在上一个第五蜡烛台和下一个第五蜡烛台之间应该有最高的蜡烛台。 如果深度为10,则表示它周围的10点之间的最低蜡烛应该是最低蜡烛,而5和5之间的最低蜡烛应该是下一根蜡烛。 “连接到XTH”选项如何工作? 该指标需要2个点才能绘制下降趋势线。他朝相反的方向看,找到第二点。您可以使用此参数对第二点进行操作。可以是第一,第二,第三,第四或第n个最大值 “连接到最低XTH”选项如何工作? 该指标需要2个点才能绘制看涨趋势线。他朝相反的方向看,找到第二点。您可以使用此参数影响第二点。可以是最低的第1,第2,第3,第4或第n个下限 您可以在此处下载该产品的免费无限版本: https://www.mql5.com
Altopium Trend
Antony Famulari
Altopium Trend is an indicator that identifies short-term trends. The signals it generates can be used to open long or short positions or can be integrated with other indicators/strategies. This is a trend indicator, be careful during narrow sideways phases. I recommend using it as a short-term trend indicator, complemented by other indicators that show the best times to enter the market. Wait for the bar to close to confirm the signal.
FREE
This indicator will allow you to evaluate single currency linear regression. WHAT IS LINEAR REGRESSION?(PIC.3) Linear regression is an attempt to model a straight-line equation between two variables considering a set of data values. The aim of the model is to find the best fit that can serve the two unknown values without putting the other at a disadvantage. In this case, the two variables are price and time, the two most basic factors in the Forex market. Linear regression works in such a way
该产品的买家也购买
Neuro Poseidon MT4
Daria Rezueva
4.94 (32)
Neuro Poseidon is a new indicator by Daria Rezueva. It combines precise trading signals with adaptive TP/SL levels - creating best possible trades as a result! Message me and get  Neuro Poseidon Assistant  as a gift to automize your trading process! What makes it stand out? 1. Proven profitability on all assets and timeframes 2. Only confirmed BUY and SELL signals present on the chart 3. Adaptive TP & SL levels generated by the software for each trade 4. Easy to understand - suitable for all
Gann Made Easy
Oleg Rodin
4.84 (165)
Gann Made Easy 是一个专业且易于使用的外汇交易系统,它基于使用先生理论的最佳交易原则。 W.D.江恩。该指标提供准确的买入和卖出信号,包括止损和获利水平。您甚至可以使用推送通知在旅途中进行交易。 购买后请联系我,即可免费获得交易指导和超棒的额外指标! 您可能已经多次听说过江恩交易方法。通常 Gann 的理论不仅对于新手交易者而且对于那些已经有一定交易经验的人来说都是非常复杂的东西。这是因为江恩的交易方法在理论上并不那么容易应用。我花了几年时间来完善这些知识,并将最好的原则应用到我的外汇指标中。 该指标非常易于应用。您所需要的只是将其附加到您的图表并遵循简单的交易建议。该指标不断进行市场分析工作并寻找交易机会。当它检测到一个好的入口点时,它会为您提供一个箭头信号。该指标还显示止损和获利水平。 换句话说,当您像先生一样进行交易时,该指标会为您提供最佳江恩建议。江恩亲自告诉你此时此刻该做什么。但最好的部分是您不需要了解任何有关江恩交易原则的知识,因为该指标会为您完成整个市场分析工作。
M1 Sniper
Oleg Rodin
5 (24)
M1 SNIPER 是一款易于使用的交易指标系统。它是一个专为 M1 时间框架设计的箭头指标。该指标可以作为独立的系统在 M1 时间框架下进行剥头皮交易,也可以作为您现有交易系统的一部分使用。虽然该交易系统专为 M1 时间框架交易而设计,但它也可以用于其他时间框架。我最初设计此方法是为了交易 XAUUSD 和 BTCUSD。但我发现这种方法在其他市场交易中也同样有用。 指标信号既可以顺势交易,也可以逆势交易。我教授一种特殊的交易技巧,帮助您利用指标信号进行双向交易。该方法基于使用特殊的动态支撑位和阻力位区域。 购买后,您可以立即下载 M1 SNIPER 箭头指标。此外,我还为所有 M1 SNIPER 工具用户免费提供下方屏幕截图所示的 Apollo Dynamic SR 指标!这两个指标的组合可以帮助您更轻松、更准确地利用 M1 时间框架进行交易。 购买后请联系我,免费获取交易提示和奖励指标! 祝您交易成功!
Dynamic Forex28 Navigator
Bernhard Schweigert
4.43 (7)
Dynamic Forex28 Navigator - 下一代外汇交易工具。 当前 49% 折扣。 Dynamic Forex28 Navigator 是我们长期流行的指标的演变,将三种功能合二为一: 高级货币强度 28 指标 (695 条评论)+ 高级货币 IMPULSE 带警报 (520 条评论)+ CS28 组合信号(奖励)。 有关指标的详细信息 https://www.mql5.com/en/blogs/post/758844 下一代强度指标提供什么? 您喜欢的原始指标的一切,现在通过新功能和更高的精度进行了增强。 主要特点: 专有货币强度公式。  所有时间范围内的平滑和准确的强度线。 非常适合识别趋势和精确进入。 动态市场斐波那契水平(市场斐波那契)。  此指标独有的独特功能。 斐波那契应用于货币强度,而不是价格图表。 适应实时市场活动以获得准确的反转区域。 实时市场动量。  第 9 行显示市场是活跃还是被动。 对于定时交易至关重要。 全面的警报和显示。  每种货币最强的买入和卖出动量。 ​​28 对的双重动量买入和卖出。 超买/超卖警告外部范围和止损。 反转
Enigmera
Ivan Stefanov
5 (8)
ENIGMERA: 市场的核心 重要提示:MQL5.com 演示版本在策略测试器中运行,可能无法完全反映 Enigmera 的功能。请查看描述、截图和视频了解详细信息。如有任何问题,请随时联系我! 该指标的代码已完全重写。版本 3.0 增加了新功能并修复了自指标发布以来积累的错误。 简介 这个指标和交易系统是金融市场的一种独特方法。ENIGMERA 使用分形周期来精确计算支撑和阻力水平。它展示了真实的积累阶段,并提供了方向和目标。无论是在趋势中还是在修正中,这个系统都能工作。 它是如何工作的 指标的大部分功能通过图表左侧的按钮控制,使得能够快速响应不同的市场情况。 按钮 ON/OFF – 显示或隐藏整个指标。 Channel – 激活支撑通道,显示可接受的偏差范围。 Dev1 (第一偏差) – 指示价格在支撑偏差内的波动,信号表示市场正在整合或积累力量。 Dev2 (第二偏差) – 显示价格在偏差之间的波动,表示趋势形成和方向。 Dev3 (第三偏差) – 表示趋势的显著加速和高波动性。 45deg (45度) – 显示市场的节奏和相对于 45 度线的运动稳定性。 Tgt1/2
Trend Catcher ind
Ramil Minniakhmetov
5 (2)
趨勢捕捉指標 趨勢捕捉指標結合了作者獨有的客製化自適應趨勢分析指標,用於分析市場價格趨勢。它透過過濾掉短期噪音,並專注於潛在的動能強度、波動性擴張和價格結構行為,來識別真實的市場方向。此外,它還結合了平滑和趨勢過濾等客製化指標,例如移動平均線、相對強弱指標 (RSI) 和波動率過濾器。 您可以在這裡查看實際運行情況以及我的其他產品: https://www.mql5.com/en/users/mechanic/seller 請注意,我不會在 Telegram 上出售 EA 或任何設置,那是騙局。所有設定都可以在我的部落格上免費取得。 重要提示!購買後請立即聯繫我,以獲取使用說明和額外獎勵! 請注意,我不會在 Telegram 上出售 EA 或任何設置,那是騙局。所有設定都可以在我的部落格上免費取得。
本指标是实践实战交易完善的波浪自动分析的指标 !  案例... 注: 波浪分级用西方叫法不习惯,因受到缠论(缠中说禅)命名方式习惯的影响,我是将基础波浪命名为 笔 ,将二级波段命名为 段 ,同时具有趋势方向的段命名为 主趋段 (以后笔记中都是这种命名方式,先告知大家),但是算法上和缠论关系不大切勿混淆.反映的是本人分析盘面总结的 千变万化纷繁复杂的运行规律 . 对波段进行了标准化定义,不再是不同人不同的浪  ,   对人为干扰的画法进行了排除,在严格分析进场起到了关键的作用 . 使用这个指标,等于将交易界面提升美感,抛弃最原始的K线交易带你进入新的交易层次.如果不是为了交易,在宣传上也将使客户观感提升层次. 指标内容: 1. 基础波浪 (笔) : 首先我们找出了价格波动过程中的基础波动拐点,当然他的有序性低,为下一步的计算提供基础. 2. 二级波段( 段 ) :在基础波浪的基础上,通过算法分析得到层级更明显的二级波段,二级波段为波浪提供了分析基础 3. 波浪( 浪 ): 有着更清晰的趋势,更清晰直观的方向.分析一个波浪是否延续,需要看二级波段的形态,分析二级的构成,可以得出波浪后
KT Alpha Hunter Arrows MT4
KEENBASE SOFTWARE SOLUTIONS
大多数箭头指标只给你一个信号,然后把剩下的判断全部留给你自己。KT Alpha Hunter Arrows 给你的,是一套完整的交易计划。 每一个信号箭头出现时,图表上都会同时绘制完整计划:入场线、止损位、四个止盈目标,以及实时 Edge 结论,告诉你当前品种和时间周期是否值得交易。套装中还包含 Trade Manager EA,在你手动入场后负责后续执行,让你在市场波动和情绪干扰下依然保持纪律。非重绘。只在K线收盘后给出信号。适用于 Forex、黄金、指数,以及你交易的其他任何品种。 核心功能 非重绘买入和卖出箭头,只在K线收盘后出现。 每个信号都带有入场线、结构性止损和四个止盈目标。 Edge Dashboard 会分别评估当前图表上的买入和卖出机会。 结论系统:No Edge、Marginal、Tradeable、Good 或 Strong。 一键 Auto Optimize 按钮,可根据当前品种和时间周期自动调整设置。 完整套装包含 Trade Manager EA,并内置五种专为本指标设计的交易管理方案。 Prop Firm Risk Panel 可在图表上实时追踪日内回撤
Scalper Inside PRO
Alexey Minkov
4.74 (68)
Scalper Inside PRO Scalper Inside PRO 是一款适用于 MetaTrader 4 的日内趋势与剥头皮指标,使用专有算法快速识别市场方向和关键目标价位。它能够自动计算进场价、出场价以及多级止盈目标,并显示详细的绩效统计,让您了解不同交易品种和策略以往的表现情况,从而帮助您为当前的市场环境选择最合适的交易工具。此外,您还可以将自己的箭头指标轻松接入 Scalper Inside PRO,快速评估其统计数据和历史表现。 该指标可用于任何交易品种和任何周期(建议在 M5 上进行日内交易),并内置多种交易策略,因此既可以作为独立的剥头皮工具使用,也可以作为您交易系统中功能强大的分析组件。 主要功能 通过专有算法(Next‑Generation Trend Detection Algorithm,NG TDA)快速识别当前市场趋势。 自动计算日内交易的进场价、出场价和多级止盈目标。 内置策略与统计模块,用于评估不同市场环境下各品种的表现。 支持接入自定义箭头指标(PRO 模式),并计算其详细信号统计数据。 适用于外汇、金属、指数、股票、商品、期货和加密货币等各类市
Neo Wave PRO
Nikolay Raykov
5 (1)
Price & Time Market Structure Indicator A professional market structure tool that analyzes waves through both price and time — not price alone. Main Description NeoWave PRO is a professional market structure indicator for MetaTrader 4 designed for traders who want to move beyond traditional one-dimensional wave tools such as ZigZag, swing indicators, and basic high/low systems. Most wave indicators analyze only one thing: Price. But a real market wave is not only a price movement. A true wave de
PRO Renko System
Oleg Rodin
5 (30)
PRO Renko Arrow Based System for trading renko charts.  准确的信号交易任何外汇工具. 另外,我将免费提供系统的附加模块! PRO Renko系统是RENKO图表上高度准确的交易系统。该系统是通用的。 该交易系统可应用于各种交易工具。 该系统有效地中和了所谓的市场噪音,打开了获得准确反转信号的通道。 该指标易于使用,只有一个参数负责产生信号。 您可以很容易地使算法适应您感兴趣的交易工具和renko酒吧的大小。 我很乐意通过提供任何咨询支持来帮助所有客户有效地使用该指标。 祝您交易成功!购买后,立即写信给我! 我将与您分享我的建议和我的renko发电机。 另外,我将免费提供系统的附加模块!
Genesis Matrix Pro is a professional multi-timeframe trend detection indicator designed to help traders identify high-quality market alignment with clarity and structure. It combines 12 different technical indicators into one visual alignment matrix, allowing traders to quickly see when market conditions are bullish, bearish, or neutral. A signal is generated only when the selected strategies are aligned, helping reduce noise and improve decision-making. PLEASE CONTACT ME AFTER PURCHASE TO GET
Current event:  https://c.mql5.com/1/326/A2SR2025_NoMusic.gif A. 什么是 A2SR ?   * 这是一个领先的技术指标(没有重绘,没有滞后)。  -  指导 : -- 在  https://www.mql5.com/en/blogs/post/734748/page4#comment_16532516 -- 和  https://www.mql5.com/en/users/yohana/blog A2SR 在确定支撑(需求)和阻力(供应)水平方面有一种特殊的技术。 与我们在网上看到的普通方式不同,A2SR 在确定实际 SR 级别时有一个独创的概念。 原技术不是从网上拿来的,也没有在网上公开过。 A2SR 将根据您的交易风格自动选择 SR 级别。 即使您正在更改时间范围,但 SR 级别仍将保留在其位置上。 因为实际的 SR 不是从你使用的时间范围内获得的。 A2SR 拥有完整的交易工具 。 实际支持(需求)和阻力(供应)的真正概念。 新闻事件和央行讲话的市场情绪。 新闻事件和趋势的主要货币强度 (MCS) 的真正概念
PZ Trend Trading
PZ TRADING SLU
4.8 (5)
许多盈利交易者不仅知道如何识别市场趋势,而且也能把握趋势建立后的交易机会。 Pz 趋势交易 指标设计用来在趋势行情中尽可能的赚取利润。 已建立的趋势提供了一揽子交易机会,但大多数趋势交易指标完全忽视了它们,让交易者在趋势行情时完全不知道该如何做!一般趋势指标只通知有关的趋势变化,但根本不足以得到卓越的回报. Pz 趋势交易 指标比一般趋势指标显示多达 20 倍的交易 , 因为它注重所谓的市场时机。它不仅显示当前的市场趋势,也有回调,内柱线的突破和调整。它令您在趋势回调之后介入,安全的柱线内突破金字塔加仓,以及发现潜在的反转,和已知的调整。 趋势改变 一个趋势改变在市场方向变化时发生。趋势变化在图表上用带数字的彩色圆圈显示。蓝色 (1) 信号为上涨开始, 而红色 (1) 信号为下跌开始。趋势变化并非评估当前价格动作的结果, 它意味着交易设置是不定时地。如果您正确使用本指标, 在趋势变化时, 您将将已经入场 (参看下面的调整)。 回调 但凡趋势在运动中,行情上下抖动,盈利者收割利润,且其它参与者入场。趋势回调代表好的买入机会,通常是由主力获利离场导致。如果行情在回调后回归上行, 指标将
Advanced Supply Demand
Bernhard Schweigert
4.91 (300)
现在优惠 40%! 任何新手或专业交易者的最佳解决方案! 该指标是一款独特、高质量、且价格合理的交易工具,因为我们已经整合了许多专有功能和新公式。 依据此更新,您将能够显示双重时间帧区域。 您不仅可以显示一个较高的时间帧,还可以同时显示图表时间帧,加上更高的时间帧:显示嵌套时区。 供需双方所有交易者都会喜欢它。 :) 重要信息披露 高级供需的最大潜力,请访问 https://www.mql5.com/zh/blogs/post/720245   想象您的交易如何得以改善,是因为您能够精准定位入场或目标位吗? 构建于新的底层算法,它可以更轻松地识别出买卖双方之间的潜在失衡。 这是因为它以图形方式展示供需最强劲区域,及其过去的表现(显示旧区域)。 这些功能旨在帮助您更轻松地发现最佳入场区域和价位。 现在您可以针对您的交易品种和时间帧来优化和编辑区域强度! 高级供需指标适用于所有产品和时间帧。 它是一个新的公式,非常新的功能是两个区域强度函数可由用户输入进行调整! 这在交易中是一大优势。 当您学习如何使用专有功能,例如带有价格游离最小 X 因子的区域强度时,您能够判断该区域强劲与否。 供需
IQ FX Gann Levels
INTRAQUOTES
5 (2)
IQ FX Gann Levels a precision trading indicator based on W.D. Gann’s square root methods . It plots real-time, non-repainting support and resistance levels to help traders confidently spot intraday and scalping opportunities with high accuracy. William Delbert Gann (W.D. Gann) was an exceptional market analyst, whose trading technique was based on a complex blend of mathematics, geometry, astrology, and ancient mathematics which proved to be extremely accurate. Setup & Guide:  Download  MT5 Ver
PZ Swing Trading
PZ TRADING SLU
5 (3)
Swing Trading 是第一个旨在检测趋势方向的波动和可能的反转波动的指标。它使用在交易文献中广泛描述的基准摆动交易方法。该指标研究多个价格和时间向量,以追踪总体趋势方向,并检测市场超卖或超买并准备好进行修正的情况。 [ 安装指南 | 更新指南 | 故障排除 | 常见问题 | 所有产品 ] 市场波动的利润不会被窃取 指示器始终显示趋势方向 彩色价格带代表机会基准 彩色虚线表示可能的反转波动 该指标分析其自身的质量和性能 它实现了一个多时间仪表板 可定制的趋势和波动周期 它实现了电子邮件/声音/推送警报 指示器为非重涂或重涂 什么是摇摆交易 摇摆交易是一种尝试在一天到一周内从证券中获得收益的交易方式,尽管某些交易最终可以保持更长的寿命。摇摆交易者使用技术分析来买入弱点和卖出力量,并有耐心等待这些机会的发生,因为在发生一波抛售浪潮之后购买证券而不是陷入抛售更有意义。 机会基准 关于历史数据的大量研究证明,适合于波动交易的市场倾向于在基线价格带上下交易,基线价格带由图表显示,使用平均真实区间计算得出。波动交易者使用基线,该策略是购买常态和卖出躁狂,或做空常态并掩盖沮丧。在没有疲
Dynamic Scalper System
Vitalyi Belyh
5 (1)
“ Dynamic Scalper System ”指标专为在趋势波内进行剥头皮交易而设计。 已在主要货币对和黄金上进行测试,并可与其他交易工具兼容。 提供顺势短线建仓信号,并提供额外的价格变动支持。 指标原理: 大箭头决定趋势方向。 在趋势波内,我们采用一种生成小箭头形式的剥头皮交易信号的算法。 红色箭头代表看涨方向,蓝色箭头代表看跌方向。 敏感的价格变动线会沿着趋势方向绘制,并与小箭头信号协同作用。 信号运作方式如下:当线在适当时刻出现时,将形成入场信号;在出现线时,持仓;线完成后,平仓。 建议的操作时间范围为M1 - H4。 箭头在当前K线上方形成,如果下一根K线已开仓,则不会重新绘制上一根K线上方的箭头。 输入参数 Trend Wave Period - 趋势方向(大箭头)的周期,改变趋势波的时间间隔。值 1 表示趋势方向的最长持续时间,参数值越大,持续时间越短。 Scalper Arrows Period - 信号箭头(小箭头)的计算周期,改变入场信号的生成频率。值 3 表示最频繁的生成频率,参数值越大,箭头频率越低,准确度越高。 这些参数可以根据不同的时间范
M30/H1/H4 波段版已上线 想抓住M5/M15无法捕捉的大行情? Gold Signal Swing Pro(M30/H1/H4)现已发售。 目标每笔$20-$80+。 https://www.mql5.com/en/market/product/177643 KURAMA GOLD SIGNAL PRO(MT4版)— 7层过滤器、自动TP/SL、品质评分搭载 XAUUSD完整交易系统 不重绘。不重画。不延迟。每个信号永久固定。所见即所得。 福利:购买买断版许可证可免费获得 AI Zone Radar(价值$59)+ 完整PDF手册。购买后请给我发消息。 AI Zone Radar: https://www.mql5.com/en/market/product/175834 交易员的信赖:已被活跃的黄金交易员社区使用。因精度和易用性获得赞誉。 你的问题 — 以及解决方案 你知道黄金每天波动$30-50。你知道这里有钱可赚。但是: - 入场过早,价格反向$10后才朝你的方向走 -
PZ 123 Pattern
PZ TRADING SLU
1 (1)
123模式 是最受欢迎,功能强大和灵活的图表模式之一。该模式由三个价格点组成:底部,峰值或谷值以及38.2%至71.8%之间的斐波纳契回撤位。当价格突破最后一个峰值或谷值时,该形态被认为是有效的,此时指标绘制箭头,发出警报并可以进行交易。 [ 安装指南 | 更新指南 | 故障排除 | 常见问题 | 所有产品 ] 清除交易信号 可自定义的颜色和尺寸 实施绩效统计 可定制的斐波那契回撤水平 显示适当的止损和获利水平 该指标可用于查找连续或反转形态 它是不可重涂和不可重涂的 它实现了电子邮件/声音/视觉警报 123模式 可以表现为连续或反转模式。为了简化操作,该指标使您可以选择要寻找哪种类型的形态,使其成为趋势或反转交易者的绝佳工具。 设置 将指标加载到任何图表时,将显示一组选项作为输入参数。如果您认为它们太多,请不要感到失望,因为参数被分组为不言自明的块。这就是每个参数块的作用。 幅度-幅度表示替代价格点之间的最小柱线量。要找到大图案,请增加幅度参数。要查找较小的模式,请减小幅度参数。 闵。回撤-形态中所需的最小斐波那契回撤。设置为零不对其进行评估。 最大。回撤-形态中可能的最大斐
MonsterDash Harmonic Indicator
Paul Geirnaerdt
4.54 (26)
MonsterDash Harmonic Indicator is a harmonic pattern dashboard. It recognizes all major patterns. MonsterDash is a dashboard that displays all detected patterns for all symbols and (almost) all timeframes in sortable and scrollable format. Users can add their own user defined patterns . MonsterDash can open and update charts with the pattern found. Settings MonsterDash's default settings are good enough most of the time. Feel free to fine tune them to your needs. The color settings are for thos
Apollo SR Master
Oleg Rodin
5 (2)
Apollo SR Master 是一款支撑/阻力指标,其特殊功能使利用支撑/阻力区域进行交易更加便捷可靠。该指标通过检测局部价格顶部和底部,实时计算支撑/阻力区域,没有任何时间延迟。为了确认新形成的支撑/阻力区域,该指标会显示特殊信号,表明该支撑/阻力区域可以作为实际的卖出或买入信号。在这种情况下,支撑/阻力区域的强度会增强,因此从该区域进行交易的成功率也会更高。这正是该指标的核心理念。 SR区域也使止损和止盈的操作更加便捷。根据信号方向,可以将SR区域上方或下方的空间用作止损位。此外,相对的SR区域也可以用作潜在的止盈区域。 我还免费向所有 Apollo SR Master 指标的用户提供我的“Apollo 价格行为系统”指标。这两个指标结合使用将帮助您找到更好的入场点。 购买后请联系我,即可免费获得我的交易技巧以及我的“阿波罗价格行为系统”指标作为赠品!
地震仪 市场地震探测器。 Description in English : https://www.mql5.com/en/market/product/113869?source=Site+Market+Product+Page#description How to use the Seismograph : https://www.mql5.com/en/market/product/113869#!tab=comments&page=2&comment=52806941 Create an EA : https://www.mql5.com/en/market/product/113869#!tab=comments&page=3&comment=52816509 无论您以何种方式交易,您都绝对希望避免进入低流动性市场。 然而,即使你确保在应该繁忙的市场时间进入,事实是许多人经常被困在流动性低的市场中。 经过几个小时的等待,市场突然变得繁忙起来,但是......事实证明,现在很多人都站在了与市场相反的方向上。 如果人们不得不等待浮动负数需要很长时间,甚至人们不得不止
Advanced Currency Strength28 Indicator
Bernhard Schweigert
4.91 (657)
目前40%的折扣 任何新手或专家交易者的最佳解决方案! 这个指标是一个独特的、高质量的、可负担得起的交易工具,因为我们纳入了一些专有的功能和一个新的公式。只需一个图表,你就可以读出28个外汇对的货币强度!想象一下,你的交易将如何得到改善,因为你的交易是在你的手中进行的。想象一下,你的交易将如何改善,因为你能够准确地确定新趋势或剥头皮机会的触发点? 用户手册:点击这里  https://www.mql5.com/en/blogs/post/697384 这是第一本,原版的! 不要买一个毫无价值的崇拜者的克隆品。 特别的 子窗口中的箭头显示强劲的货币势头GAP将指导你的交易! 当基础货币或报价货币处于超卖/超买区域(外盘斐波那契水平)时,在个人图表的主窗口中出现警告信号。 当货币力量从外围区间回落时,回撤/反转警报。 十字星模式的特别警报 可选择多个时间框架,以快速查看趋势! 货币强度线在所有的时间框架中都非常平稳,当使用较高的时间框架来识别总体趋势,然后使用较短的时间框架来确定精确的入口时,效果非常好。你可以根据自己的意愿选择任何时间框架。每个时间框架都由其自身进行了优化。
Introduction to Fractal Pattern Scanner Fractal Indicator refers to the technical indicator that makes use of the fractal geometry found in the financial market. Fractal Pattern Scanner is the advanced Fractal Indicator that brings the latest trading technology after the extensive research and development work in the fractal geometry in the financial market. The most important feature in Fractal Pattern Scanner is the ability to measure the turning point probability as well as the trend probabi
Auto Optimized Parabolic RSI: 高级 3D 动量引擎 大多数零售指标之所以失效,是因为它们依赖于静态输入,一旦市场波动率发生变化,这些输入就会崩溃。Auto Optimized Parabolic RSI 通过不断重新计算自身的数学优势,解决了“指标衰退”的问题,将机构级别的量化自适应能力直接引入您的 MT5 终端。 核心优势:定制的内存 3D 优化   标准的自动优化器通常会导致 MT5 平台卡顿,因为它们通过标准的指标调用使终端超载。该工具完全绕过了这些性能瓶颈。内部引擎采用定制的原生基于 RAM 的计算器构建,每次加载图表或更改时间周期时,它都会执行极速的 3D 网格搜索。它同时扫描 RSI 周期(频率)、SAR 步长(加速度)和 SAR 最大值(速度限制),在绝对的毫秒级时间内测试数以万计的参数组合,且完全不会拖慢您的平台。它不是仅仅寻找一个“不错”的设置,而是映射整个参数空间,以寻找资产当前动量结构的绝对全局最大值。 严格的财务评分与逼真的交易模拟   与基于抽象“指标点数”进行优化评分的业余工具不同,该引擎的 3.10 版本严格与资金数学挂钩。每
Trend Lines PRO
Roman Podpora
5 (1)
TREND LINES PRO 帮助您了解市场真正的方向转变点。该指标显示真实的趋势反转点以及主要参与者重新入场的时机。 您可以看到 BOS线、 趋势变化和更高时间框架的关键水平——无需复杂的设置或不必要的干扰。信号不会重绘,并在K线收盘后仍然保留在图表上。 VERSION MT 5    -   与……搭配使用时,可发挥其最大潜力   RFI LEVELS PRO 指示器 该指标显示的内容: 实际变化 趋势(BOS 线) 一旦信号出现,它就始终有效!这与会重绘的指标有着重要的区别,后者可能会发出信号后又改变信号,从而导致资金损失。现在,您可以更精准、更准确地进入市场。此外,还有一个功能,会在箭头出现后为K线着色,直到达到目标价位(止盈)或出现反转信号为止。 重复条目   以及主要玩家的充值 为了提高寻找入场点时的视觉清晰度,我们创建了一个模块,该模块首先显示买入/卖出区域,并在该区域内寻找最佳入场点。此外,我们还加入了智能逻辑来管理止损位,该逻辑会随着时间的推移逐步降低止损位的大小,从而降低入场交易时的初始风险(移动止损位)。 信号强度水平(BOS) 该指标采用三个显著性等级来衡量
The Propfolio Master Suite is the ultimate all-in-one analytical workstation for professional traders. Combining the power of the Beat The Market Maker (BTMM) methodology, Smart Money Concepts (SND/Liquidity), and Advanced Volume Profile, this suite replaces multiple different indicators with one optimized engine. Monitor up to 14 pairs simultaneously from a single chart, instantly identify market cycles, and seamlessly map institutional footprints with the click of a button. The Command Center
RFI levels PRO
Roman Podpora
5 (1)
该指标能够准确显示反转点和价格回落区域。     行业领军人物 。您能洞察新趋势的形成,并以最高的精准度做出决策,掌控每一笔交易。 与……结合时,展现其最大潜力     趋势线专业版   指标  VERSION MT5 该指标显示的内容: 新趋势开始时的反转结构和反转水平及其激活。 显示屏   获利了结   和   止损   风险回报比最低的水平     RR 1:2       。 具有智能减值逻辑的止损。 显示指定指标中两种趋势类型的反转形态。 指标: 根据     趋势线     (全球趋势变化) 潮流专业版     (趋势快速变化) 简单有效   扫描器   实时趋势(新增)。 多时间框架工具筛选。 展示   利润   在 LOGIC AI 信号之后。 以下列出今日走势积极的金融工具。(RB键) 能够为终端启用通知(警报)功能,并向移动设备推送通知。 逻辑人工智能     — 利用人工智能寻找最佳切入点。 只有在启用 MTF(多时间框架分析)模式时,该功能才可用。 兼容性。 当与趋势线指标结合使用时,该指标能发挥其最大潜力。 这     RFI LEVELS PRO    
Gold Venamax MT4
Sergei Linskii
3 (2)
Gold Venamax   - 這是最好的股票技術指標。 此指標演算法分析資產的價格變動並反映波動性和潛在的進入區域。 指標特點: 這是一個帶有 Magic 和兩個趨勢箭頭塊的超級指標,可實現舒適且有利可圖的交易。 圖表上顯示用於切換方塊的紅色按鈕。 Magic 在指標設定中進行設置,以便您可以將指標安裝在顯示不同區塊的兩個圖表上。 Gold Venamax 可以放置在具有不同箭頭緩衝區(GV 和 SD)的兩個圖表上。 為此,您需要在設定中選擇不同的 Magic,例如,一個具有 Magic = 999,另一個具有 Magic = 666。接下來,您可以使用圖表上的紅色按鈕選擇箭頭緩衝區。 指標設定中的每個箭頭緩衝區(GV и SD)都有一個單獨的箭頭過濾器,以實現舒適且有利可圖的交易(UseFiltrGV = true; 和 UseFiltrSD = true;)。 進入的最佳訊號 = 遵循兩個緩衝區的訊號箭頭(GV 和 SD)+ 所有三個 MA 線(紅色或藍色)的方向 + TMA 通道邊界(下或上) 。 TMA 通道邊界(下限或上限)也可用於鎖定利潤和/或以較短的停損位進行逆
作者的更多信息
EMA Cross Alert
Suriya Thammalungka
EMA Cross Alert is a signal indicator based on exponential moving average crossover. It will alert signal with audio or pop up on chart when 2 periods EMA cross above/below for Buy/Sell. It easy use. Help to your system trading. You can customize period of EMA for crossing alert signal, if you want. And You can ON/OFF audio alert. Indicator can use every currency pairs and every broker. Features Period1: Short moving averages Period2: Long moving averages Audible_Alerts : ON/OFF audio alert on
Smooth MA Trend Cross Alert is indicator signal strategy trading by Smoothed Moving Average (SMMA) crossover. It'll alert signal with an audio or pop up on the chart when 2 periods SMMA cross above/below for Buy/Sell. It easy use. Filter sideways by SMMA's smoothed trend. Helpful for your system trading. You can customize period of SMMA for crossing alert signal. You can ON/OFF audio alert signal on the chart, Notifications alert on mobile, Email message alert when Buy/Sell SMMA cross alert sign
Volume Confirm Trend Zone is the indicator for filtering sideways and confirm trend to help your system trading. Indicator can use every currency pairs, every time frame, and every broker. You can see trend zone when color to change in volume indicator. Features When the color changes to the blue: Buy Zone is a strong trend. When the color changes to the red: Sell Zone is a strong trend.
TrendXHunter
Suriya Thammalungka
Trend Hunter is the indicator for filtering sideway and confirm trend to help your system trading. Indicator can use every currency pairs, every timeframe, and every broker. You can see trend and side way when color to change in candlestick. Features Candlestick when the color changes to green: Uptrend. Candlestick when the color changes to red: Downtrend. Candlestick when the color changes to Yellow: Sideway.
3xEMA Golden Cross Alert is indicator signal strategy trading by 3 Exponential Moving Average (EMA). It'll alert signal on next bar open with an audio or pop up on the chart when EMA signal cross above/below 3 periods EMA for Buy/Sell and Exit alert signal. BUY/SELL: When Short term's EMA > Medium term's EMA > Long term's EMA = Buy Signal When Short term's EMA < Medium term's EMA < Long term's EMA = Buy Signal Exit: When Short term's EMA < Medium term's EMA > Long term's EMA = Exit Signal for Bu
Gold Digger Martingale Robot is a fully automated scalping Expert Advisor based on Heiken Ashi, Moving Average and Ichimoku Kinko Hyo. Each entry point is calculated using an advanced entry filter based on Price Action by following the trend. Advantages Money management system. Indicators are Heiken Ashi, Moving Average and Ichimoku Kinko Hyo for filter sideway and scalping by following the trend. Easy to set up. Requirements Symbols: XAUUSD H4. Minimum deposit: $500. Leverage: 1:400-1:500. An
A trend indicator based on the Ichimoku Kinko Hyo and MACD. The ICloud Scalper Trend Indy is an improved variant of the Ichimoku Kinko Hyo and MACD, which shows the moment of trend following quite accurately. It is often used as a signal filter. Combination of two indicators makes a better use of these advantages: Ichimoku Kinko Hyo identifies the trend, while MACD determines the short-term movements and signals in the trend direction. Messages/Sounds (Notifications and sound settings) ON/OFF -
Scanner Trend Indy
Suriya Thammalungka
A trend indicator based on the Ichimoku Kinko Hyo and Candlestick. The Scanner Trend Indy is an improved variant of the Ichimoku Kinko Hyo and Candlestick, which shows the moment of trend following quite accurately. It is often used as a signal filter. Combination of two indicators makes a better use of these advantages: Ichimoku Kinko Hyo identifies the trend, while Candlestick determines the short-term movements and signals in the trend direction. Messages/sounds (notifications and sound sett
A trend reversal indicator based on the Candlestick Pattern. A candlestick pattern is a movement in prices shown graphically on a candlestick chart that trader can predict a particular market movement. Engulfing Pattern: A reversal pattern that can be bearish or bullish, depending upon whether it appears at the end of an uptrend (bearish engulfing pattern) or a downtrend (bullish engulfing pattern). The Engulfing Of Sparta indicator is an improved variant of the Candlestick Pattern, which shows
A trend indicator based on the CCI indicator. ZI Trend PaintBar Indicator is an improved variant of the CCI indicator, which shows the moment of trend following quite accurately. Combination of CCI indicator makes a better use of these advantages: Colored candlesticks showing the trend direction based on CCI indicator. Messages/Sounds (Notifications and sound settings) Mail - enable/disable sending emails. Alerts - enable/disable messages in the terminal when signals occur. Push - enable/disable
Over BS RSI Zone Alarm
Suriya Thammalungka
Over BS RSI Zone Alarm is an oscillator indicator which based on RSI oversold/overbought indicator. It'll alert signal on next bar open with an audio or pop up on the chart When RSI above 70 that the signal oversold alert. And RSI below 30 that the signal overbought alert. The indicator can customize Level of Relative Strength Index. Messages/Sounds (Notifications and sound settings) RSI_Period - Period of Relative Strength Index. Level_Overbought_Zone - Level of Relative Strength Index for Ove
Trend Follow Me Moving
Suriya Thammalungka
Trend Follow Me Moving Trend Follow Me Moving is a trend indicator which based on Moving average indicator. It'll alert signal on next bar open with an audio or pop up on the chart when SMA cross above SMMA high average price that the signal "Buy" alert and SMA cross below SMMA low average price that the signal "Sell" alert.   Messages/Sounds (Notifications and sound settings) Send_EMail - enable/disable sending emails. Audible_Alerts - enable/disable messages in the terminal when signals o
SMA Cross Envelopes Alert
Suriya Thammalungka
5 (1)
SMA Cross Envelopes Alert is a trend indicator based on the Moving average and Envelopes indicator. It'll alert signal on next bar open with the audio or pop up on the chart when SMA crosses above the Envelopes upper line that the signal "Buy" alert and SMA crosses below the Envelopes lower line that the signal "Sell" alert. Settings SMA: Simple moving average setting period Envelopes: Envelopes setting period Deviation: Envelopes setting deviation (%) Send_EMail: enable/disable sending
Slope Trend Robot v1
Suriya Thammalungka
Slope Trend Robot  is the Expert Advisors trading with a combination of multiple strategy trading algorithms (Trend, Level Trading, and Money Management with Martingale recovery loss to profitable).  The Trading algorithms. 1. Follow trends with Indicators is Moving average and Envelopes. 2. Open order two ways that trading both BUY and SELL. 3. Open orders with distance. 4. Close order follow indicator's signal with a profit.  How to work? Open BUY When Moving Average Cross Above Envelopes L
DMZ X Zone Robot
Suriya Thammalungka
DMZ X Zone Robot  is the Expert Advisors trading with a combination of multiple strategy trading algorithms (Trend, Hedging, and Money Management with Martingale Zone recovery).  The Trading algorithms. 1. Follow trends with Indicators is Moving average and Envelopes. 2. Open order two ways that trading both BUY and SELL. 3. Open STOP orders for hedging with zone recovery distance. 4. Close orders and exit with a profit.  How to work? Open BUY When Moving Average is Above Envelopes Line Upper.
CCI Robot
Suriya Thammalungka
CCI Robot is a trading robot that mainly uses the CCI indicator to trade signals, including Money   management and placing orders with Oversold, Overbought, Level Trading, and Grid distance. And can trade with Money Management with Martingale recovery loss to profitable or Fix each lot size depending on each trading style. for flexibility in Money   management. The Trading algorithms. 1. Trade according to CCI signal. 2. Open order two ways that trading both BUY and SELL. 3. Open orders with d
OB Scanner
Suriya Thammalungka
OB Scanner Indicator — Overview OB Scanner is an enhanced Support & Resistance + Supply & Demand indicator designed to help traders identify where institutions and smart money are placing orders. It scans the chart for: 1. Order Blocks (Improved Demand & Supply Zones) Automatically detects Bullish Order Blocks (Demand) Automatically detects Bearish Order Blocks (Supply) Marks high-probability reversal zones Filters out weak OBs with volume and break-of-structure (BOS) confirmation 2. Buyer
Candle x Env TPSL
Suriya Thammalungka
EA Description (English) Candle XENV TPSL Marti is an automated trading system designed to trade based on candle-structure breakouts combined with trend-filter logic. The EA intelligently manages position sizing using dynamic lot sizing, martingale recovery, and adaptive risk control. It is optimized for medium-term swing trading on H1 timeframes across major currency pairs. The algorithm is built to avoid over-trading, reduce drawdown risk, and self-adjust to market volatility. With improved
Engulfing Scalping EA
Suriya Thammalungka
Engulfing Scalping EA is a fully automated Expert Advisor designed for traders who appreciate the reliability of Price Action combined with a robust recovery mechanism. This EA operates based on the classic Engulfing Candle Pattern , one of the most powerful reversal and continuation signals in technical analysis. It does not rely on lagging indicators; instead, it reads raw market sentiment directly from the charts. How It Works The logic is divided into two intelligent phases: 1. Continuous En
Smart FIFO Grid Pro MT4
Suriya Thammalungka
Smart FIFO Grid Pro: Fuel Sentinel Edition Headline: The Intelligent Grid System with "Profit Recycling" Technology. Now features customizable 'Fuel Days' and real-time Margin Health Monitoring. ️ Overview Smart FIFO Grid Pro is a next-generation trading system designed for traders who prioritize Account Preservation over reckless gambling. Unlike traditional martingale grids that simply hope for a reversal, this EA actively manages risk by "recycling" your secured profits to reduce drawdown.
Auto Trendline Fibo Dow Theory - Automated Price Action & Structure Analysis Overview: Stop drawing manual trendlines and Fibonacci retracements! Auto Trendline Fibo Dow Theory  is a powerful price action utility designed to automate your technical analysis based on the classic Dow Theory and Fibonacci ratios. This indicator scans market structure using a customizable ZigZag algorithm to identify higher highs, higher lows (Uptrend), or lower highs, lower lows (Downtrend). It automatically plots
MACD Hist Breakout Indy
Suriya Thammalungka
Introduction Stop trading lagging zero-line crosses and start trading pure momentum. The MACD 1-2-3 Momentum Breakout PRO is an advanced algorithm designed exclusively for MetaTrader 5. It tracks the internal "breathing cycle" of the market to identify high-probability momentum shifts using a strict, multi-step algorithmic cycle. Now updated to Version 1.03 , this indicator features a complete multi-channel alert system and introduces Dynamic Visual Breakout Levels —giving you absolute clarity o
筛选:
无评论
回复评论