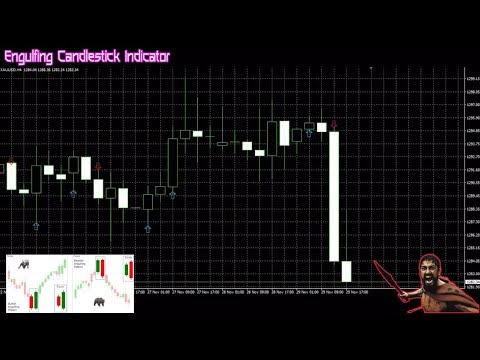
Engulfing Of Sparta Indicator
- 指标
-
Suriya Thammalungka
 I am developer System Trading and EA Programming from Thailand
 - 版本: 1.0
- 激活: 5
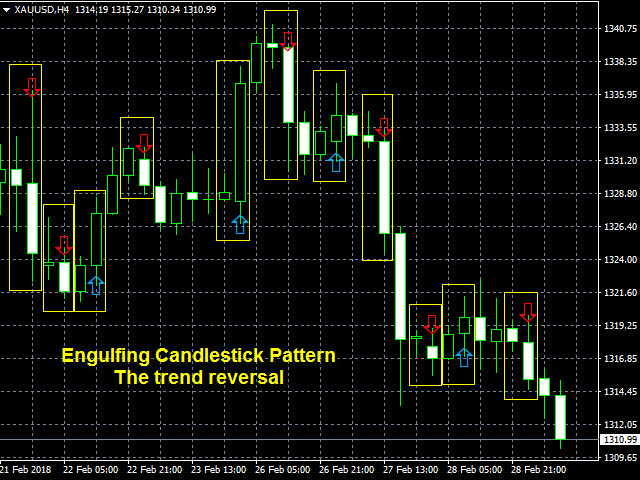
A trend reversal indicator based on the Candlestick Pattern.
A candlestick pattern is a movement in prices shown graphically on a candlestick chart that trader can predict a particular market movement.
Engulfing Pattern:
A reversal pattern that can be bearish or bullish, depending upon whether it appears at the end of an uptrend (bearish engulfing pattern) or a downtrend (bullish engulfing pattern).
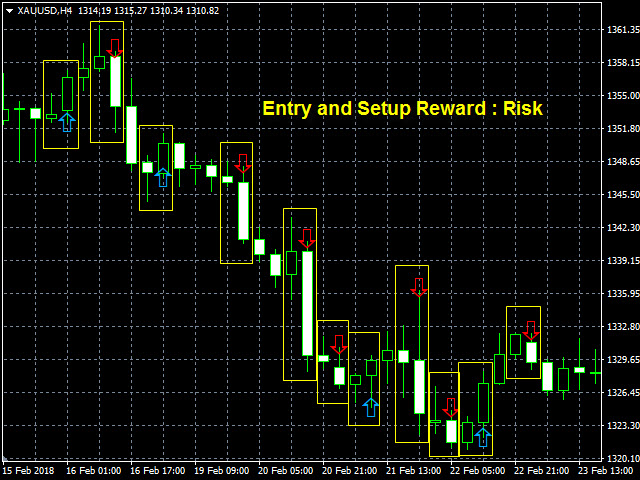
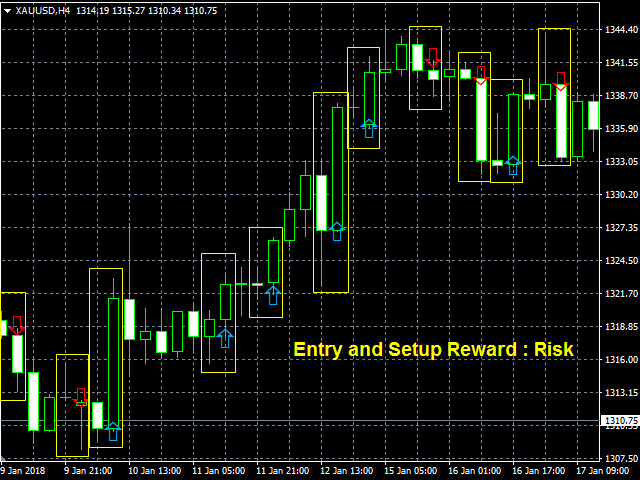
The Engulfing Of Sparta indicator is an improved variant of the Candlestick Pattern, which shows the moment of trend reversal quite accurately.
Combination of two Candlesticks makes a better use of these advantages: Engulfing Candlestick Pattern identifies the trend reversal.
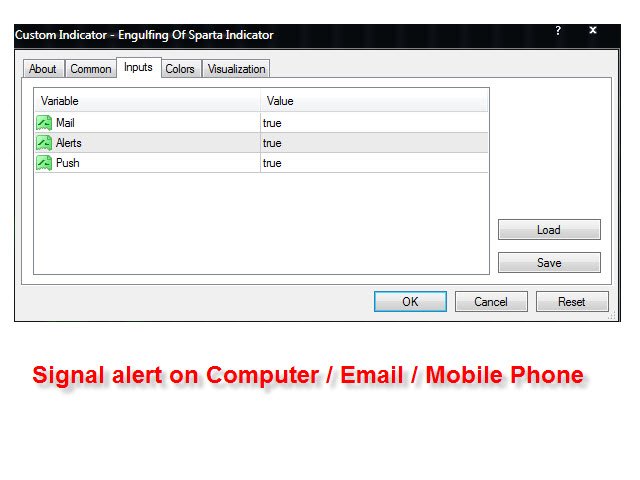
Messages/Sounds (Notifications and sound settings)
- Mail - enable/disable sending emails.
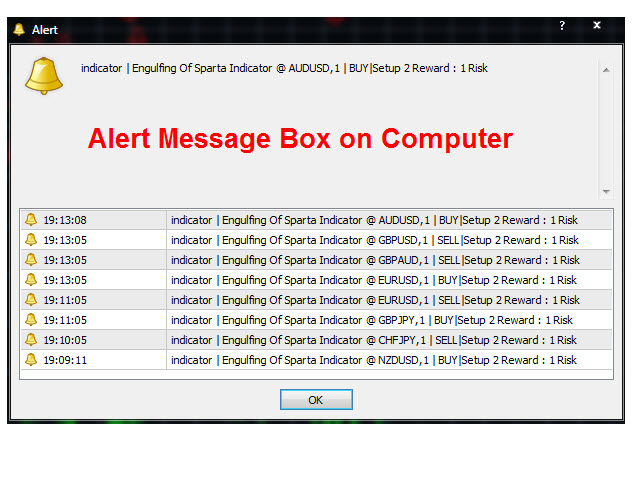
- Alerts - enable/disable messages in the terminal when signals occur.
- Push - enable/disable sending push notifications to mobile devices.