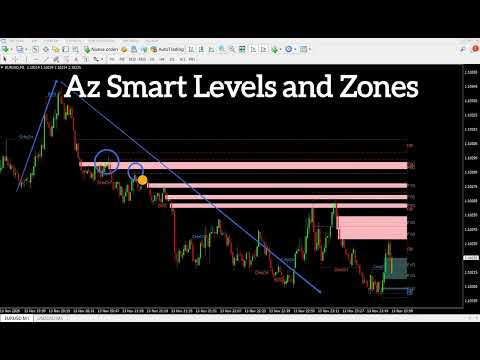
AZ Smart Levels and Zones
- 指标
-
Jose Antonio Valle Magana
 The profession of trader is something I love because once you learn a system, you do not need to be learning and learning new things, but all you have to do is apply the knowledge day by day with more and more discipline. I am an architect by profession and a trader at heart.
- 版本: 1.9
- 激活: 10
AZ Smart Levels and Zones 在 MetaTrader 4 图表上直接绘制三种基础 SMC(市场结构)工具:结构突破、公允价值缺口(Fair Value Gap)和订单块(Order Block)。
绘制内容
市场结构(BOS / CHoCH)
• 基于已收盘 K 线识别摆动高点和低点(摆动长度可调)。
• 结构突破(BOS):一根 K 线收盘于最近的摆动点之外,且方向与当前趋势一致。以实线绘制。
• 性质转变(CHoCH):一根 K 线收盘于最近的摆动点之外,且方向与当前趋势相反。以点线绘制。
• 每条线都带有标签,并按方向着色。显示最近的若干次突破。
公允价值缺口(FVG)
• 识别看涨和看跌的三根 K 线缺口。
• 每个缺口绘制为向右延伸的填充方框,在其区间 50% 处有一条点线,并带有“FVG”标签。
• 只要没有 K 线收盘穿过缺口,它就会一直显示。穿过区间的影线不会使其消失。
订单块(OB)
• 看涨 OB:一根强势阳线(收盘高于其最高价)之前的最后一根阴线。看跌 OB:相反的情况。
• 以向右延伸的虚线方框绘制,颜色与结构线相同,并带有“OB”标签。
• 只要没有 K 线收盘穿过订单块,它就会一直显示。
工作原理
每当出现新 K 线时重新计算,仅使用已收盘的 K 线。所有绘制内容都是图表对象,因此可以像其他对象一样隐藏、移动或删除。
重要说明
• 本指标仅为图表显示工具,不生成交易信号或提醒,也不保证任何结果。
• 结构、缺口和订单块涉及主观解读;图表上显示的内容取决于您选择的参数。
• 交易存在风险。本说明不构成财务建议。
输入参数
市场结构
• Show market structure – 开/关。
• Swing length (bars on each side, 1-20) – 默认 5。
• Bars of history to analyze – 默认 500。
• Maximum structure breaks to display – 默认 10。
• Bullish break color / Bearish break color。
公允价值缺口
• Show fair value gaps (FVG) – 开/关。
• Bars of history to analyze – 默认 300。
• Maximum zones to display – 默认 10。
• Minimum gap size in points (0 = any)。
• Bullish FVG color / Bearish FVG color / FVG 50% line and label color。
订单块
• Show order blocks (OB) – 开/关。
• Bars of history to analyze – 默认 300。
• Maximum zones to display – 默认 8。
• Impulse candle: minimum body as % of its range – 默认 60。
• Use only the candle body (not the wicks) – 默认 false。
区域布局
• Extend zones to the right (bars); labels sit right after the zone – 默认 10。建议开启图表偏移,为标签留出空间。
• Label font size – 默认 8。
开发者:Jose Antonio Valle Magana (valletrading) – AZ Trading Tools。