Murrey Math Multi Timeframe Indicator Support/Resistance
Murrey Math Lines are strong tools to plot the support and resistance levels.
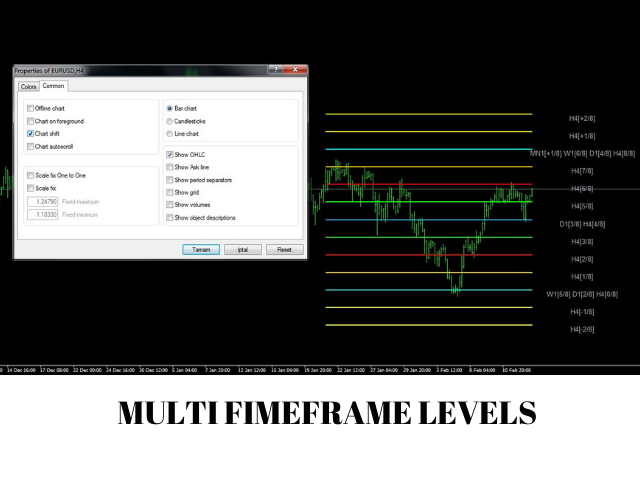
Murrey Math Multi Timeframe Indicator draws multi timeframe MM lines on a smaller tf chart.
General Information:
According to Gann, prices move in 1/8's, these 1/8's act as points of price support and
resistance as an entity's price changes in time. Given this 1/8 characteristic of price action,
Murrey assigns properties to each of the MML's in an a given octave. These properties are listed
here for convenience.
8/8 th's and 0/8 th's Lines (Ultimate Resistance)
These lines are the hardest to penetrate on the way up, and give the greatest support on the way
down. (Prices may never make it thru these lines).
7/8 th's Line (Weak, Stall and Reverse)
This line is weak. If prices run up too far too fast, and if they stall at this line they will reverse
down fast. If prices do not stall at this line they will move up to the 8/8 th's line.
6/8 th's and 2/8 th's Lines (Pivot, Reverse)
These two lines are second only to the 4/8 th's line in their ability to force prices to reverse. This
is true whether prices are moving up or down.
5/8 th's Line (Top of Trading Range)
The prices of all entities will spend 40% of the time moving between the 5/8 th's and 3/8 th's
lines. If prices move above the 5/8 th's line and stay above it for 10 to 12 days, the entity is said
to be selling at a premium to what one wants to pay for it and prices will tend to stay above this
line in the "premium area". If, however, prices fall below the 5/8 th's line then they will tend to
fall further looking for support at a lower level.
4/8 th's Line (Major Support/Resistance)
This line provides the greatest amount of support and resistance. This line has the greatest
support when prices are above it and the greatest resistance when prices are below it. This price
level is the best level to sell and buy against.
3/8 th's Line (Bottom of Trading Range)
If prices are below this line and moving upwards, this line is difficult to penetrate. If prices
penetrate above this line and stay above this line for 10 to 12 days then prices will stay above
this line and spend 40% of the time moving between this line and the 5/8 th's line.
1/8 th Line (Weak, Stall and Reverse)
This line is weak. If prices run down too far too fast, and if they stall at this line they will reverse
up fast. If prices do not stall at this line they will move down to the 0/8 th's line.
Advantages:
You can see bigger periods MM Levels on the smaler chart timeframes by using the MM Multi Timeframe Indicator
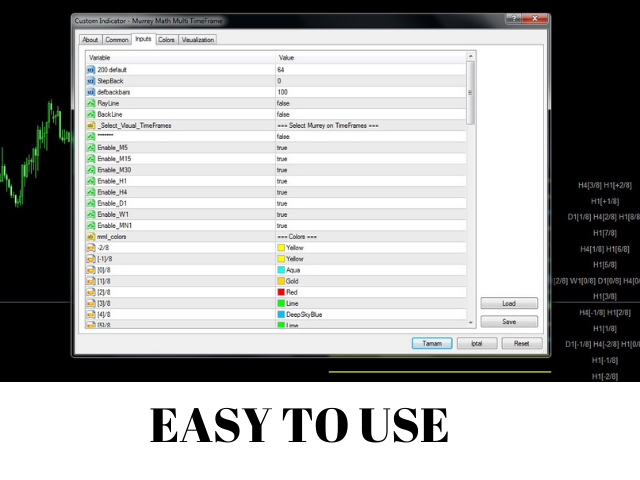
Show/Hide Button Helper
Set your own description for the lines
Choose the levels you like to see on the chart
Since the indicator is very easy to use, we have recorded a short video to explain the settings.
If you have further questions please do not hesitate to contact us.
 Eliminate guesswork and build a sustainable, rule-based edge in global financial markets through mathematical, systemic, and algorithmic approaches.
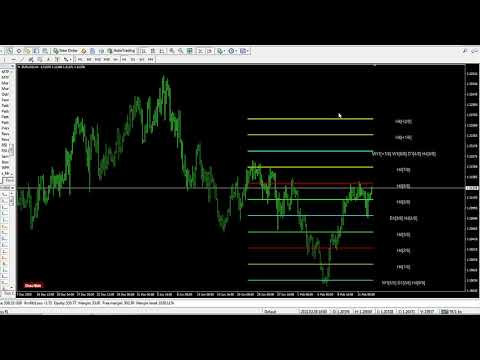
用户没有留下任何评级信息