Smart Renko Chart

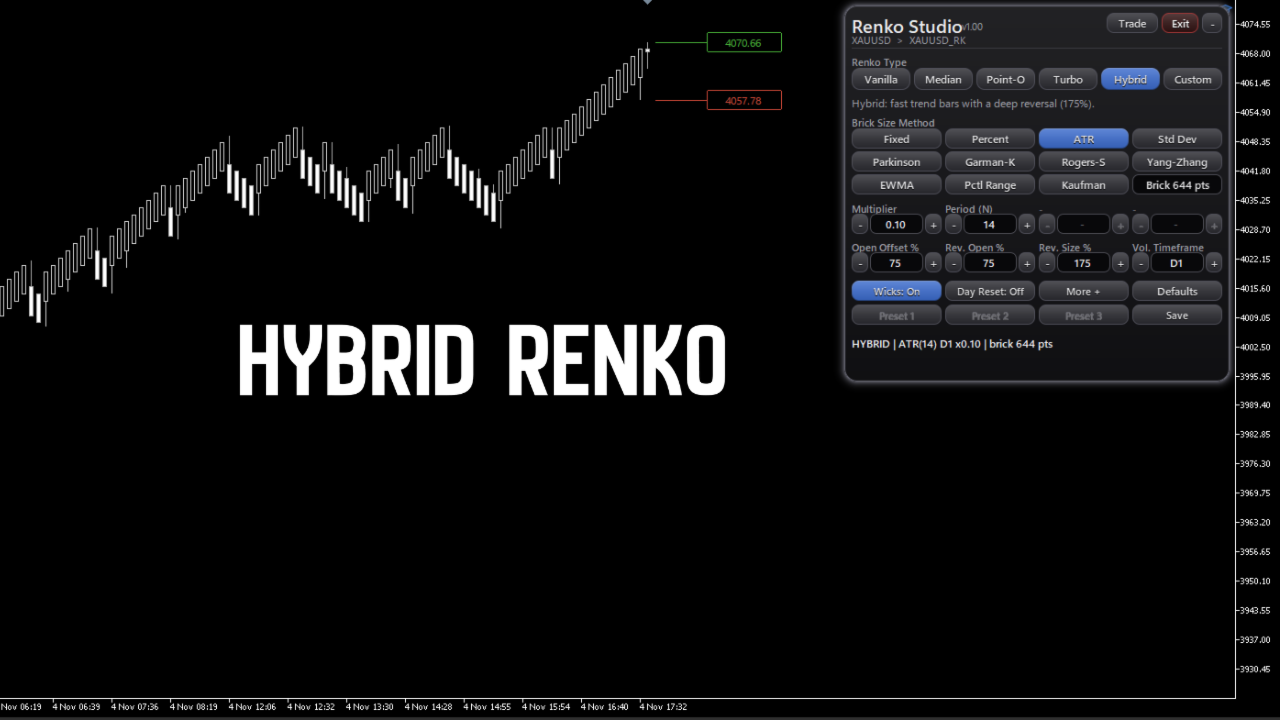
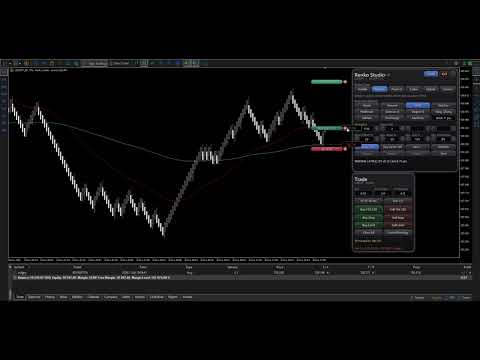
This Expert Advisor creates a custom symbol (for example EURUSD_RK) from the symbol of the chart and converts the same chart to Renko. The chart keeps updating tick by tick. A control panel on the chart lets you change the Renko type and the way the brick size is calculated without restarting.

Markets
It works on any symbol that your broker offers in the terminal: forex pairs, stocks, indices, metals, energies, cryptocurrencies and synthetic indices. The brick size can be set in points, as a percent of the price or from volatility, so the same panel is used for symbols with different prices and number of decimals. For symbols that report a last price, such as stocks, you can choose Last as the price source. Real volume is used when the broker provides it.

How to use it

  1. Attach the Expert Advisor to a chart of any symbol.
  2. Press START RENKO. The chart is converted to Renko.
  3. Change the type, method and parameters from the panel. The chart rebuilds automatically.
  4. Press EXIT to return to the real symbol and the previous timeframe.

Renko types
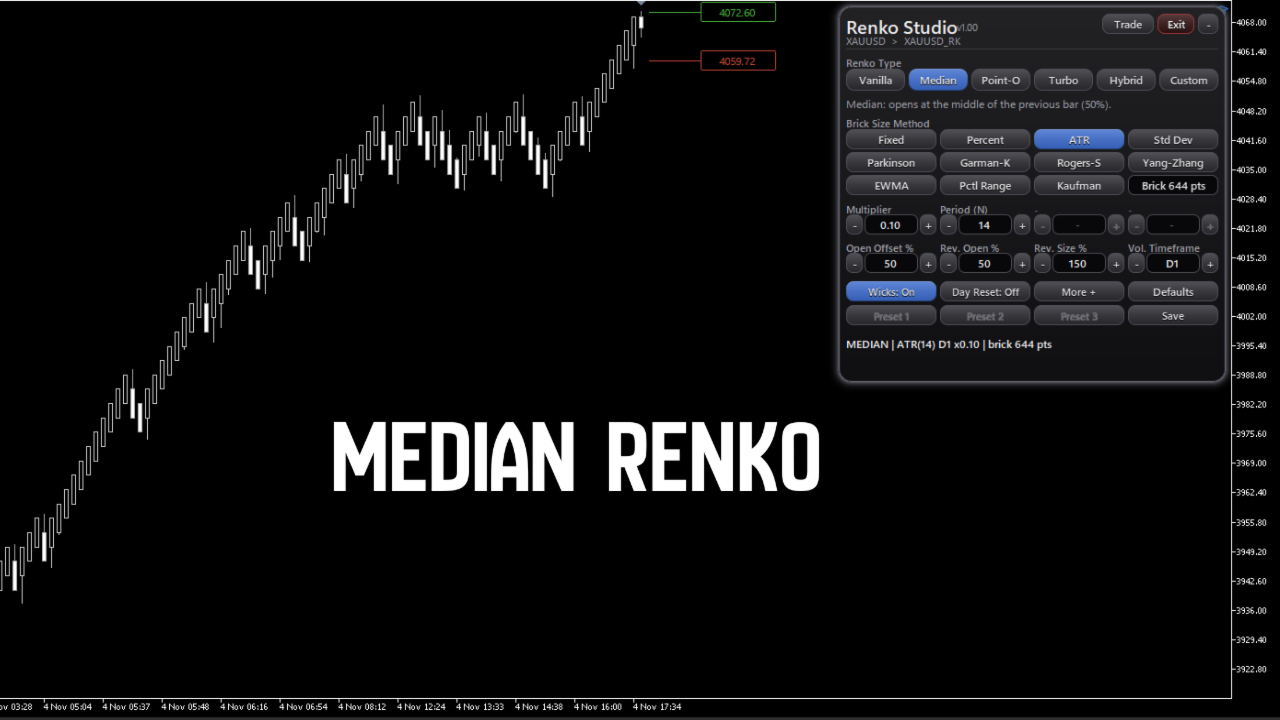
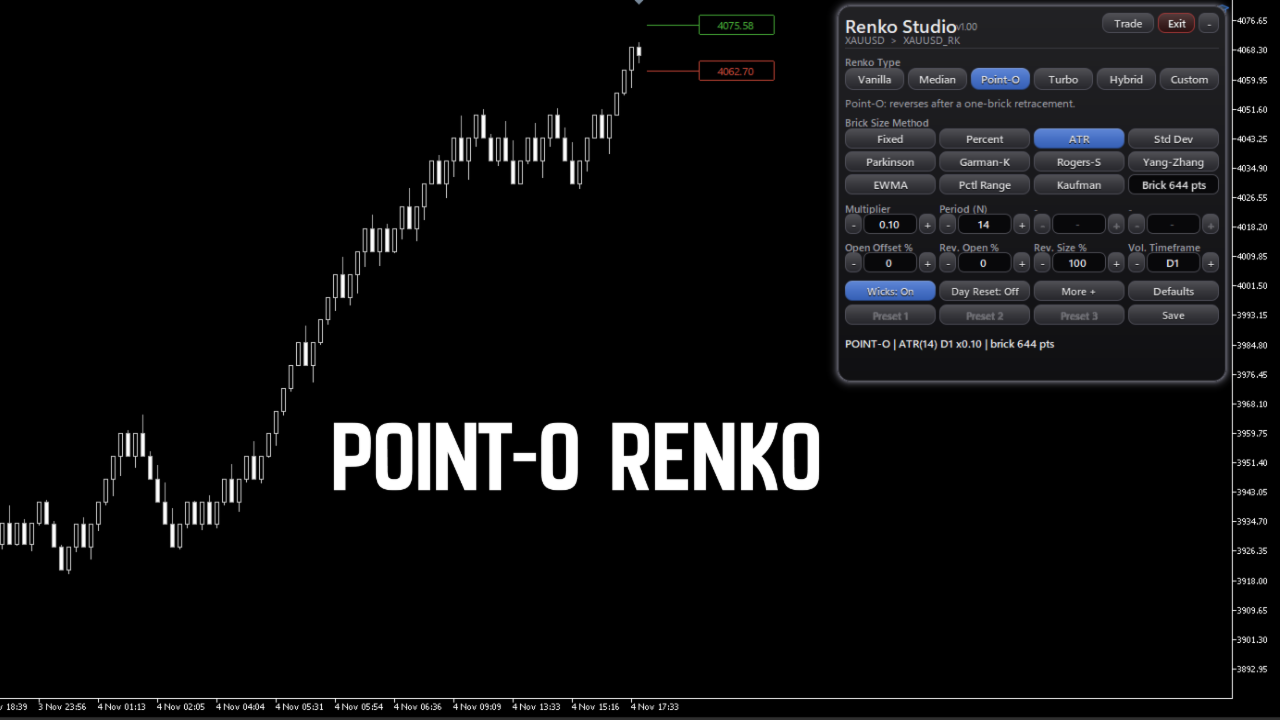
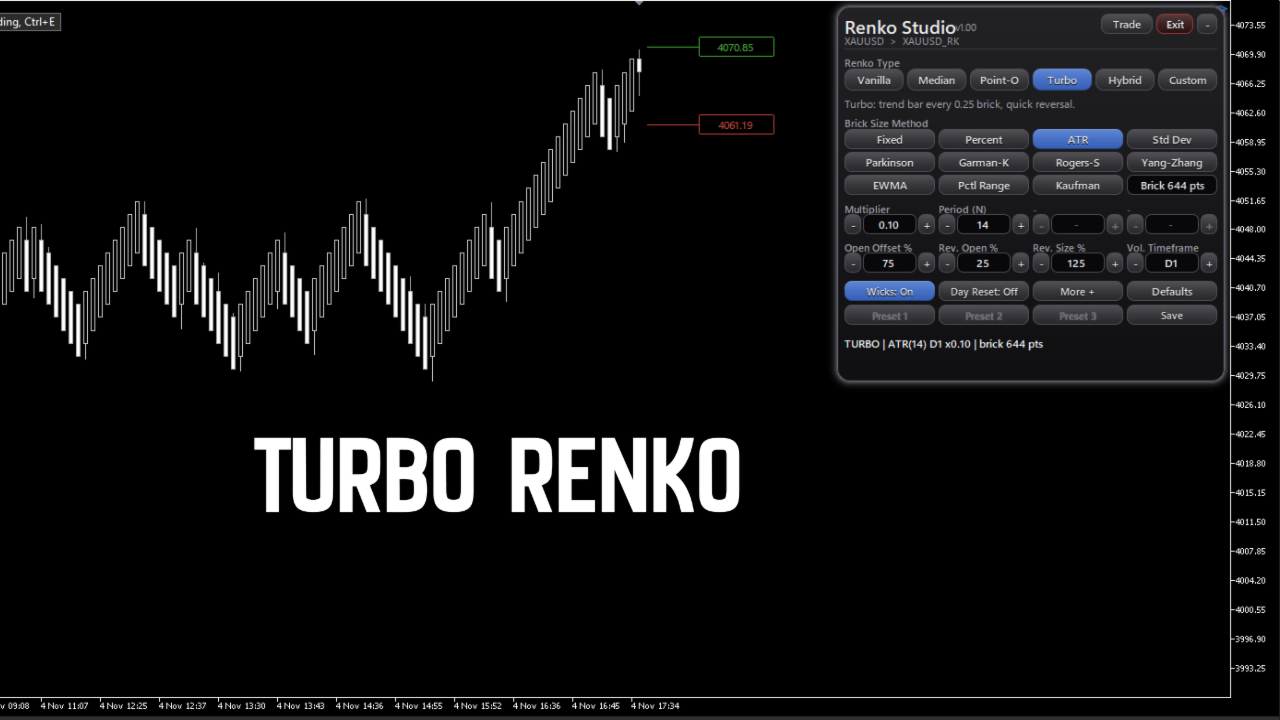
Vanilla, Median, Point-O, Turbo, Hybrid and Custom. In Custom you set three values yourself: open offset, reversal open offset and reversal bar size.

Brick size methods
Fixed points, percent of price, ATR, standard deviation, Parkinson, Garman-Klass, Rogers-Satchell, Yang-Zhang, EWMA, percentile of range and Kaufman adaptive. The volatility timeframe, period and multiplier can be adjusted. In Static mode the size is measured at the start of the history, so it does not use data from the future.

History and live data

  • Live: every tick is processed. Ticks are not lost between updates, and after a network disconnection the missing ticks are read, so the chart is not rebuilt.
  • History: real ticks are used for the last days that the broker provides (default 30), and M1 bars for the older part. When ticks are available, rebuilding the chart gives the same bricks that were seen live.
  • The start of the history is aligned to Monday, so rebuilding several times in the same week gives the same chart.
  • Volume is the number of ticks.
  • You can choose M1 bars only for a faster load.

Other functions

  • Wicks, day reset, three user presets, save and defaults.
  • Three color themes: Default, Dark and White.
  • Information on each brick (open, close, size and time) shown over the chart.
  • Optional export of the real time of each brick to a CSV file in the MQL5\Files folder.
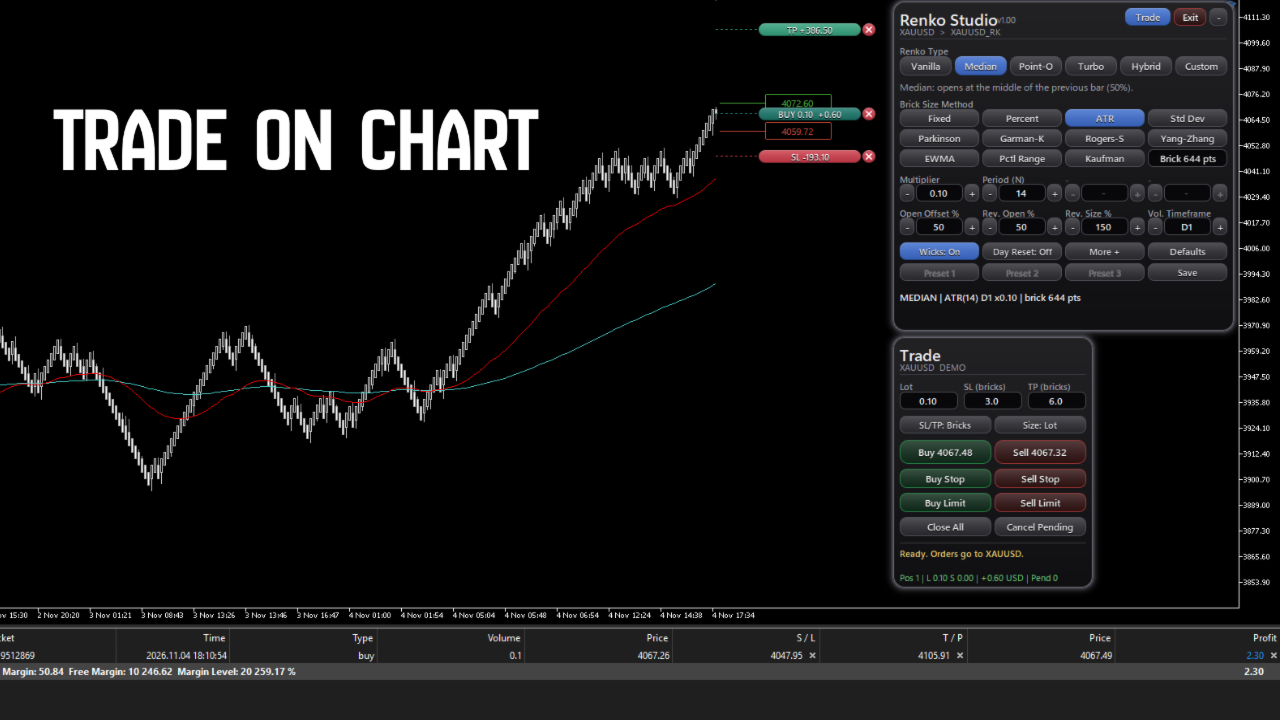
  • Trade panel: BUY, SELL, CLOSE ALL, and SL and TP lines that can be dragged. Orders are sent to the real symbol, not to the Renko symbol. Lot size can be fixed or based on risk.

Requirements and limits

  • It runs on a live chart. It does not run in the Strategy Tester.
  • The number of days of tick history depends on the symbol and the broker. Where there are no ticks, M1 bars are used.
  • MetaTrader 5 needs one bar per minute in a custom symbol. For this reason the time shown on a Renko bar is not the real time of the brick. The real time is shown in the brick information and in the CSV export.
  • Other Expert Advisors cannot trade the Renko symbol, because MetaTrader 5 does not allow trading on custom symbols.
  • Trading from the panel needs Algo Trading enabled in the terminal and in the properties of the Expert Advisor.
  • Trading involves risk. This product is a charting tool and does not predict prices or promise any result.

Support
Please use the Comments section of this product or send a private message on MQL5.

推荐产品
Pattern Recognition EA
Claudiu-georgian Zavera
Pattern Recognition EA - From Learn to Earn. The market repeats itself. This EA finds every past repeat of the current candle sequence - and lets history vote the direction. ONE SHAPE. EVERY REPEAT IN HISTORY VOTES. The last N candles on your signal timeframe form a shape. The EA scans the history you choose - a fixed number of bars or everything your broker provides - for the SAME shape, and checks what happened next, every single time. Only when enough repeats exist AND a clear majority of t
Delta Profile Volume
Teresinha Moraes Correia
指标技术说明 – Delta Profile for MetaTrader 5 Delta Profile 是为 MetaTrader 5 开发的一款指标,用于在指定的 K 线区间内对成交量流进行详细分析。它能够在不同的价格水平上对正向成交量(与上涨相关)和负向成交量(与下跌相关)的不平衡进行结构化和可视化展示。最终,用户可以清晰地识别图表中成交最为集中的区域,以及真实的市场不平衡形成的位置。 以下是该指标的主要技术特征与参数说明。 核心概念 指标会识别 价格水平 ,并将其分类为正向成交量、负向成交量,以及净 Delta(正负成交量的差值)。 每个价格水平会在图表中以 水平条形 显示,帮助用户直观观察市场活跃区和不平衡区域。 用户可自由控制 分析的 K 线数量 、 价格精度(小数位数) 、 显示的最大水平数量 以及 可视化样式 。 主要功能 价格水平映射 :根据设定的精度对价格进行四舍五入,并累计对应 K 线的成交量。 净 Delta 计算 :显示正负成交量的差值,提供每个价格区间的客观数值。 最强 Delta 水平突出显示 :自动识别 Delta 绝对值最大的价格水平,并用特殊颜色标
DAILY OH/OL SDEV QUANT MODEL - STATISTICAL TRADING WITH PRECISION RISK MANAGEMENT TRADE WITH MATHEMATICAL CERTAINTY - KNOW YOUR EXACT STOP-LOSS AND TAKE-PROFIT BEFORE YOU ENTER This indicator analyzes 5,000+ days of price history to give you: Exact entry levels (sigma bands locked at daily open) Exact stop-loss distance (from M
该指标建立当前报价,可以与历史报价进行比较,并在此基础上进行价格走势预测。指示器有一个文本字段,用于快速导航到所需日期。 选项: 符号 - 选择指标将显示的符号; SymbolPeriod - 选择指标从中获取数据的时段; IndicatorColor - 指示器颜色; HorisontalShift - 由指标绘制的报价移动指定的柱数; Inverse - true 反转引号,false - 原始视图; ChartVerticalShiftStep - 图表垂直移动(键盘上的向上/向下箭头); 接下来是文本字段的设置,您可以在其中输入日期,您可以通过按“回车”立即跳转到该日期。 接下来是文本字段的设置,您可以在其中输入日期,您可以通过按“回车”立即跳转到该日期。
Volume flow Profile
Israr Hussain Shah
大师版是一款专业级的分析工具,旨在通过成交量和资金流向的视角来可视化市场结构。与标准的成交量指标不同,该工具直接在图表上显示每日成交量分布,让您准确看到价格发现发生的位置以及“聪明钱”的定位。 此大师版专为清晰度和速度而设计,具有独特的自动主题同步系统,加载后即刻美化您的图表布局。 主要特点: 真实资金流向计算: 超越标准的跳动量。启用“Use Money Flow”时,成交量按价格加权,揭示了特定价格水平的实际资金投入。 价值区域 (VA) 可视化: 自动计算价值区域(默认为成交量的70%)。 VA填充: 为价值区域背景着色,以便即时识别控制区域。 关键水平: 清晰标记控制点 (POC)、价值区域高点 (VAH) 和价值区域低点 (VAL)。 专业标记系统: 扫描概况结构以识别关键交易区域: HVN (高成交量节点): 接受和盘整区域(支撑/阻力)。 LVN (低成交量节点): 拒绝区域或“快速通过”区域。 所有标记均向右绘制延长线,便于监控。 Delta 背离(左侧直方图): 左侧直方图可视化每个级别的买卖压力对比。这有助于识别隐藏的背离——即价格可能上涨,但卖家在这些水平上激进打
Fast, non-repainting Renko charts for MetaTrader 5: Classic, Point-O, Mean, Range Bars and Tick Bars. A closed brick never changes. The Renko chart is a real MT5 chart, so your indicators and drawings work on it. Auto brick size, live next-brick levels, and charts ready in seconds. Overview Renko Studio turns any MT5 symbol into clean, fast Renko charts built from your broker's real tick data. The Renko chart is a real MT5 chart, so your indicators, drawings and templates work on it, and everyt
Blahtech Market Profile MT5
Blahtech Limited
5 (10)
Was: $249  Now: $99   Market Profile defines a number of day types that can help the trader to determine market behaviour. A key feature is the Value Area, representing the range of price action where 70% of trading took place. Understanding the Value Area can give traders valuable insight into market direction and establish the higher odds trade. It is an excellent addition to any system you may be using. Inspired by Jim Dalton’s book “Mind Over Markets”, this indicator is designed to suit the
ONNYX INDICATOR 版本 1.14 这是一款用于 MetaTrader 5 的供需区域分析指标。已确认的历史信号采用收盘K线逻辑,避免确认后的箭头因盘中波动而消失。指标根据确认的摆动高低点建立区域,使用 ATR 调整区域宽度,并以百分比显示区域质量。 主要功能 - 供需区域及区域内百分比评分。 - 收盘K线确认后的放大 BUY/SELL 箭头。 - 可选 EMA 趋势过滤和K线拒绝确认。 - 趋势、价格水平和市场环境面板。 - 最多显示 5 条相关经济新闻;公布前显示 Forecast 和 Previous,公布后显示 Actual。 - 新闻每 60 秒刷新,并支持策略测试器中的日历缓存。 - 弹窗、推送和邮件提醒。 - iCustom 集成:缓冲区 0 为 BUY 价格,缓冲区 1 为 SELL 价格。 使用方法 将指标加载到图表,等待历史数据完成加载,查看趋势和有效区域,然后结合自己的交易计划使用收盘K线信号。XAUUSD H1 适合更清晰的结构,M15 可获得更频繁的机会。 重要提示 本产品是分析指标,不是自动交易 EA,不会自动开仓、修改或平仓,也不保证盈利。请先
- All of my indicators are just 30$ !! Limited offer. Contact me for extra bonus   indicator, instruction or any questions! - Lifetime update free - Non-repaint - Plus Free Filtering Indicator  - Related product: Gann Gold EA - I just sell my products in Elif Kaya Profile, any other websites are stolen old versions, So no any new updates or support. Advantages of  M1 Scalper Pro  Profitability: M1 Scalper Pro is highly profitable with a strict exit strategy. Frequent Opportunities: M1 Scalper
What if you could finally SEE where the market really wants to go? Most traders watch price. Pros watch VOLUME — where the money was actually traded. Volume Profile Fibo Confluence puts that reading right in front of you, in plain language, no jargon. WHAT YOU SEE ON YOUR CHART • The POC, the most-traded price: the market's natural magnet • The value area (VAH / VAL): the "house" where price spends its time • Automatic Fibonacci retracement + the golden pocket • Low-volume nodes
Price Magnet — Price Density and Attraction Levels Indicator Price Magnet is a professional analytical tool designed to identify key support and resistance levels based on statistical Price Density. The indicator analyzes a specified historical period and detects price levels where the market spent the most time. These zones act as “magnets,” attracting price action or forming a structural base for potential reversals. Unlike traditional Volume Profile tools, Price Magnet focuses on price-time d
Here   our more valuable tools SMC Trend Trading   ,  Easy SMC Trading  ,  Institutional SMC Architect Volume Analysis Tools  ,  Volume flow Profile  ,  Market volume profile  , FVG with Volume  , Liquidity Heatmap Profile  ,  Volume Spread Analysis The    Liquidity Heatmap   is a sophisticated institutional trading tool designed to reveal where over-leveraged traders are trapped. By calculating estimated liquidation levels based on volume spikes and leverage, this indicator draws a dynamic "h
MACD Sniper Pro
Noppawat Tumjai
MACD Sniper Pro is an advanced automated trading system designed for traders seeking high-precision entries and robust risk management. By combining the classic momentum of MACD Crossover with a strict ADX Volatility Filter and Dynamic ATR Management , this EA completely eliminates emotional trading and filters out dangerous flat/sideways markets. Unlike standard MACD indicators that suffer during consolidation, MACD Sniper Pro verifies trend strength before entering and protects your capital us
ATTENTION ! Utilities do not have a good functionality on backtest mode. For Having a Demo Trial, message me from message box and receive 3 days trial. Our Team Services: If you are want to see our products click the link:   LINK If you have an idea you'd like to develop into an application, click the link:   LINK Instant on-chart stop & target levels, from 1:1 up to 1:6. Trade Ratio Lines MT5 draws an open stop line and objective lines (take-profit) at fixed R-multiples relative to your entry
This Volume Delta Profile is an advanced MetaTrader 5 indicator that visualizes   volume delta (order flow imbalance)   using a volume profile-style histogram. It shows the difference between buying and selling pressure at specific price levels, helping traders identify supply and demand zones. This indicator provides a unique perspective on market dynamics by visualizing the imbalance between buying and selling pressure, offering insights beyond traditional volume analysis. Core Concept Positiv
累积成交量增量 (CVD) MA-X:智能订单流情绪工具 通过 Cumulative Volume Delta (CVD) MA-X 揭示市场的隐藏机制。传统的成交量指标只能告诉你交易了 多少 ,而 CVD MA-X 则能告诉你 谁 在胜出以及 何时 胜出。通过聚合 Tick 级的价格行为和成交量分布,该指标为你提供了一张清晰的市场信念与衰竭地图。 交易者优势:为什么选择 CVD MA-X? 大多数交易者失败是因为他们对滞后的价格做出反应。CVD MA-X 通过分析 K 线的内部压力(影线与实体的比例)并结合成交量权重,为你提供 领先优势 。它实时回答了三个关键问题: 这次波动是否有真金白银支持? (CVD 与零轴的配合) 趋势是否正在失去动力? (MaxBuy/MaxSell 衰竭点) 大资金是否与价格背离? (内置背离引擎) 强大功能与实用性 智能权重阈值: 不同于简单的 Delta 计算,该指标通过解构 K 线影线和实体长度来计算“买入 vs 卖出成交量”,提供更细腻的意图观察。 双层信号逻辑: 兼具 CVD 零轴交叉 和 MA(CVD 移动平均线)零轴交叉 。这使你能够区分短
Harmonic Pattern Structure Harmonic Pattern Structure is a professional MetaTrader 5 indicator that automatically detects classic harmonic patterns using strict Fibonacci ratio validation and XABCD price structure. Designed for traders who value precision, clean visuals, and structured analysis, the indicator highlights potential reversal zones based on price geometry, supporting consistent and objective decision-making. SUPPORTED HARMONIC PATTERNS Gartley (222) Butterfly Bat Crab Shark Cy
Introducing "X Marks the Spot" – Your Ultimate MetaTrader 5 Indicator for Perfect Trades! Are you tired of the guesswork in trading? Ready to take your MetaTrader 5 experience to a whole new level? Look no further – "X Marks the Spot" is here to revolutionize your trading strategy! What is "X Marks the Spot"? "X Marks the Spot" is not just another indicator – it's your personal trading compass that works seamlessly on all timeframes . Whether you're a beginner or an experienced trader,
Fvg Edge
Ahmad Meftah Abdulsalam Alawwami
5 (3)
FVG智能区域 - 免费版 MetaTrader 5 (MT5) 公允价值缺口检测指标   您是否在寻找真正的交易工具,而不仅仅是另一个随机指标? FVG智能区域 - 免费版通过自动检测公允价值缺口(FVG)并在图表上直接高亮显示高概率交易区域,为您提供专业的市场洞察。   专为以下交易者打造: 聪明资金概念(SMC) ICT交易概念 价格行为 供需分析 机构交易策略 该指标帮助您专注于真正重要的事情:价格可能做出反应的区域。 主要特点: 智能区域检测: 自动检测看涨和看跌缺口 清晰、专业的视觉区域 智能过滤以消除弱相关或不相关的缺口 高级确认: 更高时间框架(HTF)汇合验证 当价格填补时智能移除无效区域 活动区域与已填补区域之间的清晰视觉区分 优化性能: 轻量快速 - 不会拖慢您的图表 兼容所有货币对和时间框架 真实交易条件下的平稳运行 完全自定义: 完全可调整的颜色和视觉风格 完美适用于外汇、黄金(XAUUSD)、指数和加密货币 适合日内交易、波段交易和剥头皮交易
FREE
Market Projection Pro — MT5 想在图表上观察所选价格周期可能如何延伸?Market Projection Pro 分析您选择的历史区间,提取周期成分,并在分析窗口右侧绘制合成投射。您可以控制历史区间和向前延伸的长度,将计算情景与价格结构及潜在转折区域进行对比。 图表上显示什么 可交互边界允许您直接在图表上选择历史分析区间。 周期成分和合成曲线帮助观察所选走势的节奏。 投射按照指定的未来蜡烛数量延伸计算情景。 可选转折点和转折区域便于检查投射结构。 图表上的计算、构建与清除按钮让操作集中在同一界面。 使用方法 选择两条边界之间的区间,点击 Calculate Cycles,再点击 Build Projection。分析长度是用于计算的历史蜡烛数量;投射范围是向前绘制的蜡烛数量,两者分别设置。修改区间后,请重新计算周期并重建投射。需要比较情景时,选择另一段历史并重复计算;需要观察转折时,开启转折点或区域。 购买前试用 下载演示版,在 MT5 中启动可视化测试,以使用图表按钮和边界。选择历史数据充足的区间,计算周期并构建投射。建议从默认的 70 根蜡烛投射范围开始。
可以说,这是您可以为MetaTrader平台找到的最完整的谐波价格形成自动识别指标。它检测19种不同的模式,像您一样认真对待斐波那契投影,显示潜在的反转区域(PRZ),并找到合适的止损和获利水平。 [ 安装指南 | 更新指南 | 故障排除 | 常见问题 | 所有产品 ] 它检测19种不同的谐波价格形态 它绘制了主要,衍生和互补的斐波那契投影(PRZ) 它评估过去的价格走势并显示每个过去的形态 该指标分析其自身的质量和性能 它显示合适的止损和获利水平 它使用突破来表明合适的交易 它在图表上绘制所有样式比率 它实现了电子邮件/声音/视觉警报 受斯科特·M·卡尼(Scott M. Carney)的书的启发,该指标旨在满足最纯粹和最熟练的交易者的需求。但是,它采取了一种使交易更容易的方式:在向交易发出信号之前,它会等待Donchian朝正确方向突破,从而使交易信号非常可靠。 斐波那契投影与向量无关 它实现了电子邮件/声音/推送警报 它绘制了ABCD投影 重要提示: 为了符合 Scott M. Carney先生 的商标申诉,某些图案名称已重命名为不言自明的替代方式, Scott M.
RRtoolBox
David Ruiz Moreno
RRtoolbox - Professional Tools: Risk:Reward Trading Tool (SL/TP Horizontals + Pending orders + Diagonals), Alerts set on trend lines (for alerts on diagonal levels), SelfManagement (BE, partials...), close/cancelling by time, Statistics, Info and trading on chart. One-Click Trading with Visual Risk:Reward Management RRtoolbox is a comprehensive trading panel that combines one-click order execution,  statistics and  powerful visual Risk:Reward tools, alerts set with trendlines, on chart butt
Noize Absorption Index
Ekaterina Saltykova
Noize Absorption Index - is the manual trading system that measures the difference of pressure between bears forces and bulls forces. Green line - is a noize free index that showing curent situation. Zero value of index shows totally choppy/flat market.Values above zero level shows how powerfull bullish wave is and values below zero measures bearish forces.Up arrow appears on bearish market when it's ready to reverse, dn arrow appears on weak bullish market, as a result of reverse expectation.
Eazy RSI Divergence
Gawain Athur Stephan Cloete
Eazy Divergence is a non-repainting MT5 indicator designed to automatically detect and plot Regular and Hidden divergence signals in real time Key Features Dual-Window Plotting: Displays divergence trendlines and text badges directly on both the main price chart and the RSI subwindow. 100% Non-Repainting: Uses left/right pivot strength confirmation so signals stay fixed once drawn. Full Multi-Timeframe Support: Adapts instantly to whatever chart timeframe you are viewing. Fully Customizable: Eas
Trade Manger
Israr Hussain Shah
Here   our more valuable tools SMC Trend Trading   ,  Easy SMC Trading  ,  Institutional SMC Architect Volume Analysis Tools  ,  Volume flow Profile  ,  Market volume profile  , FVG with Volume  , Liquidity Heatmap Profile  ,  Volume Spread Analysis You Give an Instruction: When you run the script, a window pops up with a dropdown menu. You choose exactly what you want it to do from the list (e.g., "Close Profit Only" or "Delete Pending Orders"). It Scans Your Positions: The script then reads
Professional Renko Chart MT5 Professional Renko Chart MT5 是一款简洁的 MetaTrader 5 Renko 图表指标,用于在独立的指标窗口中显示 Renko 砖块,并可选择直接在主价格图表上显示 Renko 方框。 该指标适合希望在 MetaTrader 5 中使用熟悉 Renko 图表风格的交易者,其视觉效果类似于 TradingView 等现代图表平台中的 Renko 图表显示方式。它可以将普通的基于时间的K线转换为 Renko 砖块,并以简单、清晰、实用的格式显示结果。 多个普通图表K线可能会形成一个 Renko 砖块。Professional Renko Chart MT5 还可以在主价格图表上显示 Renko 方框,并显示每个 Renko 砖块由多少根普通K线形成。 该指标不是智能交易系统 EA。它不会开仓、平仓或管理交易。它只是一个用于图表显示和市场分析的可视化工具。它可用于手动分析、Renko 图表阅读、趋势观察、价格波动过滤以及市场结构分析。 主要功能 在独立的 MT5 指标窗口中显示 Renko 砖块 Ren
VOLUME PROFILE SAF-XII 专业级 MT5 市场轮廓(成交量概况)分析仪 —— 网格交易者的梦幻指标 什么是成交量概况 (Volume Profile)? 成交量概况是一种专业的机构级工具。与传统的随时间显示成交量的指标不同,它显示的是 特定价格水平 上的交易活动。它揭示了交易发生在 哪里 ,帮助您识别: 价值区 (VAH/VAL) :大部分交易发生的价格区间。 控制点 (POC) :成交量最高的核心价格水平。 流动性失衡 :每个层级的多空主导力量对比。 支撑/阻力 :基于实际交易活动形成的天然价格位。 三种操作模式 —— 真正的“设置后即忘” VP_MANUAL(波段交易与关键位分析) 用户通过拖动垂直线自定义分析范围。 仅在移动线条时重新计算。 适用场景 :新闻前夕分析、财报发布、特定日期范围。 VP_AUTO(头寸与动量交易) 随新柱线自动向后滚动。 使用自定义回溯周期(默认 100 根柱线)。 适用场景 :动量策略、突破交易。 VP_SESSION(日内交易与机构流向) 锚定逻辑交易时段(伦敦、纽约、亚洲盘开盘)。 适用场景 :日内交易、基于时段的机构化策略
Philippe Calibre 79 Gold
Yassir Lamrichi
5 (2)
Philippe Calibre 79 | 专为 XAUUSD 打造的高精度算法交易系统 实时信号 实盘信号: 点击这里 其他可选风险策略 风险策略 说明 下载链接 保守型策略  侧重低风险敞口 下载  预设 防御型策略  降低波动风险 下载 预设 严格防御配置 严格的风险限制 下载 预设 系统官方文档 详细的使用教程与参数指南,请查阅我们的 MQL5 官方博客文章: [链接] 完整输入参数配置手册 [链接] 资金管理与风险控制配置指南 [链接] 每日净值风控 (Daily Equity) 设置教程 系统概述 Philippe Calibre 79 是一款专为 MetaTrader 5 平台的黄金 (XAUUSD) 交易而设计的高性能全自动 EA。该系统基于动量分析与统计价格行为学 (Price Action) 寻找入场契机。系统内置高效的订单组合闭合机制 (Basket Closure) 来处理持仓,杜绝不可控的盲目马丁倍投风险。 核心功能 • 订单组合管理 (Basket Management):自动将亏损订单与较大盈利订单进行对冲抵消,在设定的目标利润水平整体退出。
Advanced Volume Profile Analysis Tool for MetaTrader 5 The Kecia Volume Profile Order Finder provides traders with volume profile analysis capabilities. This MT5 indicator combines volume profile visualization with statistical calculations to help identify potential trading opportunities and suggests entry, stop loss, and take profit levels based on market structure. Market Profile Visualization Transform your chart with customizable volume profile visualizations: Multiple visualization options
该产品的买家也购买
Trade Assistant MT5
Evgeniy Kravchenko
4.43 (216)
它有助于计算每笔交易的风险,容易安装新的订单,具有部分关闭功能的订单管理, 7 种类型的追踪止损和其他有用的功能。   附加材料和说明 安装说明   -   应用程序说明 线条功能  - 在图表上显示开仓线、止损线、止盈线。 有了这个功能,就可以很容易地设置一个新的订单,并在开仓前看到它的附加特性。   风险管理  - 风险计算功能在考虑到设定的风险和止损单的大小的情况下,计算新订单的成交量。它允许你设置任何大小的止损,同时观察设定的风险。 批量计算按钮 - 启用 / 禁用风险计算。 在 " 风险 " 一栏中设置必要的风险值,从 0 到 100 的百分比或存款的货币。 在 " 设置 " 选项卡上选择风险计算的变量: $ 货币, % 余额, % 资产, % 自由保证金, % 自定义, %AB 前一天, %AB 前一周, %AB 前一个月。   R/TP 和 R/SL - 设置止盈和止损的关系。 这允许你设置相对于损失的利润大小。 例如, 1 : 1 - 这决定了 TP = SL 的大小。 2 : 1 - 这意味着 TP 是 SL 的两倍。 RR - 它禁用比率。   订单管理 该面板支
Farmed Hedge Yield Farming | All Markets (Manual - Hybrid - Semi/Automated EA) VERIFIED TRADING RESULTS - Farmed Hedge Yield Axi Copy:  https://www.mql5.com/en/signals/2356376 - Farmed Hedge Yield Exn Copy:   https://www.mql5.com/en/signals/2356404 - Farmed Hedge Yield V Copy:  https://www.mql5.com/en/signals/2357156 IMPORTANT NOTICE: FarmedHedge is a MANUAL-FOCUSED TRADING UTILITY ,not a fully automated EA. Results shown on this Signal include manual trades and overall strategic management.
欢迎来到 Trade Manager EA——这是一个终极风险管理工具,旨在使交易变得更直观、精准和高效。它不仅仅是一个下单工具,而是一个用于无缝交易计划、仓位管理和风险控制的全面解决方案。不论您是新手交易员、资深交易员,还是需要快速执行的剥头皮交易员,Trade Manager EA 都可以满足您的需求,适用于外汇、指数、大宗商品、加密货币等各种市场。 借助 Trade Manager EA,复杂的计算已成过去。只需分析市场,在图表上用水平线标记入场、止损和止盈,设置您的风险水平,Trade Manager 就会立即计算出理想的头寸规模,并实时显示以点、账户货币计价的止损和止盈。每笔交易都得以轻松管理。 主要功能: 头寸规模计算器 :根据定义的风险瞬间确定交易规模。 简单的交易计划 :在图表上用可拖动的水平线直接计划交易,设置入场、止损和止盈。 实时显示 SL 和 TP :以账户货币、点或分显示止损和止盈,便于分析。 高级保护工具 盈亏平衡选项 : 基本盈亏平衡 :当您的交易达到设定水平时自动保护利润。 多级盈亏平衡 :设置多达 4 个级别以逐步保护利润。 尾随止损选项 : 基本尾随
Telegram to MT5 Multi-Channel Copier   可将您 Telegram 和 Discord 频道中的交易信号自动复制到 MetaTrader 5。无需机器人、无需浏览器扩展、无需手动复制。信号一到 Telegram 或 Discord,EA 几秒内就在您的终端开仓。 在复制某个频道之前,内置回测器还能告诉您该频道在您的账户上会有怎样的表现。 产品包含两个组件:一个监听您 Telegram 频道的 Windows 应用程序,以及在 MT5 终端执行信号的本 EA。同时提供 MT4 版本   点此 . 购买前先试用:   应用程序可免费下载。连接您自己的频道,查看每条信号的读取结果。Backtest 选项卡和实际交易需要已购买或已租用的 EA。本页面的免费演示版只能在策略测试器中运行,而策略测试器无法读取 Telegram 和 Discord。 设置指南与应用下载:   https://www.mql5.com/zh/blogs/post/779480 了解如何 回测任何 Telegram 信号频道 。 当前价格将来会上调。 工作原理 应用通过您自己的 Te
TradePanel MT5
Alfiya Fazylova
4.88 (172)
交易面板是一款多功能交易助手。该应用包含超过50种手动交易功能,并允许您自动执行大多数交易任务。 应用程序说明 : https://www.mql5.com/zh/blogs/post/761102 用于模拟账户的应用程序试用版: https://www.mql5.com/zh/blogs/post/762579 如何安装应用程序: https://www.mql5.com/zh/blogs/post/762580 如何在可视化模式下测试应用程序: https://www.mql5.com/zh/blogs/post/770278 如何在VPS MetaTrader上安装应用程序: https://www.mql5.com/zh/blogs/post/770196 贸易. 只需单击一下即可执行交易操作: 打開掛單和頭寸,並自動計算風險。 一鍵打開多個訂單和頭寸。 打開訂單網格。 按組別關閉掛單和頭寸。 反轉頭寸方向(關閉買入>打開賣出,關閉賣出>打開買入)。 鎖定頭寸(通過開啟缺少的頭寸,使買入和賣出頭寸的數量相等)。 一鍵部分關閉所有頭寸。 將所有頭寸的止盈和止損設置在同一價格水平。
News Trade EA MT5
Konstantin Kulikov
4.55 (11)
在此向大家介绍一款我本人使用多年的机器人。该产品支持半自动和全自动交易模式。 >>> Chat <<< 本程序包含基于经济日历新闻的灵活交易设置功能。不支持策略测试器检验。仅可进行实际操作。 下載最新的設定檔: https://www.mql5.com/en/blogs/post/747929 訊號監控: https://www.mql5.com/en/signals/author/test-standart 请参考博客中各类参数说明自行实现个性化设置   : https://www.mql5.com/en/blogs/post/748545   。 主要默认设置说明 单一图表英镑/GBP(英镑美元/GBPUSD、欧元英镑/EURGBP、英镑日元/GBPJPY、英镑加拿大元/GBPCAD、英镑澳大利亚元/GBPAUD、英镑瑞士法郎/GBPCHF)货币对操作。英镑/GBP是波动性最大的货币,能够为用户顺利完成交易提供更多机会。 Use_Symbols_from_Line = true; Symbols_Line = GBPUSD, EURGBP, GBPJPY, GBPCAD, GB
按照自己的交易规则复制 Telegram 信号 Telegram to MT5 Signal Trader 可将 Telegram 公开及私密频道和群组中的文字交易信号自动复制到 MetaTrader 5。通过一个桌面应用管理多个信号提供者和 MT5 账户,并为 每个提供者单独设置风险和交易参数 。 复制信号无需 Telegram 机器人,也无需配置 API。 只需通过手机号或二维码登录您自己的 Telegram 账户,然后选择您已加入的频道或群组。您无需创建机器人,也无需提供 Telegram API 令牌、API ID 或 API hash。 自行选择仓位大小,将平仓分配到多个止盈价位,并自动执行保本止损和移动止损。在跟随信号提供者的同时,掌握信号的实际交易方式。 本产品由这款 MT5 EA 和必须配合使用的 Windows 桌面应用组成。请参阅 安装指南及应用下载 。 管理多个信号提供者和账户 为每个提供者单独设置: 为每个频道设置专属的仓位计算方式、入场规则、止损、止盈和交易管理参数。 灵活分配至不同账户: 将同一提供者的信号复制到多个已连接的 MT5 账户,并为每个账户使用不
================================================================================ POC BREAKOUT - V20.72. Full Professional Grade Toolkit ================================================================================ POC Breakout is a full MetaTrader 5 trading dashboard for discretionary traders who want breakout signals, Point of Control (POC) context, volume profiles, order flow, market structure, news, alerts, and advanced trade planning in one professional workspace. Attached directly to you
The product will copy all telegram signal to MT5 ( which you are member) , also it can work as remote copier.  Easy to set up, copy order instant, can work with almost signal formats, image signal,  s upport to translate other language to English Work with all type of channel or group, even channel have "Restrict Saving Content", work with  multi channel, multi MT5 Work as remote copier: with signal have ticket number, it will copy exactly via ticket number. Support to backtest signal. How to s
EA Overfitter
Stephen J Martret
5 (3)
回测看起来很漂亮。但它明天、下周、下个月还能继续赚钱吗? EA Overfitter 让您的 EA 在 100 段它从未见过的价格历史上重新运行。一个分数告诉您这个优势是否真实。 回测告诉您的,是 EA 在某一段价格历史上的表现——那段恰好发生过的历史。您无法从中判断,这个结果有多少来自策略本身,又有多少只是那一条特定路径带来的。 EA Overfitter 回答的正是这个问题。它构建最多 100 段您的 EA 从未交易过的合成价格历史,让策略在全部这些历史上重新运行,并展示它所产生的完整结果区间。您得到的不再是一条幸运或不幸路径上的单个数字,而是一幅真实的图景:策略在陌生数据上多久能赚钱、典型结果是什么样(而不是最好的那一次),以及您的回测离它有多远。 这些世界是由您自己的近期历史重建而成,因此这不是预测——任何从历史数据出发的检验都不可能是预测。它告诉您的是:这个优势是否依赖于价格的某一种特定排列,以及回测数字距离典型结果有多远。在投入资金之前,这才是值得回答的问题。 三个步骤 1. 构建。在图表上选择时间区间和世界数量,然后按 Build。EA Overfitter 会
Power Candles 策略扫描器——自优化多符号设置查找器 Power Candles策略扫描器 采用与Power Candles指标相同的自优化引擎,可同时扫描您“市场观察”中的所有交易品种。一个面板即可显示当前哪些品种在统计上具备交易价值、每种策略的最佳应用方向、最优止损/止盈组合,并在新信号触发时立即向您发送提醒。 本工具是 Stein Investments 生态系统的一部分 - 18+ 款工具,加上 Max,您的一对一 AI 交易导师。  随时在线,深入了解每一款指标,在您需要梳理思路的那一刻就在那里。  立即认识他: https://stein.investments 您的全面市场监控。每个交易品种超过3,000次自动优化。2种警报类型。一键切换图表并采取行动。 为何您需要此工具 大多数多标的扫描器仅展示价格 波动 。每只股票的波动率、百分比变化、RSI。您仍需自行摸索正确的策略、合适的止损位以及理想的入场阈值。Power Candles策略扫描器针对每只股票自动解答这些问题,仅在数学验证过的交易设置中触发实际入场信号时才会向您发出提示。这就是全部卖点。 自动
Anchor Trade Manager
Kalinskie Gilliam
5 (8)
Your EAs cannot see each other, but Anchor can. Anchor gives you one place to coordinate your EAs, manage risk, and decide when trading is allowed. It works alongside the trading bots you already use without any changes to them. The Problem One EA opens a trade. Then another starts trading. The next thing you know, you wake up to multiple grids built across your account. Each EA may be doing exactly what it was designed to do, but together they can place far more risk on your account than you in
下一次更新 — 版本 2.52 即将推出![全新功能] 准备迎接 4 项重大新功能,全面提升您的市场分析能力与交易流程! 我们将通过 4 项全新功能,进一步提升市场分析水平,满足您的交易需求。现为您介绍: 1. TRADE OVERVIEW DASHBOARD 2. CONFLUENCE AT ZONE 3. STRONG & WEAK HIGH/LOW 4. OTE 1. TRADE OVERVIEW DASHBOARD 一个帮助您更轻松地了解整体市场状况的仪表盘,为您的交易决策提供参考指引,帮助您系统地分析市场并规划交易,所有信息尽在一个屏幕中。 多时间周期市场概览(Multi-Timeframe Market Overview) 更清晰地了解市场方向与价格结构 快速查看市场状况 为系统化市场分析和入场规划提供指引。 2. CONFLUENCE AT ZONE 当价格进入关键区域时……您将了解有多少项支持因素相互吻合。 关键区域是交易决策至关重要的地方。但仅仅是价格进入某个区域还不够。此功能可帮助您在入场交易前,识别相互吻合的因素,包括信号及其他相关因素,从而进行更全面的分析,并
Trade Indicator Assistant   is a powerful MT5 utility designed to turn indicators into automated trading systems. Its main feature is the ability to automatically detect an indicator’s   BUY and SELL signal buffers , without requiring you to know the buffer numbers, search through indicator settings, or modify the indicator source code. Bonus Indicator:   After purchasing Trade Indicator Assistant, contact me to receive   Trade Signal Pro   completely free as a bonus indicator. [Download Demo V
EA Auditor
Stephen J Martret
5 (7)
EA Auditor is an independent analysis tool for traders evaluating Expert Advisors and trading signals on MetaTrader 5. It audits backtest reports, reviews posted developer signals, and cross-verifies the two against each other to help traders assess strategies before committing capital. The MQL5 market offers a wide range of Expert Advisors from many developers, with varying approaches, quality, and transparency. EA Auditor provides a consistent, data-driven framework for reviewing them, answer
Trade Manager DaneTrades
Levi Dane Benjamin
4.13 (31)
交易管理器可帮助您快速进入和退出交易,同时自动计算风险。 包括帮助您防止过度交易、报复性交易和情绪化交易的功能。 交易可以自动管理,账户绩效指标可以在图表中可视化。 这些功能使该面板成为所有手动交易者的理想选择,并有助于增强 MetaTrader 5 平台。多语言支持。 MT4版本  |  用户指南+演示 交易经理在策略测试器中不起作用。 如需演示,请参阅用户指南 风险管理 根据%或$自动调整风险 可选择使用固定手数或根据交易量和点自动计算手数 使用 RR、点数或价格设置盈亏平衡止损 追踪止损设置 最大每日损失百分比,在达到目标时自动平仓所有交易。 保护账户免遭过多提款并阻止您过度交易 最大每日损失(以美元为单位)在达到目标时自动关闭所有交易。 保护账户免遭过多提款并阻止您过度交易 一键实现所有交易的盈亏平衡 自动计算从手机/电话发送的交易的风险 OCO 在设置中可用 交易和头寸管理 通过设置每月、每周、每天、每小时或每分钟的最大交易次数,停止过度交易和报复性交易。 高级挂单管理。 调整何时关闭挂单的规则 追踪挂单 支持市价订单和挂单 每日最大利润目标(以美元为单位)以确保头寸并停止
MT5 to Telegram Signal Provider 是一个易于使用且完全可自定义的工具,它允许向 Telegram 的聊天室、频道或群组发送 指定 的信号,将您的账户变为一个 信号提供商 。 与大多数竞争产品不同,它不使用 DLL 导入。 [ 演示 ] [ 手册 ] [ MT4 版本 ] [ Discord 版本 ] [ Telegram 频道 ]  New: [ Telegram To MT5 ] 设置 提供了逐步的 用户指南 。 不需要了解 Telegram API;开发者提供了您所需的一切。 关键特性 能够自定义发送给订阅者的订单详情 您可以创建分层的订阅模型,例如铜、银、金。其中金订阅获得所有信号等。 通过 id、符号或评论过滤订单 包括执行订单的图表截图 在发送的截图上绘制已关闭的订单,以便额外核实 延迟发送新订单消息的可能性,以便在发送前对位置进行调整 订单详情完全透明: 新的市场订单*带截图 订单修改(止损、获利) 已关闭的订单*带截图 部分关闭的订单** 新的挂单 修改的挂单(进场价格) 挂单激活(作为新的市场订单附加) 已删除的挂单 历史订单报告
RETAILBERG FOOTPRINT CHART PRO — Order-Flow Workspace for MetaTrader 5 Version 7.00  |  Professional System  |  31 tools  |  One chart A full 150-page illustrated User Manual is included. Please read the full manual to understand this feature packed footprint chart elements and ui. https://www.mql5.com/en/blogs/post/777982 DEMO / STRATEGY TESTER — PLEASE READ FIRST
Trader Evolution
Siarhei Vashchylka
5 (7)
" Trader Evolution " - A utility designed for traders who use wave and technical analysis in their work. One tab of the utility is capable of money management and opening orders, and the other can help in making Elliott wave and technical analysis. Manual (Be sure to read before purchasing) | Version for MT4 Advantages 1. Trading in a few clicks. Immediate and pending orders are available in the panel 2. Money management. The program automatically selects the appropriate lot size 3. Simplifies
DrawDown Limiter
Haidar Lionel Haj Ali
5 (23)
DrawDown Limiter v5.0 — 高级账户保护控制器 DrawDown Limiter v5.0 是一款运行于客户端的交易账户保护控制器,用于监控您的交易账户,并在达到您所设定的风险、盈利、新闻、时间计划、Rollover 或持仓数量限制时自动采取相应措施。 它可以通过一个独立图表监控 手动交易、自动化策略、多个 EA、挂单以及浮动持仓 。它既可以保护整个交易账户,也可以通过 Magic Number 仅监控特定 EA 或一组 EA。 DrawDown Limiter 的目的不仅仅是显示回撤,而是 主动执行您设定的交易规则 ,并在保护条件保持有效期间持续执行这些规则。 DrawDown Limiter v5.0 不仅用于监控您的亏损程度,还用于控制策略何时可以继续运行、哪些风险敞口可以保留、何时必须停止交易,以及自动化交易环境何时可以安全恢复运行。 需要帮助或有任何问题?  请查看   DrawDown Limiter 用户指南 我是  Lio ,欢迎随时联系我!  我们始终愿意为您解答问题、提供帮助并持续改进产品。 统一的保护系统 DrawDown Limiter v
图表交易助手与风险管理面板 功能全面的图表级交易工具:支持多模式止损(SL)和止盈(TP)(ATR、风险收益比R:R、点数、账户货币)、实时分析和财经日历 Ergotick Trade Manager 是一款专为主观交易员、自营挑战交易员和剥头皮交易员打造的多合一专业交易面板。它将瞬时自动手数计算、多模式止损止盈设置、高级一揽子订单(Basket)管理、实时账户统计以及集成的财经新闻日历融为一体,提供单一、清爽的 MetaTrader 5 交互界面。 告别手动计算仓位大小!在毫秒级内自动计算出精准手数,立即执行带风险管理的订单,并通过内置的每日亏损限制保护来捍卫您的资本安全。 核心功能 1. 交互式视觉工具与手数自动计算器 图表拖拽设置(Drag & Drop): 在入场交易前,直接在图表上拖放和调整入场线、止损(SL)、止盈(TP)、保本(BE)、移动止盈1(TP1)和移动止盈2(TP2)线条。 自动手数计算器: 根据您的 账户风险百分比(%) 或 固定美元风险($) 立即计算出精确的仓位大小;或者输入 固定手数 来自动反向计算您的美元风险。 内置风险计算与 ATR 仓位管理: 支持
Master Your Trading Discipline   Stop losing your hard-earned gains to overtrading and emotional decisions. The Discipline Tool is your ultimate trading assistant, ensuring strict risk management in real-time. Key Protection Features: Advanced Drawdown Defense : Automatically halts trading if your daily drawdown exceeds a preset threshold (percentage or dollar amount). Real-Time Equity Lock : Safeguard profits by referencing peak equity, ensuring drawdown stays within control. Hard Profit Target
PROFESSIONAL MULTI-ACCOUNT TRADE COPYING FOR METATRADER 5 Sentinel Master is a trade-publishing Expert Advisor designed to work together with Sentinel Follower , providing a reliable and configurable solution for copying trades between MetaTrader 5 accounts. The system is designed for traders who manage multiple accounts and want to replicate their trading activity without manually opening and closing positions on every account. Sentinel Master continuously monitors the source account and publis
Dealer's Panel No signal decides anything here — a hand does. One click, and the panel calculates what's underneath: lot size from risk, target from a 30-step balance ladder that remembers exactly how far an account has climbed. Toggle between market and pending without touching an input field. Set a stop, and the take-profit can write itself — a fixed share of the balance, translated into price with no arithmetic left for the trader to get wrong. One trade live at a time; it won't let a seco
My Chart Generator
Trade The Volume Waves Single Member P.C.
5 (1)
What if your chart adapted to the market instead of the clock?   THE PROBLEM IT SOLVES   Instead of trying to find the best indicator that fits your timeframe chart, build a chart and find the most appropriate indicator.   My Chart Generator is a MetaTrader 5 background service that builds  live, fully historical three types of custom charts :1. Range/Volume Balanced chart, 2.  Range/Volume Absorption chart and 3. Constant Volume chart from any symbol — Forex pairs, crypto, indices, commodities,
AlgoRadar
Stephen J Martret
5 (4)
AlgoRadar is an on-chart analytics dashboard for MT5 that aggregates Expert Advisor performance across multiple accounts, brokers, and platforms, including both MT4 and MT5 data, into a single live view on your MT5 chart. All analysis runs from the chart interface, with no external applications or manual report processing required. EA Analysis and Ranking For traders running multiple Expert Advisors, AlgoRadar provides a consolidated view of each EA's performance across accounts. Active EAs a
REVDEN AI Desk:依托 REVDEN 的市场背景,在与您自己的 AI 的一场对话中运作您的交易 设想一下,在一场对话中运作您的全部交易。 REVDEN AI Desk 将这一切带入 MetaTrader 5:您询问自己的 AI 如何解读市场,它依据 REVDEN 对您所交易品种的完整背景信息作答,包括这些品种的状态、风险画像和即将到来的数据发布。它的提案附带入场、止损、目标和风险,您批准合适的那些。您的规则也以同样的方式修改:写下需要改变的内容,您的 AI 就会为您起草新的规则手册,采用与否由您决定。围绕这场对话,整个市场呈现在同一个屏幕上。 查看交易台和设置指南。 每个界面、每项设置,以及与您自己的 AI 共同迈出的第一步: stein.investments/products/revden-ai-desk 与您的 AI 进行一场对话,用一个屏幕纵览市场,两者共享同一个数据基础。  用您自己的话: 就在图表旁边,询问市场、某个品种或某项提案。  依托 REVDEN 的背景信息: 您的 AI 读取您所选每个品种的状态、风险画像、即将到来的数据发布,以及您的持仓和您的规则手
MULTI-ACCOUNT TRADE COPYING WITH ADVANCED RISK MANAGEMENT Sentinel Follower is an automated trade-copying Expert Advisor for MetaTrader 5, designed to receive and execute trading positions published by Sentinel Master . The system allows traders to replicate trading activity across multiple accounts while maintaining independent control over position sizing, risk exposure, basket management, and trade execution. Unlike traditional trade copiers, Sentinel Follower includes additional risk-managem
PRO LOCAL TRADE COPIER MT5 — ALL-IN-ONE MASTER & SLAVE EDITION ============================================================== Pro Local Trade Copier MT5 is an institutional-grade, ultra-low-latency trade duplication utility engineered for professional traders, prop firm challenge traders, and multi-account managers operating on the same PC or Windows VPS. Unlike traditional copiers that require separate Master and Slave files or complex external DLL configurations, Pro Local Trade Copier MT5
EasyInsight AIO MT5
Alain Verleyen
4.92 (12)
EASY Insight AIO – 全能智能交易一站式解决方案 概述 想象一下,您可以在几秒钟内扫描整个市场——外汇、黄金、加密货币、指数,甚至股票——无需手动筛选图表、繁琐安装或配置指标。 EASY Insight AIO 是您专为 AI 交易打造的即装即用数据导出工具。它将整个市场快照一次性输出为简洁的 CSV 文件,直接支持 ChatGPT、Claude、Gemini、Perplexity 等各类 AI 平台的即时分析。 无需窗口切换,无需图表叠加,也没有任何杂乱。只需纯净、结构化的数据自动导出,让您专注于基于数据的高效决策,无需再盯盘耗时。 为什么选择 EASY Insight AIO? 真正的一体化 • 无需设置,无需安装指标,无图表叠加。只需安装、运行并导出——就是这么简单。 多资产全覆盖 • 扫描分析外汇、金属、加密货币、指数、股票——您的券商所能提供的一切市场。 AI 专属数据导出 • 高度结构化、针对 AI 优化的 CSV 文件,直接适配主流智能工具和平台。 完整导出内容: • 三个可选周期的货币强度分析 • 净多头头寸变化体现市场情绪 • 成交量变化、
作者的更多信息
Candle Smart Range
Gianny Alexander Lugo Sanchez
5 (1)
Candle Smart Range (CSR) MetaTrader 5 指标 Candle Smart Range 是一款用于自动识别多时段价格区间的技术指标。该工具基于蜡烛形态以及价格与先前高低点的交互来分析市场结构。 主要功能: 区间检测: 自动识别脉冲行情前的盘整区域。 虚假突破识别: 根据蜡烛收盘标准,标记价格突破先前水平但收于区间内的情况。 多时段分析: 在单个图表上显示多达 19 个不同时段的数据,包括自定义周期。 内部可视化(缩放): 无需切换图表即可查看高级别蜡烛或区间内部的价格走势。 时间过滤器: 可设置在特定时间段(如主要市场交易时段)运行。 历史回顾模式: 逐步浏览历史数据,分析指标在不同市场条件下的表现。 警报系统: 针对蜡烛收盘和新区间检测的可配置通知。 界面: 包含用于管理视觉负载的屏幕按钮和可调配色方案。 免责声明: 本工具仅用于视觉分析,不保证财务结果。历史表现不代表未来收益。
HFT Candle Plus
Gianny Alexander Lugo Sanchez
HTF Candle Plus — Higher Timeframe Candles on Chart Background HTF Candle Plus is an advanced visualization indicator for MetaTrader 5 that overlays higher timeframe candles directly onto the background of the active chart. With up to 19 independently configurable timeframe slots, an interactive button panel, and native support for 24/7 markets and session-aware candle clipping in the style of TradingView, this indicator transforms any chart into a complete multi-timeframe analysis environment.
Backtest Studio
Gianny Alexander Lugo Sanchez
Backtet Studio It is a training and manual back-testing tool. It does NOT send real orders to your broker. Lets you go back to any date in a symbol's history and replay the market candle by candle (with simulated ticks inside each candle) while you practice manual trading on a virtual account.  HOW IT WORKS 1. Attach the EA to a chart of the real symbol (for example EURUSD). 2. Choose a start date and time with the built-in calendar and time picker and press Start Replay. 3. The EA build
筛选:
无评论
回复评论