Channel Global Multicurrency
- 指标
- 版本: 1.24
- 更新: 24 七月 2024
- 激活: 7

Description
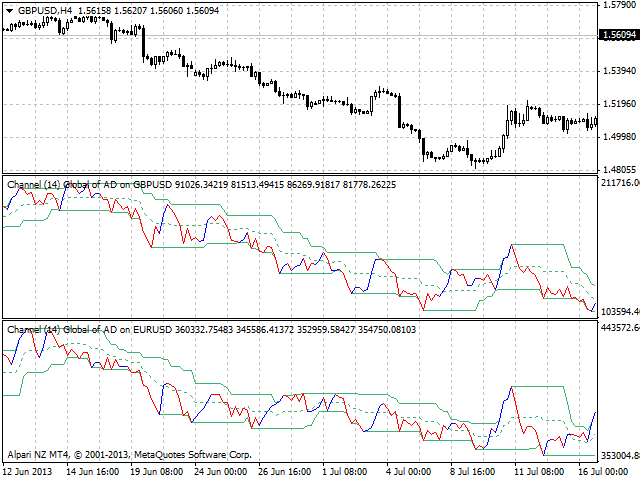
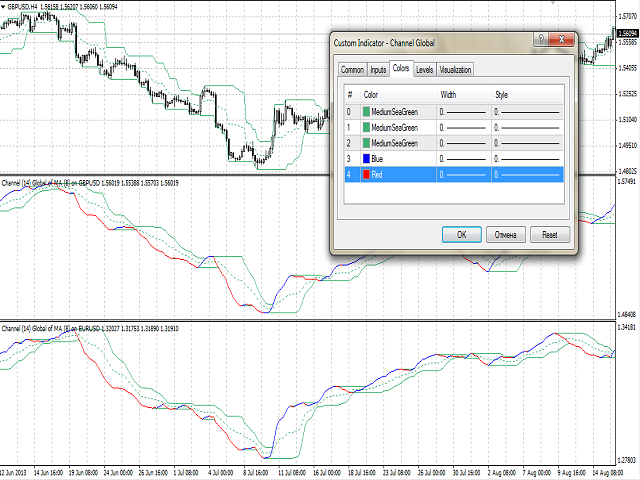
A colored universal multicurrency/multi-symbol indicator Channel to be drawn in a separate window below the main financial instrument. The indicator uses the calculation method of the Price Channel indicator. The rising and falling line of the main indicator and the Channel lines can be colored.
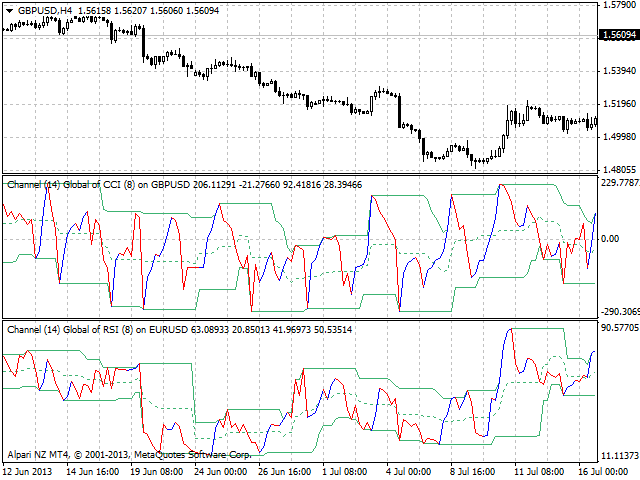
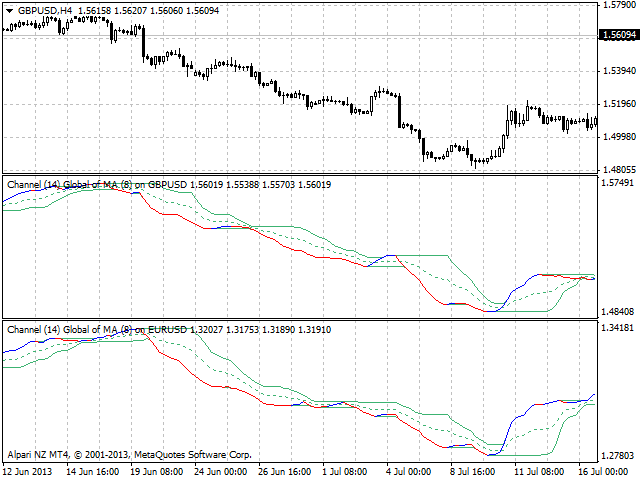
The indicator can be calculated based on one of the eleven basic indicators included in the standard package of the MetaTrader 4 terminal:
- AD - an indicator of accumulation and distribution of volume.
- OBV - On Balance Volume.
- Force - Force Index indicator.
- MFI - Money Flow Index.
- ATR - Average True Range.
- Momentum.
- Moving Average.
- CCI - Commodity Channel Index.
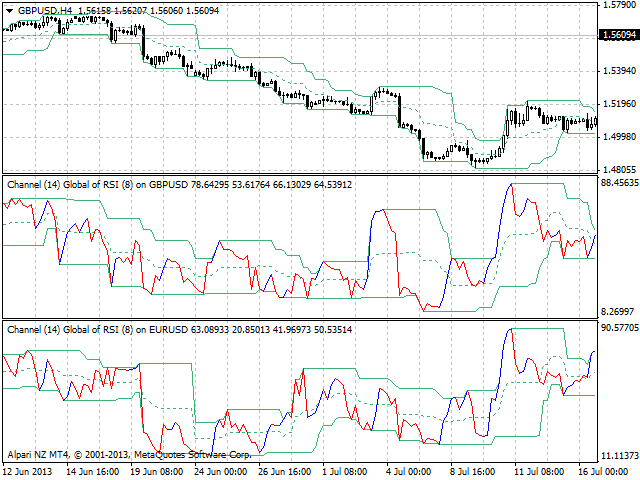
- RSI - Relative Strength Index.
- ADX - Average Directional Movement indicator.
- DeMarker.
- Standard Deviation.
The default indicator is AD - an indicator of accumulation and distribution of volume.
Purpose
The indicator can be used for manual or automated trading in an Expert Advisor. Values of indicator buffer of the double type can be used for automated trading:
- The middle line of the Channel - buffer 2.
- The upper line of the Channel - buffer 0.
- The lower line of the Channel - buffer 1.
- The bullish line of the basic indicator - buffer 3, must not be equal to zero.
- The bearish line of the basic indicator - buffer 4, must not be equal to zero.
- The main line of the basic indicator - buffer 5.
For a more in-depth analysis the indicator can be used in combination with the Price Channel indicator of the main chart.
Inputs
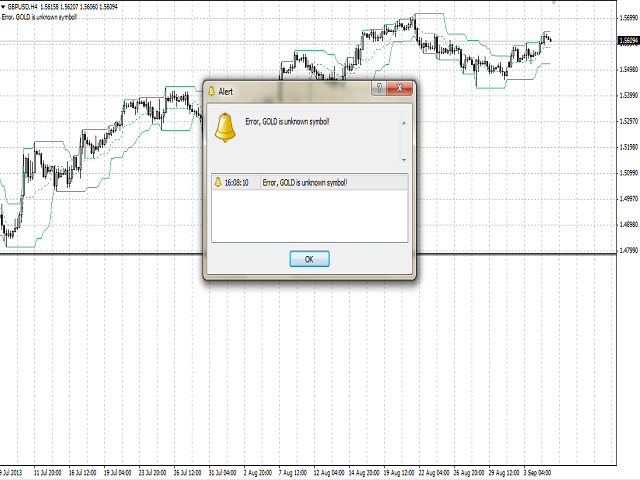
- Currency_Name - the name of the financial instrument.
- Calc_Method - the indicator, based on which the Channel will be calculated.
- Channel_Period - Channel calculation period.
- Periods - the period for calculating the basic indicator, based on which Channel will be calculated.
- MA_Method - averaging method for the MA of the basic indicator.
- Applied_Price - the used price of the basic indicator.
- Mode - the index of the line (MAIN or SIGNAL) of the basic indicator, based on which Channel will be calculated.
- Shift - the sift of the basic and calculation indicator relative to the price chart.