Gold moving averages flow a

【黄金均线流二号 · 黄金 M5 实盘验证版】

一套参数,从小资金到大资金全兼容

为什么选它?

  • 一套参数,全周期回测,完整穿越疫情、俄乌、加息与黄金大牛市,不是只挑好日子做出来的"漂亮曲线"。
  • 多周期均线流 + 五重方向确认:让整族均线告诉你钱往哪流——顺势时果断吃大波段,震荡时小盈累积、轻仓不伤本金。
  • 动态仓位 + 五级梯度止盈 + 移动止损:利润自动分阶段落袋,越涨越会保护浮盈;逆势补仓逻辑摊低成本,为反转留足弹药。
  • 全程"真金白银"级验证:逐 Tick 实时点最严格回测,同时兼容"仅开价 / 1 分钟 OHLC / 每次报价 / 实时点"四种模式交叉复测、结果一致,杜绝未来函数与信号偷看。
  • 到手即用,不是测试残次品。

兼容所有账户类型,资金多小都能上车

纠结"我没有大本金,EA 是不是给大资金设计的"?完全不用担心——这套 EA 从 20 美元的小微账户到标准账户通吃,只需改一个参数  InpAccountScale ,其余策略逻辑完全一致:

账户类型 1 手合约 最小手数 建议初始入金 参数设置
微型账户(★随包默认) 1,000 0.1 手 200 USD InpAccountScale = 10
微型账户(小资金首选) 1,000 0.01 手 20 USD InpAccountScale = 1
标准账户(大资金进阶) 100,000 0.01 手 2,000 USD InpAccountScale = 100

★ 随包默认配置 =  InpAccountScale 10  + 初始入金 200 USD

使用方法(3 步)

  1. 将 EA 放入 MT5 的  Experts  目录;
  2. 打开 GOLDm#(微型黄金)或者GOLD#(标准黄金)或者XAUUSD(标准黄金)、M5 周期 图表,把 EA 拖入图表;
  3. 按上表把  InpAccountScale  设为你的账户档位,其余参数已全部预调好,点确定即可。建议先用模拟盘观察,再上小资金实盘。

售后与进阶

  • 购买后如需更多优化配置,可联系作者免费获取
  • 当然,你也可以用 MT5 策略优化器自行回测打磨,说不定下一个"极品配置"就是你自己挖出来的。

新发 7 折优惠,满 10 个后恢复原价。

历史回测业绩不构成未来收益承诺,投资有风险,请合理配置仓位。


作者的更多信息
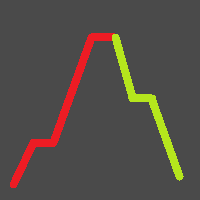
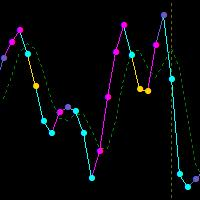
根据高开低收价格确定反转点位,画出的极点折线。 The pole polyline is drawn according to the high opening and low closing price to determine the reversal point. 参数(Args): 1.周期数(Period)。参与界限计算的K柱数量。 2.界限(Divide)。计算方式包括:         t1,顺高低价 (Buy min H,Sell max L)           t2,逆高低价 (Buy min L,Sell max H)           t3,收盘价 (Buy min C,Sell max C)           t4,开盘价 (Buy min O,Sell max O)           t5,高开低收价的一半 (HOLC/2)           t6,高开低收价的一半+1 (HOLC/2+1)           t7,高开低收价的一半+2 (HOLC/2+2) 3.跨越界限使用的价格(Price)。包括收盘价(C)和高低价(HL) 4.偏移(Of
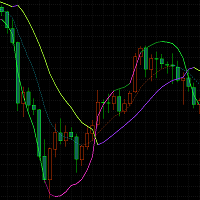
A cross - track indicator that visually shows the current bullish/bearish trend of the market through the midline (mid track), main line (upper track), and sub-lines (lower track). Intersections or upper rail turns can be used as buying and selling positions. Parameter description: period:10 price: WEIGHTED //HIGH //LOW //OPEN //CLOSE //MEDIAN //TYPICAL //AVERAGE //WEIGHTED method:Linear weighted //Simple //Exponential //Smoothed // Linear weighted main offset:1.5 sub offset:1 base:2 counts add
UDWay
Xiong Luo
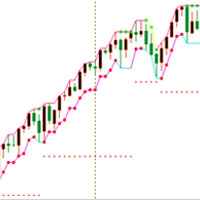
K线极点轨道UD 【input 参数】 InpMyMagic: 幻数 InpShowPanel: 是否展示面板 InpOneLot: 开单量1份[最大99.99](=0最小手,>0固定手,<0>=-1净亏比,<-1净余最小亏比) InpAllLot: 总净单量,100%(=0最小手,>0固定手,<0>=-1净亏比,<-1净余最小亏比) InpLotMaxMoney: 开单量计算的最大金额(=0不管,>0超过该值即限制为该值,<0超过整数值即限制为小数倍数) InpLot1Dot1Money: 开单1手变化1点时金额变化值。(<=0自动计算(美元),>0指定) InpDotBig: 大间隔点值(>=0点值,<1三位数点差均,<0整均比) InpDotSml: 小间隔点值(>=0点值,<1三位数点差均,<0整均比) ==========   UD   ========== InpUDType: 类型(=0不开,=1常规,=4偏极,=6平台,=8慢跟,=10超前,=12跟随) InpMinWidth: 上下轨宽度最小值(>=0点值,<1三位数点差均,<0整均比) InpHTurnThr
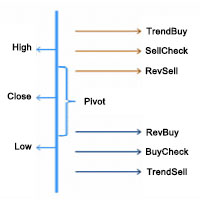
策略的基本原理 根据前一个交易日的收盘价、最高价和最低价数据通过一定方式计算出六个价位,从大到小依次为:突破买入价、观察卖出价、反转卖出价、反转买入、观察买入价、突破卖出价。以此来形成当前交易日盘中交易的触发条件。 追踪盘中价格走势,实时判断触发条件。具体条件如下: 突破 在空仓条件下,如果盘中价格超过突破买入价,则采取趋势策略,即在该点位开仓做多。 在空仓条件下,如果盘中价格跌破突破卖出价,则采取趋势策略,即在该点位开仓做空。 反转 持多单,当日内最高价超过观察卖出价后,盘中价格出现回落,且进一步跌破反转卖出价构成的支撑线时,采取反转策略,即在该点位反手做空。 持空单,当日内最低价低于观察买入价后,盘中价格出现反弹,且进一步超过反转买入价构成的阻力线时,采取反转策略,即在该点位反手做多。 设定止损条件。当亏损达到设定值后,平仓。 设定是否隔夜留仓。
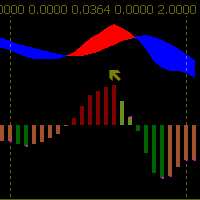
Type(1EMA,2DEMA,3TEMA) FastPeriod SlowPeriod SignalPeriod PriceApplied ( HIGH(H) LOW(L) OPEN(O) CLOSE(C) MEDIAN(HL) TYPICAL(HLC) WEIGHTED(HLCC) ) Deviate Up Deviate Down Deviate Bar What Is Moving Average Convergence/Divergence (MACD)? Moving average convergence/divergence (MACD, or MAC-D) is a   trend-following   momentum   indicator that shows the relationship between two   exponential moving averages (EMAs)   of a   security’s   price. The MACD line is calculated by subtracting the 26-peri
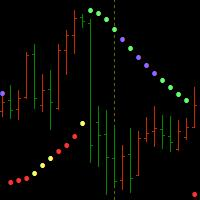
The parabolic SAR indicator, developed by J. Welles Wilder Jr., is used by traders to determine trend direction and potential reversals in price. The technical indicator uses a trailing stop and reverse method called "SAR," or stop and reverse, to identify suitable exit and entry points.  The parabolic SAR indicator appears on a chart as a series of dots, either above or below an asset's price, depending on the direction the price is moving. A dot is placed below the price when it is trending u
What Is the Relative Vigor Index? The Relative Vigor Index (RVI) is a   momentum indicator   used in technical analysis that measures the strength of a trend by comparing a security's closing price to its trading range while smoothing the results using a   simple moving average   (SMA). The RVI's usefulness is based on the observed tendency for prices to close higher than they open during uptrends, and to close lower than they open in downtrends. KEY TAKEAWAYS The Relative Vigor Index (RVI) is a
筛选:
无评论
回复评论