Volume Price Efficiency

# Volume Price Efficiency - Lo spessore del mercato

*Categoria: Volume | Difficolta: intermedio | Finestra: finestra separata sotto il grafico | Mercati: Universale (Forex, indici, materie prime, crypto, azioni) | Timeframe consigliati: M5, M15, M30, H1, H4*

## Descrizione breve

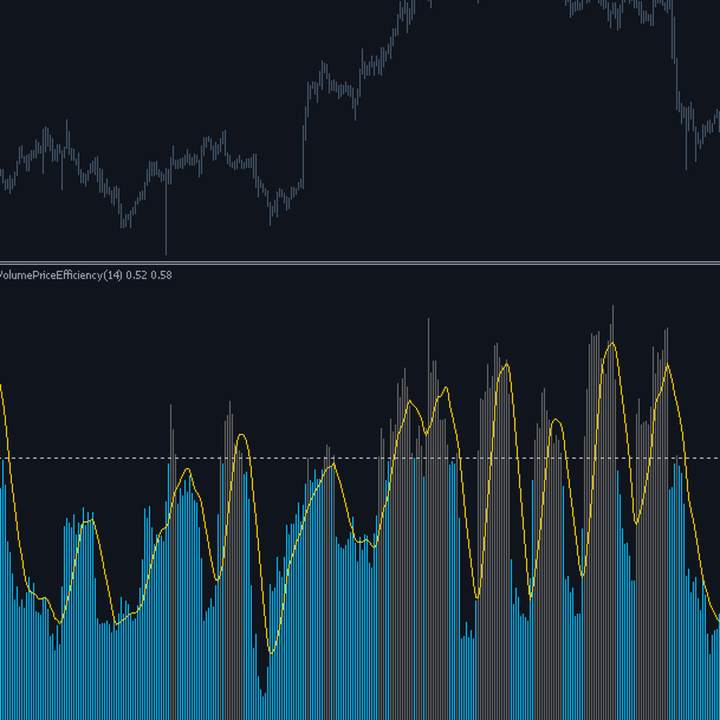
> Misura quanto prezzo viene spostato da una unita di volume. Valori alti indicano un mercato sottile, in cui pochi ordini muovono molto; valori bassi indicano assorbimento.

### Panoramica

Quanto prezzo serve per assorbire una unita di volume? La risposta descrive lo spessore del mercato meglio di qualunque misura di volume presa da sola. Se il prezzo si muove molto con poco volume il mercato e sottile: pochi ordini bastano a spostarlo, i movimenti sono fragili e i ritorni indietro frequenti. Se il prezzo si muove poco nonostante un volume elevato il mercato e spesso: c'e qualcuno che assorbe, le posizioni si costruiscono senza spostare il prezzo e i movimenti successivi tendono a essere piu solidi. Entrambe le grandezze sono normalizzate, il movimento sull'ATR e il volume sulla propria media, quindi il risultato e un numero puro che vale la stessa cosa su qualunque strumento e timeframe: il valore uno indica che quella barra ha mosso il prezzo esattamente quanto ci si aspetterebbe dal suo volume.

### Come funziona il calcolo

1. Il movimento di ogni barra e la variazione assoluta di chiusura, divisa per l'ATR su InpAtrPeriod barre.
2. Il volume della barra viene diviso per la propria media su InpVolPeriod barre, ottenendo un volume relativo adimensionale.
3. Il volume relativo ha un minimo imposto, per evitare divisioni per valori prossimi allo zero nelle sessioni ferme.
4. L'impatto della singola barra e il rapporto fra le due grandezze normalizzate.
5. L'istogramma mostra la media dell'impatto su InpPeriod barre, perche una barra sola e troppo rumorosa per descrivere lo spessore.
6. Se il volume reale non e disponibile l'indicatore ricade automaticamente sul volume a tick.

### Come si usa

- Valori in zona rossa indicano un mercato sottile: le rotture sono poco affidabili e conviene ridurre la dimensione delle posizioni.
- Valori in zona azzurra indicano assorbimento: molto volume che non muove il prezzo, spesso il preludio di un movimento importante.
- Un calo improvviso dell'impatto durante un trend segnala che qualcuno sta iniziando a prendere l'altro lato.
- Usarlo come filtro prima di operare le rotture: una rottura in mercato sottile ha probabilita molto piu alta di rientrare.
- Nelle sessioni di bassa liquidita, come le ore notturne, l'impatto sale strutturalmente: e informazione corretta, non un errore.

### A chi e rivolto e su quali timeframe

E rivolto a chi opera sulle rotture e ha bisogno di sapere quanto solido sia il mercato prima di entrare, e a chi studia il comportamento della liquidita intraday. Da il meglio da M5 a H1, dove le variazioni di volume fra barre sono ampie e informative. Su timeframe alti il volume relativo varia meno e l'indicatore diventa meno discriminante. Funziona in modo particolarmente pulito su futures e azioni, dove il volume e un dato reale; sul forex il volume a tick e una approssimazione ma resta comunque utilizzabile.

### Esempio pratico di lettura del segnale

Su DAX40 M15 l'impatto scende a 0.45 e l'istogramma diventa azzurro: nelle ultime quattordici barre e passato molto volume ma il prezzo si e mosso pochissimo. Qualcuno sta assorbendo. Il trader non entra ma resta in osservazione. Due ore dopo il prezzo rompe il massimo del range e l'impatto risale a 1.1: il volume ora produce movimento, l'assorbimento e finito e chi aveva costruito la posizione la sta portando a casa. La rottura viene operata. Se invece l'impatto fosse stato a 1.9 al momento della rottura, in zona rossa, la stessa rottura sarebbe avvenuta in mercato sottile e sarebbe stata da evitare.

## Elenco parametri di input

| Parametro | Default | Descrizione |
|---|---|---|
| `InpPeriod` | 14 | Barre su cui mediare l'impatto. Finestre corte reagiscono in fretta ma producono un istogramma molto mosso. |
| `InpAtrPeriod` | 30 | Periodo ATR che normalizza il movimento, rendendolo confrontabile fra strumenti diversi. |
| `InpVolPeriod` | 50 | Finestra della media di volume che definisce cosa sia un volume normale per questo strumento. |
| `InpSignalPeriod` | 9 | Periodo della media di segnale sovrapposta all'istogramma. |
| `InpThinLevel` | 1.60 | Impatto oltre cui il mercato viene considerato sottile e l'istogramma colorato di rosso. |
| `InpThickLevel` | 0.60 | Impatto sotto cui il mercato viene considerato assorbente. Se le soglie sono incoerenti, l'indicatore le separa automaticamente. |
| `InpUseRealVolume` | false | Con true si usa il volume reale se disponibile; con false, o in sua assenza, il volume a tick. |

## Vantaggi / punti di forza

- Misura una proprieta strutturale del mercato, lo spessore, che nessun indicatore di volume grezzo puo esprimere.
- Doppia normalizzazione: il valore uno ha lo stesso significato su qualunque strumento e timeframe.
- Ha un uso diretto come filtro sulle rotture, dove distingue le condizioni favorevoli da quelle rischiose.
- Ricaduta automatica sul volume a tick quando quello reale manca: funziona su qualunque broker.

## Limitazioni e avvertenze

- Sul forex il volume a tick e una approssimazione del volume reale e varia da broker a broker.
- Usa la variazione di chiusura e non il range: una barra con lunghe ombre e chiusura ferma risulta a basso movimento anche se ha percorso molta strada.
- Nelle ore di bassissima liquidita il rapporto diventa instabile nonostante il minimo imposto sul volume relativo.
- Le due soglie sono valori empirici che vanno verificati sul proprio strumento prima di essere usati come filtro.

**Nessun repaint:** i valori pubblicati su una barra chiusa non vengono piu modificati.

**Disclaimer.** Questo prodotto e uno strumento di analisi tecnica, non un sistema di trading automatico, e non fornisce alcuna garanzia di profitto. I mercati finanziari comportano il rischio di perdita totale del capitale investito. Le performance passate non sono indicative dei risultati futuri. Ogni segnale prodotto va sempre confermato con la propria analisi, un piano di money management e un test preventivo su conto demo. L'autore non e responsabile di decisioni operative prese sulla base di questo indicatore.

## Tag / parole chiave suggerite per MQL5

`volume`, `liquidity`, `market depth`, `absorption`, `breakout filter`, `efficiency`, `no repaint`, `atr`
推荐产品
概述 使用 Anchored Volume Profile 体验专业级的订单流分析。这是一款专为 MetaTrader 5 设计的超轻量、高性能交易量分布指标。该指标完全基于底层内存画布(Canvas)机制构建,彻底消除了传统矩形对象属性(rectangle-object profiles)常见的 CPU 延迟、界面闪烁和图表卡顿问题。 通过将终端的原生跳动量(Tick Volume)处理为方向性矩阵,该工具提供了视觉效果极佳、像素级完美的市场拍卖结构布局,让您能够以绝对的精度精准锁定机构支撑位、阻力位和关键流动性池。 核心专业功能: 画布引擎(Canvas Engine): 将整个分布图阵列直接绘制在平面的屏幕空间内存位图上。布局在出现新 Tick 时的单个线程周期内立即更新,完全消除了屏幕延迟。 方向性多空 Tick 分离: 动态扫描日内订单数据,将总 Tick 交易量分为买入(Up-Bar)和卖出(Down-Bar)组件,深入洞察历史平衡与控制权。 无缝左右布局切换: 瞬间将指标位置从左侧切换到右侧。数学算法动态处理像素边距,确保在宽屏显示器和多图表网格上实现完美的几何对称。
FREE
Neon Profile
Manuel Fernandez Barranco
XBK Neon Profile MT5 Developed by XBK Systems. XBK Neon Profile is an advanced technical indicator for MetaTrader 5 that combines smoothed trend analysis and a dynamic volume profile within a single chart window. The indicator is designed to provide a clear view of market structure and significant volume levels without cluttering the screen. Key Features Smoothed Trend Bands (Neon Trend Bands) Identifies the current trend direction using a custom smoothing algorithm designed to filter out market
FREE
Blahtech VWAP MT5
Blahtech Limited
5 (1)
Blahtech VWAP - Volume Weighted Average Price (VWAP) is the ratio of price to total volume. It provides an average price over a specified time interval.  Links [  Install  |  Update  |  Documentation   ] Feature Highlights Configurable VWAP Line Sessions, intervals, anchored or continuous Previous day settlement line Standard Deviation bands Alerts at bar close or real time Automatic Broker or Tick volumes Significantly reduced CPU usage Input Parameters Expert Advisor Mode  - Reserved for iCu
FREE
Advanced Volume Profile
Henry Armando Baltazar
Advanced Volume Profile Liquidity Analysis via Custom Area Selection The Advanced Manual Volume Profile is a precision tool for MetaTrader 5 designed to deconstruct market structure through price-level volume analysis. Unlike static profiles, this indicator exclusively processes the price and time range defined by the user via a rectangle object, offering a surgical view of the market auction. Elite Technical Specifications Dynamic Algorithm: Real-time calculation (400ms refresh rate) based on t
FREE
Proton Candle Time MT5 OVERVIEW Proton Candle Time MT5 is an indicator for MetaTrader 5 that displays a real-time countdown timer showing the number of seconds remaining in the current candle. The indicator updates continuously as the candle develops and resets when a new candle opens. This tool is designed for traders who need precise timing information while analyzing price action. PRIMARY FUNCTION The indicator displays the active candle countdown timer directly on the chart. The timer show
FREE
Heiken Ashi Stacked Pro is a chart overlay indicator that combines smooth Heiken Ashi visual trend candles, a real-time bar completion timer, and an on-hover crosshair HUD for instant price and wick-to-body ratio diagnostics. Marketplace Description Overview Heiken Ashi Stacked Pro upgrades standard Heiken Ashi candle visuals with an interactive HUD. Designed for trend followers and price action traders, it filters out market noise using colored candles while supplying precise candle metric read
VP hidden
Emr Aljnaby
4.33 (12)
The indicator works to convert normal volume into levels and determine financial liquidity control points. It is very similar in function to Fixed Volume Profile. But it is considered more accurate and easier to use than the one found on Trading View because it calculates the full trading volumes in each candle and in all the brokers present in MetaTrade, unlike what is found in Trading View, as it only measures the broker’s displayed prices. To follow us on social media platforms: telegram
FREE
Advance Demand and Supply
Oyinemomoemi Emeledor
5 (1)
This   Demand & Supply Zone Indicator with Volume Filtering   is a technical analysis tool for MetaTrader that identifies key price zones where buying (demand) or selling (supply) pressure is concentrated. It uses fractals, volume analysis, and price action to detect and highlight these zones on the chart. Key Features: Zone Detection Based on Fractals Identifies demand (support) and supply (resistance) zones using   fractal patterns   (local highs/lows). Zones are formed from   open prices   ar
FREE
VWAP Personnal Custom
Vincent Jose Proenca
VWAP_PC_MQL5 — 一个简单的自制 VWAP 类指标,在 MT5 图表上实时显示成交量加权平均价。 时间框架: 适用于所有周期。 品种: 兼容外汇、指数、大宗商品和股票。 参数: AppliedPrice – 用于计算的价格类型(收盘价、典型价、加权价等) LineColor / Width / Style – 线条样式设置 SessionReset – 可每日重置或连续模式 工作原理(VWAP 原理): VWAP(成交量加权平均价)计算公式为: VWAP = (价格 × 成交量之和) / (成交量之和) 它反映买卖双方的动态平衡: 价格 高于 VWAP → 多头占优; 价格 低于 VWAP → 空头占优。 简短结论: VWAP_PC_MQL5 是一个轻量级的 VWAP 工具,结构简单但实用,帮助学习和分析成交量行为。
FREE
Market Hours Pro
Musa Terrance Khosa
Market Hours Pro shows Tokyo, London, and New York trading sessions directly on your MT5 chart, including scheduled overlap periods. It’s designed to give you a clear view of global market timing so you can plan trades, spot high-activity periods, and align strategies with standard Forex hours. How It Works Displays scheduled session times visually on your chart. Highlights session overlaps for London/New York and Tokyo/London. Automatically adjusts times for your timezone or broker time. Shows
FREE
BBOscillator
Shi Yuan Wang
BBOscillator —— 带 ATR 止损位的彩色蜡烛趋势状态指标 产品概览 BBOscillator 是一款绘制在价格图表主窗口的 MT5 技术指标。它把"安第斯振荡器"(Andean Oscillator)的方向状态判断、蜡烛着色、动态 ATR 止损位以及转折信号标记整合在同一张图表上,用一套统一的视觉语言呈现当前的市场状态:方向是否明确、偏向哪一侧、以及在该状态下可以把止损参考放在什么位置。 指标不打开、不关闭、不修改任何订单,也不连接任何外部服务。它只负责把价格状态以更直观的方式显示出来,所有的交易决策仍由使用者自行做出。 主要功能 蜡烛三色重绘。指标的蜡烛按方向状态显示为绿色、红色或灰色,替代终端原有的蜡烛配色,使方向变化在图上一目了然。 方向状态判定。基于安第斯振荡器的算法,对收盘价的一阶与二阶统计量做递归平滑,比较看涨分量与看跌分量的相对强度,再与信号线比较,得出三态结论。 动态 ATR 止损线。在每根 K 线的上方与下方各绘制一条止损参考线,距离由当时的 ATR 值与用户设定的倍数共同决定,随波动率自动放宽或收紧。 转折信号箭头。当状态由"方向不明"首次转为明确方
FREE
Bohemia Gold MT5
Vladislav Taska
4.8 (5)
Bohemia Gold MT5 is  Trend & Volatility EA trading system designed specifically for Gold (XAUUSD) . It combines higher-timeframe trend filtering , trend detection , volatility-based SL management , and advanced trade management to adapt market conditions. It uses style logic focused on trend strength, volatility, and capital protection. NOTE:   Based on backtests, I found better trading results with the following setup: D1/H4/H2 (Trend/ADX/ATR & trade). The SET file can be downloaded here … bohe
FREE
Value Chart Candlesticks
Flavio Javier Jarabeck
4.57 (14)
The idea of a Value Chart indicator was presented in the very good book I read back in 2020 , " Dynamic Trading Indicators: Winning with Value Charts and Price Action Profile ", from the authors Mark Helweg and David Stendahl. The idea is simple and the result is pure genius: Present candlestick Price analysis in a detrended way! HOW TO READ THIS INDICATOR Look for Overbought and Oversold levels. Of course, you will need to test the settings a lot to find the "correct" one for your approach. It
FREE
Auto Levels Pro
Oleksandr Sheyko
AutoLevelsPro —— 一个智能指标,用于自动标记 支撑与阻力区间 。 它专为 低周期图表 设计,最佳应用在 15分钟图表 上,能够快速捕捉市场的关键反应点。 使用的数据: High —— 每根K线的最高价 Low —— 每根K线的最低价 Close —— 用于ATR计算 时间戳 —— 精确定位区间在图表上的位置 ️ 分析流程: 识别局部高点 (swing high) 与低点 (swing low) 通过ATR计算市场波动率,决定区间宽度 将相近的水平合并为统一的区间 过滤掉弱势水平,仅显示达到最少触碰次数的区间 数据来源: 当前应用的图表(遵循所选时间周期) MetaTrader内置的ATR指标(周期随时间框架动态调整) 结果解读: 绿色区间 = 支撑 (Support) 红色区间 = 阻力 (Resistance) 区间内的数字 = 触碰次数(次数越多,水平越强) 区间宽度 = 市场波动率(越宽代表波动越大) 完全适应不同的时间周期与市场环境。 适用于 外汇交易 以
ATR for Level Trading
Oleksandr Nekrylov
3 (4)
Custom ATR Indicator for Horizontal Levels Trading The   Custom ATR Indicator   is a powerful tool designed for traders who rely on horizontal levels and understand the importance of the Average True Range (ATR) in making informed trading decisions. This indicator calculates the ATR based on a customizable number of bars, filters out abnormal bars (too large or too small), and provides clear visualizations of key data, including ATR values, Stop Loss levels, and price movement percentages. Key F
FREE
Price Volume Trend (PVT) Oscillator Description:  The PVT Oscillator is a volume indicator that serves as an alternative to the standard On-Balance Volume (OBV). While ordinary volume indicators can be noisy and hard to read, this tool converts volume flow into a clear Histogram Oscillator, similar to a MACD, but for Volume. It is designed to detect first  Trend Reversals and Divergences by analyzing the difference between a Fast and Slow PVT moving average. Why is this better than standard OBV?
FREE
Fixed Volume Profile
Carlos Pascual Perez Maturano
This indicator, titled "Fixed Volume Profile.mq5", is a custom tool for MetaTrader 5 (MQL5) designed to calculate and display a Volume Profile over a user-defined fixed time range. The Volume Profile shows the distribution of trading volume at different price levels during a specific period, helping to identify areas of high activity (such as Points of Control or POCs) and volume-based support/resistance areas. Main Functionality: Interactive Range: The indicator creates two vertical lines on
FREE
ConsistencyGuard
Vanessa Cristina Ribeiro Dos Anjos
版本 7.04 重大更新,重点加强日内交易纪律和账户保护。 • Post-Session Review(交易后复盘)模式,复盘时间可设置为 0 至 60 分钟。 • 完成当天允许的交易次数后,交易者可以保持 MetaTrader 5 开启,用于查看图表、截图以及填写交易日志。 • 达到每日交易次数限制后,如果尝试进行新的交易,将触发 Emergency Close(紧急平仓)保护。 • Emergency Close 会关闭未平仓头寸并取消挂单,然后锁定交易时段并关闭 MetaTrader 5。 • 持久化每日锁定机制可防止交易者在严重违规后重新打开 MetaTrader 5 继续交易。 • 最大授权交易手数保护。 • 最大交易手数提高后将锁定 7 天。在此期间仍允许使用更小的交易手数。 • 改进交易次数统计。 • 部分平仓不会被计算为新的交易。 • 面板实时显示 Realized P/L(已实现盈亏)和 Floating P/L(浮动盈亏)。 • 改进连续止损统计。 • 图表面板更加紧凑、简洁。 • 每日交易次数直接显示在图表上。 • 改进 MetaTrader 5 重启后的交易规则
FREE
ZoneCore MT5
Frederic Jacques Collomb
ZONECORE — Volume Profile & Pivot Levels 以外科手术般的精准度识别成交量最集中的价格区域。 MT4 version 什么是 ZONECORE? ZONECORE 是一款专业级指标,将 成交量分布(Volume Profile) 与 高成交量枢轴位(Pivot Levels) 相结合,揭示市场停留时间最长、成交量最大的价格区域。这些区域对价格具有强大的吸引力——掌握它们,让您在识别支撑位、阻力位及高概率反转区域时占据决定性优势。 3 个独立计算模式 ZONECORE 提供三个完全独立的模式,可同时启用: Period 模式 — 基于可配置的 K 线数量(默认 200 根)计算成交量分布。非常适合波段交易和日内分析。 Daily 模式 — 基于当前交易时段计算,支持自定义开始和结束时间。专为在特定市场窗口内操作的日内交易者设计。 Previous Day 模式 — 计算前一交易日(D-1)的成交量分布,并以虚线延伸至当日。对于识别昨日至今仍有效的关键价位不可或缺。 每个模式均拥有独立的配色方案,完全可自定义。 显示的关键价位 POC(控制点) —
Rainbow Volume Profile A simple, lightweight volume profile indicator that visualizes price-range volume with color-coded POCs (Points of Control). Overview RainbowVolumeProfile04Simple.mq5 calculates and displays a price–by–volume (Volume Profile) over a user-specified number of bars. The indicator automatically detects the top 5 volume concentration levels (POCs) and draws a colorful horizontal histogram at the right side of the chart. The computation is lightweight and updates in real time. K
FREE
Ospe POC Volume Profile
Nur Azureen Binti Ab Aziz
A volume-at-price heatmap with POC, value area, estimated buy/sell pressure, confirmed signals and alerts. POC Volume Profile Heatmap is a MetaTrader 5 indicator that organizes historical volume across price levels. It identifies the Point of Control, displays the selected value area, and estimates buying and selling pressure at the POC. The indicator is intended for traders who use volume-at-price structure to study acceptance, rejection and interaction around high-activity price levels. It c
FREE
Smart Session Breakout MT5 — Precision Range Accumulation & Volatility Expansion Signals Markets spend part of the trading day accumulating volume inside a tight range, and part of the day breaking out with explosive momentum. Smart Session Breakout draws the exact accumulation range of any session you choose (Asian, London, New York), carries its high and low levels forward as dynamic support/resistance, and marks genuine breakout candles. Key Features: - Session Accumulation Box: Draws the
FREE
Aggression Volume
Flavio Javier Jarabeck
4.29 (17)
Aggression Volume Indicator is the kind of indicator that is rarely found in the MQL5 community because it is not based on the standard Volume data provided by the Metatrader 5 platform. It requires the scrutiny of all traffic Ticks requested on the platform... That said, Aggression Volume indicator requests all Tick Data from your Broker and processes it to build a very special version of a Volume Indicator, where Buyers and Sellers aggressions are plotted in a form of Histogram. Additionally,
FREE
Correlation Matrix Pro - 多货币相关性分析 实时了解货币对之间的相关性! 一款强大的分析工具,可帮助您同时可视化多达6个货币对之间的统计关系。非常适合投资组合管理、风险分散和对冲策略。 主要功能 - 使用对数收益率的实时皮尔逊相关性 - 同时监控多达6个货币对 - 自动时间框架检测 - 可调回溯周期(5-200根K线) - 自动对冲机会检测 - 简约可折叠面板设计 - 颜色编码矩阵,即时解读 颜色编码 绿色 (+0.70 至 +1.00) = 强正相关 浅绿色 (+0.50 至 +0.69) = 中等正相关 灰色 (-0.49 至 +0.49) = 弱/无相关 橙色 (-0.50 至 -0.69) = 中等负相关 红色 (-0.70 至 -1.00) = 强负相关(对冲) 为什么要关注相关性? 风险管理 避免通过高度相关的头寸使风险加倍。 对冲策略 自动找到具有强负相关性的货币对进行有效对冲。 投资组合多元化 使用低相关性货币对构建多元化投资组合。 相关性突破 检测背离——通常是即将到来的市场变动信号。 输入参数 显示设置: - 面板 X/Y 位置 - 启动时
FREE
Friend of the trend
Anderson De Assis
Friend of the Trend: Your Trend Tracker Master the market with Friend of the Trend , the indicator that simplifies trend analysis and helps you identify the best moments to buy, sell, or wait. With an intuitive and visually striking design, Friend of the Trend analyzes price movements and delivers signals through a colorful histogram: Green Bars : Signal an uptrend, indicating buying opportunities. Red Bars : Alert to a downtrend, suggesting potential selling points. Orange Bars : Represent cons
FREE
True TrendLines MT5 - Smart Trend Detection & Alerts Overview True TrendLines MT5 is a professional-grade technical analysis tool that automatically identifies and plots high-probability trend lines on your MetaTrader 5 charts. Using a sophisticated swing point detection algorithm, it helps traders visualize key market structure and potential reversal points with precision. Key Features Automatic Trend Line Detection Identifies valid swing highs and lows based on your chosen strength paramet
FREE
World Time Display
Mohd Firuz Fahmi Bin Yusoff
The best and the only World Time Display for MT5 Features : - JAPAN, LONDON & NEW YORK Time Display - You can customize with different Font, Color And Text Size - You can customize Box Position and Box Color to meet your satisfaction - Only For Metatrader 5 - Customize GMT according to your Time Zone - Simple To Use. Just Attach to your MT5 - No hidden code or no errors
FREE
True Support Resistance Indicator: Your Ultimate Tool for Precise Trading Decisions​ Quick Overview ​ It's a simple indicator that elevates your trading strategy.  True Support Resistance Indicator​ ​ is a powerful tool designed to identify key support/resistance levels in real-time. Experience clean visuals, instant alerts on breakouts, and dynamic updates that keep you ahead of market movements. Why Choose True Support Resistance Indicator? 1. Simplicity Meets Precision -  Two clearly colored
FREE
Color Histogram Volume Set
Ricardo Almeida Branco
Do you use volume in your reading of the market? Certainly many traders use it, and do not imagine operating without it. The Color Histogram Volume Set indicator allows the user to choose the value that he considers interesting to monitor. When you pass this you will have visual confirmation and if you want you will also have the audible alert that is given by the indicator. Of course, there are other ways to try to find a high volume, such as assessing whether the volume is above av
Volume flow Profile
Israr Hussain Shah
大师版是一款专业级的分析工具,旨在通过成交量和资金流向的视角来可视化市场结构。与标准的成交量指标不同,该工具直接在图表上显示每日成交量分布,让您准确看到价格发现发生的位置以及“聪明钱”的定位。 此大师版专为清晰度和速度而设计,具有独特的自动主题同步系统,加载后即刻美化您的图表布局。 主要特点: 真实资金流向计算: 超越标准的跳动量。启用“Use Money Flow”时,成交量按价格加权,揭示了特定价格水平的实际资金投入。 价值区域 (VA) 可视化: 自动计算价值区域(默认为成交量的70%)。 VA填充: 为价值区域背景着色,以便即时识别控制区域。 关键水平: 清晰标记控制点 (POC)、价值区域高点 (VAH) 和价值区域低点 (VAL)。 专业标记系统: 扫描概况结构以识别关键交易区域: HVN (高成交量节点): 接受和盘整区域(支撑/阻力)。 LVN (低成交量节点): 拒绝区域或“快速通过”区域。 所有标记均向右绘制延长线,便于监控。 Delta 背离(左侧直方图): 左侧直方图可视化每个级别的买卖压力对比。这有助于识别隐藏的背离——即价格可能上涨,但卖家在这些水平上激进打
该产品的买家也购买
Trend Sniper X
Sarvarbek Abduvoxobov
4.9 (42)
Trend Sniper X 是一款适用于 MetaTrader 5 的多周期趋势跟踪指标,可帮助交易者清晰精准地识别趋势方向和潜在的反转点。 适用于 MT4: https://www.mql5.com/en/market/product/193245 价格信息: 当前价格为促销价,随着后续更新和新功能的推出,价格可能会有所变动。 赠品优惠: 购买后联系作者,即可免费获取该指标的 Auto-Trade Assistant EA(自动交易助手 EA)。 Code2Profit 频道 通过多时间框架分析掌控市场! 如何使用 Trend Sniper X 最大化您的胜率:核心规则与交易时段技巧 技术规格 平台 MetaTrader 5 指标类型 多时间周期趋势指标 运行时间周期 任何图表时间周期,可独立选择更高的时间周期 (M1–MN1) 主要交易品种 外汇、黄金 (XAUUSD) 及其他差价合约 (CFD) 推荐账户 任何账户类型 可视化 彩色趋势蜡烛 (买入/卖出/微弱/变化) + 买入/卖出箭头 附加模块 交易时段方框 (悉尼、东京、伦敦、纽约) 主要功能 多时间周期趋势分析: 直接在
Smart Trend Trading System — MetaTrader 5 购买后,请在 MQL5 上给我发消息,即可免费获得 Smart Universal Expert Advisor,以及在线课程、PDF 手册和私人群组访问权限。 STTS 将趋势方向、入场和出场信号、反转区域及重要价格水平集中呈现在图表上。您可以根据系统手动交易,也可以连接单独的兼容 EA,按照您选择的设置自动执行交易。 一套系统,四种交易思路 STTS 将交易方法分为四大类: • 剥头皮交易 — 跟踪短期信号和市场波动。 • 趋势交易 — 评估方向,寻找趋势中的交易机会。 • 反转交易 — 识别潜在的转折区域和方向变化。 • 成交量交易 — 利用成交量相关信息评估市场活跃程度。 入场和出场箭头、趋势信息、支撑与阻力位及反转区域,帮助您直接在图表上分析交易形态。 先从一种方法开始。了解其信号和设置后,再探索其他方法。 从信号到自动化 Smart Universal Expert Advisor 可连接 STTS,让您自动执行受支持的交易信号。 启用自动交易前,请配置指标连接、仓位大小和交易管理设置
SuperScalp Pro
Van Minh Nguyen
4.56 (36)
SuperScalp Pro - Professional Multi-Layer Confluence Scalping System SuperScalp Pro 是一款高级剥头皮交易指标,在经典 Supertrend 的基础上加入了多个智能确认过滤器。它可以帮助您识别概率更高的 Buy/Sell 交易机会,同时显著减少虚假信号。 清晰的 Buy 和 Sell 箭头会直接显示在图表上,基于 ATR 的 Stop Loss 和 Take Profit 水平会实时自动计算。 购买后,请联系我获取设置指导和推荐配置。 使用 SuperScalp Pro Auto Trader 轻松实现信号自动化: [Auto Trader] 下载推荐设置文件: [Set File] 完整文档请参阅产品博客: [User Guide] 加入官方频道获取最新更新: [Official Channel] 您将获得什么 SuperScalp Pro Indicator – 多层级 Buy/Sell 信号,并自动计算基于 ATR 的 Stop Loss 和 Take Profit。 免费 VM Auto SLTP
全新王者降临 - 指标 + 订单管理提示(TP1 + TP2 + TP3)+ 可选 Telegram 信号发送器 INCLUDED(免费) (完整交易与信号系统) 我们最强的黄金 EA: Gold Slayer 该指标包含先进的交易策略、可自定义订单管理系统,以及结合 Envelope 扩展的均值回归系统,并通过 RSI 等多重智能确认过滤器进行验证,以捕捉高概率反转入场机会,提供 BUY 与 SELL 信号。 你不仅能够学习如何交易,还能学会如何高效管理多个仓位,并利用之前盈利的持仓来覆盖亏损交易。 专为 M5 周期打造并优化,在 BTCUSD 和 XAUUSD 上表现尤为出色,因为这些市场的流动性能够让信号更加干净、可靠。 该指标会自动生成清晰的多头(Long)与空头(Short)信号,同时基于 ATR 自动计算入场位、止损位和止盈位,让风险管理从一开始就融入系统之中。 多 TP 系统设有三个渐进式目标位,你可以在 TP1 锁定部分利润、在 TP2 继续持仓,并在更大的行情中将仓位持有至 TP3,而这正是平均风险回报比真正开始大放异彩的地方。 默认参数开箱即用,已经针对稳定表现进行
SMC Intraday Formula
VividMind Digital Solutions
5 (26)
让我们先坦诚一点。 没有任何一个指标可以单独让你实现盈利。如果有人告诉你可以,那他是在向你兜售一个梦想。任何显示完美买卖箭头的指标都可以被做得看起来毫无瑕疵——只需要放大历史中的某一段并截取成功交易的截图。我们不会这样做。 SMC Intraday Formula 是一个工具。 它为你读取市场结构,标记出概率最高的价格区域,并用简单直白的语言准确告诉你当前智能资金的行为轨迹。你仍然需要做决定。你仍然需要执行交易。但现在,你是带着精确性执行,而不是靠希望。 我们已经在黄金(XAUUSD)以及主要外汇货币对的日内剥头皮交易中使用该指标将近三年。这是我们在 M1、M5、M15 和 M30 上的日常主力工具。它之所以有效,是因为它不试图预测未来——它展示的是当前正在形成的高概率交易机会,并解释 为什么 。 它与其他所有指标有什么不同? 大多数交易指标只做一件事。移动平均线交叉。振荡指标触及某个水平。出现一个箭头。你进场交易。你亏损。你责怪指标。重复。 SMC Intraday Formula 将多个机构级概念整合为一个统一的市场解读: - 斐波那契共振引擎 不只是普通的斐波那契水平——该指标
Entry Points Pro for MT5
Yury Orlov
4.52 (151)
传奇回归:Entry Points Pro 10。 这款传奇指标曾 3 年稳居 MQL5 Market 前三,如今全面重启。 数百条热情好评(两个版本合计 589 条),每天有数千名交易者用它交易,演示版下载 31,000+   MT4+MT5  次。 五年来我读过你们的每一条评价——在第 10 版里,我没有给出许诺,而是把答案直接做进了产品。指标作者自 1999 年入市, 珍视诚信、自己的声誉和自己的客户 。 Entry Points Pro 给出的入场信号严格不重绘。 而且这一次不再只是作者的一面之词,而是可验证的事实:确认信号只在 K 线收盘后标出,自动化测试记录到 零重绘 (在 EURUSD、XAUUSD 和 BTCUSD 上共 2,486,568 次不变量检查——0 次违规)。测试方法完全公开——您可以在策略测试器中自行复现。 购买后请务必第一时间给我发私信。 我会发给您 扩展版说明书《交易者圣经》 ——使用本指标交易的完整指南——并告诉您如何免费获得 赠品:市场扫描器 ,它能同时分析多个品种和多个时间周期,并在一个界面上显示 Entry Points Pro 此刻在哪里表现
Neuro Poseidon MT5
Daria Rezueva
4.75 (52)
Neuro Poseidon is a new indicator by Daria Rezueva. It combines precise trading signals with adaptive TP/SL levels - creating best possible trades as a result! Message me and get  Neuro Poseidon Assistant  as a gift to automize your trading process! What makes it stand out? 1. Proven profitability on all assets and timeframes 2. Only confirmed BUY and SELL signals present on the chart 3. Adaptive TP & SL levels generated by the software for each trade 4. Easy to understand - suitable for al
M5 Sniper
MeanFX
5 (3)
让您的交易优势尽在视野之中! M5 Sniper 是 MeanFX 推出的一款全新指标。它将 精准的交易信号 与 自适应 TP/SL 水平 相结合——从而创造出最佳的统计交易机会! 每售出 5 份,价格上涨一次,下一价格为 69$ 购买后请给我发消息,以获取技巧/指南和奖励 EA 它有哪些突出优势? 经过验证的统计表现 ,适用于 Gold XAUUSD( 几乎适用于每一种资产 ,专注于掌握一个时间周期,而不是试图面面俱到却无法获得稳定的结果) 每天每个交易品种 1 至 8 笔交易 ,具有较高的胜率百分比,并让所有统计优势站在我们这一边 图表上 仅显示已确认的 BUY 和 SELL 信号 自适应 TP 和 SL 水平 ,由指标针对每笔交易生成 平均胜率 75%+ 平均 Signal Ratio 最低 1.1+ 警报 和通知也会发送至 手机 **适合 Prop Firm(资金管理公司)**的交易方式 易于理解——适合 所有经验水平 的交易者 创作者提供的个人支持 100% 不重绘、不重新绘制、不滞后 奖励自动化 Expert Advisor(EA) 背后的策略: M5 Sniper 基于
M1 Sniper MT5
Oleg Rodin
5 (7)
M1 SNIPER   是一款易于使用的交易指标系统。它是一个专为 M1 时间框架设计的箭头指标。该指标可以作为独立的系统在 M1 时间框架下进行剥头皮交易,也可以作为您现有交易系统的一部分使用。虽然该交易系统专为 M1 时间框架交易而设计,但它也可以用于其他时间框架。我最初设计此方法是为了交易 XAUUSD 和 BTCUSD。但我发现这种方法在其他市场交易中也同样有用。 指标信号既可以顺势交易,也可以逆势交易。我教授一种特殊的交易技巧,帮助您利用指标信号进行双向交易。该方法基于使用特殊的动态支撑位和阻力位区域。 购买后,您可以立即下载 M1 SNIPER 箭头指标。此外,我还为所有 M1 SNIPER 工具用户免费提供下方屏幕截图所示的 Apollo Dynamic SR 指标!这两个指标的组合可以帮助您更轻松、更准确地利用 M1 时间框架进行交易。 购买后请联系我,免费获取交易提示和奖励指标! 祝您交易成功!
Adaptive Price Action Engine 买指标,免费送EA 自适应多时间框架趋势与K线形态智能分析系统 市场环境始终在变化,不同的市场阶段中,并非所有 Price Action 形态都具有相同的参考价值。 Adaptive Price Action Engine 旨在适应不断变化的市场条件,将 趋势结构、多时间框架分析、K线形态与统计优化 整合到一个统一的分析框架中。 两种自适应模式 Dual Alpha Trend Mode(双 Alpha Trend 模式) 自动搜索适合的 Alpha Trend 参数,并结合低周期与高周期市场结构,使指标能够根据近期市场行为动态调整趋势识别。 Candlestick + Alpha Mode(K线 + Alpha 模式) 将 Alpha Trend 市场状态与 22种多空K线形态 相结合。系统不会简单地对所有形态一视同仁,而是对不同的形态组合进行统计评估,并识别在特定市场环境下表现出更强历史统计特征的配置。 主要功能 趋势参数自动优化 多时间框架市场状态分析 22种多头与空头 Price Action K线形态 对数千种可能
ARIPoint
Temirlan Kdyrkhan
1 (4)
ARIPoint is a powerful trading companion designed to generate high-probability entry signals with dynamic TP/SL/DP levels based on volatility. Built-in performance tracking shows win/loss stats, PP1/PP2 hits, and success rates all updated live. Key Features: Buy/Sell signals with adaptive volatility bands Real-time TP/SL/DP levels based on ATR Built-in MA Filter with optional ATR/StdDev volatility Performance stats panel (Success, Profit/Loss, PP1/PP2) Alerts via popup, sound, push, or email Cu
Gann Made Easy MT5
Oleg Rodin
5 (11)
Gann Made Easy   是一个专业且易于使用的外汇交易系统,它基于使用先生理论的最佳交易原则。 W.D.江恩。该指标提供准确的买入和卖出信号,包括止损和获利水平。您甚至可以使用推送通知在旅途中进行交易。 购买后请联系我,即可免费获得交易指导和超棒的额外指标! 您可能已经多次听说过江恩交易方法。通常 Gann 的理论不仅对于新手交易者而且对于那些已经有一定交易经验的人来说都是非常复杂的东西。这是因为江恩的交易方法在理论上并不那么容易应用。我花了几年时间来完善这些知识,并将最好的原则应用到我的外汇指标中。 该指标非常易于应用。您所需要的只是将其附加到您的图表并遵循简单的交易建议。该指标不断进行市场分析工作并寻找交易机会。当它检测到一个好的入口点时,它会为您提供一个箭头信号。该指标还显示止损和获利水平。 换句话说,当您像先生一样进行交易时,该指标会为您提供最佳江恩建议。江恩亲自告诉你此时此刻该做什么。但最好的部分是您不需要了解任何有关江恩交易原则的知识,因为该指标会为您完成整个市场分析工作。
Scalper Vault MT5
Oleg Rodin
5 (1)
Scalper Vault 是一套功能强大且配置完善的交易系统,专为追求日内交易稳定性的交易者而设计。 作为一套完整且独立的交易系统,该高精度指标能够为外汇和二元期权交易者提供机构级的市场分析。 购买后请联系我,获取我的独家交易技巧以及一份超值赠品! Scalper Vault 能够消除凭感觉交易和复杂的各种手动分析,让您只需专注于执行交易,并运用简单易行的交易技巧进行操作。 精准的顺势交易信号:其核心算法通过分析市场结构,仅在市场主导趋势的方向上提供高胜率信号,从而大幅减少错误的入场操作。 精确的顶部与底部探测:系统能够识别市场动能耗尽的状态,从而锁定潜在的反转区域。 基于江恩(Gann)理论的买卖区域:系统会自动绘制江恩数学市场点位,让您能清晰洞察大型机构交易者在何处寻求买入或卖出。 100% 不会重绘(Non-Repainting):一旦K线收盘,生成的信号便会永久固定在图表上。绝无动态偏移,绝无虚假信号——您在历史数据中所见,即为该指标的真实表现。 广泛的市场适用性:适用于各类货币对、黄金、指数以及加密货币交易。
Auto Optimized SpeedAngle 是一款机构级的动量向量化系统,通过持续的前瞻优化(Walk-Forward Optimization, WFO)彻底消除了曲线拟合(curve-fitting)。该指标没有采用在市场 状态转换时容易失效的静态输入参数,而是利用出样外验证(Out-of-Sample, OOS) dynamically 动态重新校准设置,从而确保显示的 信号代表真正的统计优势,而非历史巧合。 核心机构级架构 前瞻优化引擎(Walk-Forward Optimization Engine): 核心算法持续扫描数千种回溯周期(lookback)与阈值组合,严格将数据划分为样本内(in-sample)和样本外(out-of-sample)。只有当参数配置在未知数据环境中证明具备数学优越性时,系统才会对其进行 adoption。 量化目标函数(Quantitative Objective Functions): 优化引擎不一味追求绝对毛利,而是聚焦于机构级的稳定性指标。用户可针对系统质量数(SQN)、期望值(每笔交易的平均 R 倍数)或净 R 值进行优化,从而优
Tokyo mt5 Indicator
Vasiliy Strukov
5 (10)
Tokyo Indicator(东京指标)直观地展示了趋势方向、潜在交易信号及市场状况。 其采用颜色编码的阶梯式趋势线,以蓝色标识看涨阶段,以洋红色标识看跌阶段。配套的方向箭头会在趋势发生变化时,标示出潜在的买入与卖出机会。 内置的综合仪表盘将当前信号、市场倾向、动能、波动率及信号质量整合于同一视图中,方便交易者在观察价格走势的同时评估指标数据,无需在不同面板间切换。 凭借清晰的图表显示和简洁的市场概览,Tokyo Indicator 支持以系统化的方式进行趋势分析与交易确认。 适用于任何时间周期及各类交易品种,尤其适合黄金交易。 购买后请立即联系我,以获取专属赠品!您可以免费获得我们的“强力支撑与趋势扫描”(Strong Support and Trend Scanner)指标,请私信我! 设置说明与使用手册请见此处。 请注意:我不会在 Telegram 上出售我的 EA 或特殊参数设置(set files);我的 EA 仅在 Mql5 平台上提供,而参数设置文件仅在我的博客(此处链接)上发布。请务必警惕诈骗,切勿从他人处购买任何参数设置! 设置 ShowHUD —— 在图表上显示
Entry In The Zone and SMC Multi Timeframe is a real-time market analysis tool based on Smart Money Concepts (SMC), designed to analyze market structure, price direction, and key trading zones. It supports both Single-Timeframe and Multi-Timeframe Analysis, providing a clearer view of overall market structure across multiple timeframes, with real-time BUY / SELL signals designed with a strict focus on No-Repaint principles. The signals are designed to help filter unclear setups and evaluate tradi
Trend Catcher ind mt5
Ramil Minniakhmetov
5 (18)
趨勢捕捉指標 趨勢捕捉指標結合了作者獨有的客製化自適應趨勢分析指標,用於分析市場價格趨勢。它透過過濾掉短期噪音,並專注於潛在的動能強度、波動性擴張和價格結構行為,來識別真實的市場方向。此外,它還結合了平滑和趨勢過濾等客製化指標,例如移動平均線、相對強弱指標 (RSI) 和波動率過濾器。 您可以在這裡查看實際運行情況以及我的其他產品: https://www.mql5.com/en/users/mechanic/seller 請注意,我不會在 Telegram 上出售 EA 或任何設置,那是騙局。所有設定都可以在我的部落格上免費取得。 重要提示!購買後請立即聯繫我,以獲取使用說明和額外獎勵! 請注意,我不會在 Telegram 上出售 EA 或任何設置,那是騙局。所有設定都可以在我的部落格上免費取得。
您好,交易员! 大多数散户交易者依赖于滞后的网页脚本。真正具有交易优势需要机构化的架构。 Astro AI 指标并非标准的图表叠加层。它是一个编译后的神经网络,包含两个代理,直接运行在您的终端上。 以下是该系统背后的具体技术: 1. 代理 1:分析师(图神经网络 - GNN) 市场并非孤立的价格柱;它们是相互关联的数据网络。 功能:代理 1 使用图神经网络来映射这些复杂的非线性关系。 优势:标准指标仅考虑单一的历史移动平均线,而我们的 GNN 可以实时处理深层的市场结构关系,在散户交易量发挥作用之前揭示隐藏的相关性。 2. 代理 2:执行器(近端策略优化 - PPO) 模式识别只是成功的一半。基于当前市场波动做出正确的决策,才是预测模型与滞后模型之间的区别所在。 功能:代理 2 使用 PPO(一种先进的强化学习算法)来确定最佳入场点。 优势:它持续调整交易策略,而非使用静态的“超买”或“超卖”线。它会分析当前市场状况并计算最可能的成交点。 执行桥接:通过 ONNX 集成到交易终端 如果执行速度慢,模式识别就毫无用处。我们已通过 ONNX(开放神经网络交换平台)
Divergence Bomber
Ihor Otkydach
4.89 (94)
购买该指标的每位用户将额外免费获得以下内容: 原创工具“Bomber Utility”,该工具会自动跟踪每一笔交易,设置止损和止盈点,并根据策略规则自动平仓; 适用于不同交易品种的指标设置文件(Set 文件); 三种不同风险模式下的 Bomber Utility 设置文件:“最低风险”、“平衡风险” 和 “观望策略”; 一套详细的 视频操作手册,帮助您快速完成安装、配置并开始使用本交易系统。 注意: 要获取以上所有赠品,请通过 MQL5 的私人消息系统联系卖家。 我为您介绍原创的自定义指标 “Divergence Bomber”(背离轰炸机),它是一套基于 MACD 背离交易策略 的“全功能”交易系统。 该技术指标的主要任务是识别 价格与 MACD 指标之间的背离,并发出交易信号(包括推送通知),指示未来价格可能的运动方向。平均而言,这些信号的准确率超过 98%。有关该指标如何工作的详细说明,请观看本页面上的视频演示。 该系统使用 止损订单 和 动态回撤平仓机制 来管理交易。 Divergence Bomber 指标的主要特点: 支持交易的品种: AUDCAD、AUDCHF、AUDS
PainX GainX Blue Spike Fusion AI Advanced Synthetic Index Spike Detection Indicator for MetaTrader 5 Discover potential spike setups with a clear, organized, and professional trading interface. PainX GainX Blue Spike Fusion AI is a specialized indicator designed for traders who monitor synthetic indices and want a structured way to observe potential price spike opportunities. The indicator combines signal monitoring, market-condition analysis, visual alerts, and event tracking in one convenient
Unix Scalper
Issam Kassas
4 (4)
Unix Scalper — MetaTrader 5 购买后,请在 MQL5 上给我发消息,即可免费获得 Smart Universal Expert Advisor,以及在线课程、PDF 手册和私人群组访问权限。 发现交易形态,看清交易计划,选择执行方式。 UNIX Scalper 将市场分析、BUY/SELL/WAIT 决策以及 Entry、Stop Loss、TP1 和 TP2 水平集中在一个清晰的面板中。 看清信号与交易计划 • 明确的决策:BUY、SELL 或 WAIT。 • 明确的价格水平:Entry、Stop Loss、TP1 和 TP2。 • 多时间周期概览:比较面板中各时间周期的信号。 • 辅助分析:趋势、动量、成交量、波动率、支撑与阻力,以及市场质量。 • 灵活的布局:Minimized、Compact、Standard 或 Full。 查看信号,检查价格水平,再判断该交易形态是否符合您的交易规则。 从黄金和比特币开始 建议首先使用的交易品种:XAUUSD 和 BTCUSD。 探索短期剥头皮交易和较高时间周期分析。选择历史K线范围,通过表现曲线查看所选设置
Volatility Master for MetaTrader is a real-time dashboard tool that scans up to  50 symbols  to identify high-volatility , trending markets instantly. With bullish/bearish signals, customizable alerts, and a user-friendly interface, it helps you avoid range-bound conditions and focus on high-probability trades. Clarity leads to confidence. Trade confidently and protect your capital effectively with this powerful dashboard. We don't offer free or bonus indicators in exchange of reviews from you.
Atomic Analyst MT5
Issam Kassas
4.48 (62)
Atomic Analyst — MetaTrader 5 购买后,请在 MQL5 上给我发消息,即可免费获得 Smart Universal Expert Advisor,以及在线课程、PDF 手册和私人群组访问权限。 Atomic Analyst 将价格行为、趋势方向、入场和出场信号、止损位及多个止盈位集中呈现在图表上。 看清信号,理解交易形态 Atomic Analyst 将分析结果整理为清晰的可视化信息: • 买入和卖出箭头,用于识别潜在的入场机会。 • 止损位和多个止盈位,帮助规划交易。 • 趋势、强度和动量读数,用于评估市场方向。 • 多时间周期分析,用于比较更广泛的市场背景。 • 彩色K线和提醒,帮助您跟踪变化的市场条件。 结合辅助分析查看信号,再判断该交易形态是否符合您的交易规则。 从短期形态到更大级别的行情 您可以将 Atomic Analyst 用于剥头皮交易、日内交易,或跟踪持续时间更长的市场走势。 建议从 H1 时间周期开始。建议交易品种包括 EURUSD、AUDUSD 和 XAUUSD。 从信号到自动化 Smart Universal Expert A
Market Structure Order Block Dashboard MT5 是一款专为希望直接在图表上解读市场结构和主要价格反应区域的交易者设计的MT5指标。它结合了BOS、ChoCH、订单块(Order Blocks)、公允价值缺口(FVG)、流动性、Kill Zones、成交量分布图以及一个紧凑的面板,便于快速分析。 本指标面向使用市场结构、ICT和Smart Money概念作为决策框架的交易者。它可以帮助以更结构化的方式识别趋势延续、可能的反转、价格失衡、流动性目标和关注区域。 面向买家的资源 购买后可通过MQL5私信申请获取完整的PDF使用指南和参数配置建议。通过MQL5私信提供直接技术支持。 1.20版本带来两项重要新增: Pending BOS / Pending ChoCH 检测 和 可拖动面板 (按住面板标题栏即可将其拖动到图表任意位置,不影响图表本身)。当K线收于前一摆动点之外时,Pending Breaks 立即显示待确认的结构突破,无需等待经典的摆动确认。 重要 本产品仅为指标。它不会自动开仓、平仓或管理仓位。它不是EA(智能交易系统)。 主要功能 市场
Break and Retest Hunter
Mohamed Hassan
5 (2)
Break and Retest Hunter is a powerful MetaTrader 5 indicator designed to automatically identify support and resistance levels, breakout structures, and potential retest opportunities in real time. Bonus Indicator: After purchasing Break and Retest Hunter , contact me to receive Trade Indicator Assistant EA completely free as a bonus utility. $65 for the next 10 copies . Next price is $120.  Combining adaptive market analysis, clear BUY/SELL signals, Fibonacci-based profit targets, and a premiu
FiboSniper Pro
Van Minh Nguyen
5 (3)
FiboSniper Pro – Multi-Filter Fibonacci System with Auto SL/TP and Control Panel FiboSniper Pro 是一款技术指标,将动态 Fibonacci Envelopes 与多个确认过滤器相结合,以生成经过筛选的 Buy 和 Sell 信号。Fibonacci 水平基于 Moving Average 和 ATR 计算,然后通过 ADX、EMA、RSI、ATR、Volume、Time 和 Candle 结构进行过滤。该指标直接在图表上显示基于 ATR 自动计算的 Stop Loss 和 Take Profit 水平,并提供交互式控制面板,以便快速调整参数。 购买后,请联系我以获取推荐的设置文件和详细使用说明。 使用 Auto Trader X 自动执行 FiboSniper Pro 信号: [Auto Trader X] 用户指南和设置文件: [Click here] 完整文档请参阅产品博客: [Click here] 加入官方频道获取最新更新: [Click here] 专为偏好结构化入场和清晰风险管理
Quantum TrendPulse
Bogdan Ion Puscasu
5 (26)
介绍 Quantum TrendPulse   ,这是一款终极交易工具,它将 SuperTrend   、   RSI 和 Stochastic 的强大功能整合到一个综合指标中,以最大限度地发挥您的交易潜力。该指标专为追求精准和效率的交易者而设计,可帮助您自信地识别市场趋势、动量变化以及最佳进入和退出点。 主要特点: 超级趋势整合: 轻松跟随当前的市场趋势并乘上盈利浪潮。 RSI 精度: 检测超买和超卖水平,非常适合把握市场逆转时机,可用作 SuperTrend 的过滤器 随机精度: 利用随机振荡在波动的市场中寻找隐藏的机会, 用作超级趋势的过滤器 多时间范围分析: 从 M5 到 H1 或 H4,在不同时间范围内关注市场动态。 可定制的警报: 当您的自定义交易条件得到满足时收到通知,这样您就不会错过任何交易。 无论您是新手还是经验丰富的交易员,   Quantum TrendPulse 都能为您提供所需的优势,帮助您增强策略并自信地进行交易。借助这一强大的指标,将洞察力转化为利润 — 掌控您的交易! ***购买 Quantum TrendPulse,即可免费获得 Quantum Tr
FX Power MT5 NG
Daniel Stein
5 (33)
FX Power:分析货币强度,助您做出更明智的交易决策 概述 FX Power 是一款专业工具,帮助您全面了解主要货币和黄金在任何市场条件下的真实强度。通过识别强势货币用于买入,弱势货币用于卖出, FX Power 简化了交易决策,并帮助您发现高概率的交易机会。不论您是想跟随趋势还是通过极端的 Delta 值预测反转,这款工具都能完美适应您的交易风格。别再盲目交易——用 FX Power 让您的交易更加智慧。 1. 为什么 FX Power 对交易者极具价值 实时货币和黄金强度分析 • FX Power 实时计算并显示主要货币和黄金的相对强度,助您全面了解市场动态。 • 监控领先或落后资产,轻松识别值得交易的货币对。 全面的多时间框架视图 • 跟踪短期、中期和长期时间框架的货币和黄金强度,以便将您的交易策略与市场趋势保持一致。 • 无论是快进快出的短线交易还是更长期的投资策略, FX Power 都能为您提供所需的信息。 Delta 动态分析用于趋势和反转 • 极端 Delta 值常常预示反转机会,而平缓的 Delta 变化则确认趋势延续。 • 使用 Delta 分析,轻
Axiom Matrix
Issam Kassas
5 (8)
购买后,请在 MQL5 上给我发消息,即可免费获得 Smart Universal Expert Advisor,以及在线课程、PDF 手册和私人群组访问权限。 扫描市场。比较机会。选择下一张图表。 Axiom Matrix (MetaTrader 5) 将多品种、多周期分析整合到一个面板中。无需逐一检查所有图表,即可找到值得关注的市场。 扫描市场报价中的品种或自选品种,覆盖多个周期。 比较趋势、动量、成交量、波动率及市场质量信息。 通过 Best Axiom Pick、信号状态及可点击单元格查看交易机会。 Axiom Matrix 是分析面板,不执行交易。 面板将多个品种与周期的信息集中显示,便于比较不同市场的状态。您可以从市场报价或自选列表开始扫描,再通过可点击的单元格打开对应图表进行进一步分析。显示的分析结果不代表收益保证。 查看截图,了解界面,并阅读客户评价。 如有产品、设置或技术支持方面的问题,请直接在 MQL5 上给我发消息。 — Issam 交易存在风险。历史结果不保证未来表现。请先在模拟账户中测试您的设置。
PZ Divergence Trading MT5
PZ TRADING SLU
3.71 (7)
棘手的发现和频率稀缺是最可靠的交易方案之一。该指标使用您喜欢的振荡器自动查找并扫描常规和隐藏的发散。 [ 安装指南 | 更新指南 | 故障排除 | 常见问题 | 所有产品 ] 容易交易 发现常规和隐藏的分歧 支持许多知名的振荡器 根据突破实现交易信号 显示适当的止损和获利水平 可配置的振荡器参数 可自定义的颜色和尺寸 按条形过滤大小差异 实现绩效统计 它实现了电子邮件/声音/视觉警报 为了提供广阔的市场前景,可以使用不同的振荡器在同一张图表中多次加载该指标,而不会产生干扰。该指标支持以下振荡器: RSI CCI MACD OSMA 随机 动量 很棒的振荡器 加速器振荡器 威廉姆斯百分比范围 相对活力指数 由于差异可能会扩大很多,尤其是在外汇市场中,因此该指标产生了转折:它在等待交易突破之前等待donchian突破确认差异。最终结果是带有非常可靠的交易信号的重新粉刷指示器。 输入参数 幅度:用于寻找差异的之字形周期 振荡器-选择要加载到图表的振荡器。 突破期-交易信号的突破期,以柱为单位。 发散类型-启用或禁用发散类型:隐藏,常规或两者。 最小散度单位为条形-最小散度单位为条形
作者的更多信息
This easy to setup indicator shows you the market volumes in a different way, with support and resistance as showed. You can setup: - Backdays volume to show - Heiken Ashi candle view It works for every kind of graph and every kind of period. The program shows the volumes based on the number of candles displayed in the chart: the more candles the more volumes. Enjoy this very useful indicator. Please feel free to message me to report any kind of improvements! :D
Liquidity Oscillator
Paolo Scopazzo
3 (2)
A powerful oscillator that provide Buy and Sell signals by calculating the investor liquidity. The more liquidity the more buy possibilities. The less liquidity the more sell possibilities. Please download the demo and run a backtest! HOW IT WORKS: The oscillator will put buy and sell arrow on the chart in runtime only . Top value is 95 to 100 -> Investors are ready to buy and you should follow. Bottom value is 5 to 0 -> Investors are ready to sell and you should follow. Alert + sound will appe
HeatMap viewer
Paolo Scopazzo
Showing like in the picture or in the logo  multiple pair, multiple timeframes, multiple indicators in the same time , allowing you to click and go straight on that pair. The indicator will change like a Carosello every 3 seconds and will show you the indicator values also by background color to check in a very fast way if its oversold or overbought . Feel free to ask for adding new pair or indicator , i will update it for free. Pair managed: EURUSD, GBPUSD, USDJPY, AUDUSD, USDCHF. Indicator man
# Adaptive Slope Ribbon - ATR-normalised regression slope ribbon *Category: Trend | Difficulty: intermediate | Window: separate window below the chart | Markets: Universal (Forex, indices, commodities, crypto, stocks) | Suggested timeframes: M15, M30, H1, H4, D1* ## Short description > Five linear regression slopes over growing horizons, normalised in ATR units and comparable across instruments. The histogram shows the mean slope coloured by the level of agreement between time scales. ## Fu
# Fractal Trend Channel - Structural channel from confirmed swings *Category: Trend | Difficulty: beginner | Window: chart window (overlaid on price) | Markets: Universal (Forex, indices, commodities, crypto, stocks) | Suggested timeframes: M15, M30, H1, H4, D1* ## Short description > Step channel built from the last confirmed fractal swings, with a midline coloured by market structure: higher highs and lows, lower highs and lows, or mixed structure. ### Overview Reading structure through
# Volatility Adaptive MA - Variable speed moving average *Category: Trend | Difficulty: intermediate | Window: chart window (overlaid on price) | Markets: Universal (Forex, indices, commodities, crypto, stocks) | Suggested timeframes: M5, M15, M30, H1, H4* ## Short description > A moving average whose smoothing factor is driven by the ratio between short and long term volatility: it accelerates during breakouts and slows down in compressed phases, cutting false crossovers. ### Overview Eve
# Trend Persistence Index - Persistence versus randomness *Category: Trend | Difficulty: advanced | Window: separate window below the chart | Markets: Universal (Forex, indices, commodities, crypto, stocks) | Suggested timeframes: M30, H1, H4, D1* ## Short description > Compares the direction changes actually observed with those expected from a purely random series. Above zero the market persists in one direction, below zero it keeps flipping. ### Overview In a random walk the sign of the
# Kalman Trend Filter - Level and velocity Kalman filter *Category: Trend | Difficulty: advanced | Window: chart window (overlaid on price) | Markets: Universal (Forex, indices, commodities, crypto, stocks) | Suggested timeframes: M15, M30, H1, H4, D1* ## Short description > A two state Kalman filter that simultaneously estimates price level and velocity. The gain self-adjusts: it trusts the model when data are consistent and re-adapts immediately to shocks. ### Overview The Kalman filter
# Multi Scale Trend Agreement - Consensus across eight horizons *Category: Trend | Difficulty: beginner | Window: separate window below the chart | Markets: Universal (Forex, indices, commodities, crypto, stocks) | Suggested timeframes: M5, M15, M30, H1, H4, D1* ## Short description > Checks price position against its own average on eight geometrically spaced scales and condenses the result into a single score from -100 to +100. ### Overview A trend worth the name is recognised from whatev
# Directional Efficiency - Net path versus gross path *Category: Trend | Difficulty: intermediate | Window: separate window below the chart | Markets: Universal (Forex, indices, commodities, crypto, stocks) | Suggested timeframes: M15, M30, H1, H4, D1* ## Short description > Signed ratio between the net distance travelled by price and the gross path actually covered. It separates straight trends from disorderly advances that burn capital. ### Overview Two markets can rise by the same amoun
# Trend Age Counter - Regime age versus typical duration *Category: Trend | Difficulty: intermediate | Window: separate window below the chart | Markets: Universal (Forex, indices, commodities, crypto, stocks) | Suggested timeframes: M30, H1, H4, D1* ## Short description > Counts how many bars the current regime has lasted and compares it with the average duration of all past regimes on the same instrument. It measures trend maturity, not strength. ### Overview Every trend indicator answer
# Regression Confidence Baseline - Bands on residual error *Category: Trend | Difficulty: intermediate | Window: chart window (overlaid on price) | Markets: Universal (Forex, indices, commodities, crypto, stocks) | Suggested timeframes: M15, M30, H1, H4, D1* ## Short description > Linear regression baseline with bands built on the residual standard error instead of the price standard deviation. Bands widen when the move loses order, not when price runs. ### Overview Classic volatility band
# Trend Exhaustion Meter - Composite exhaustion score *Category: Trend | Difficulty: advanced | Window: separate window below the chart | Markets: Universal (Forex, indices, commodities, crypto, stocks) | Suggested timeframes: M30, H1, H4, D1* ## Short description > A 0 to 100 score combining stretch from the mean, directional saturation and momentum fade. It measures the continuation risk of a move, not its reversal. ### Overview No single symptom says a trend is about to end, but when se
# Normalized Momentum Z - Momentum in standard scores *Category: Momentum | Difficulty: intermediate | Window: separate window below the chart | Markets: Universal (Forex, indices, commodities, crypto, stocks) | Suggested timeframes: M15, M30, H1, H4, D1* ## Short description > Standardises momentum against its own recent historical distribution and returns a z score. A value of +2 marks a thrust stronger than roughly 97 per cent of the instrument recent moves. ### Overview Raw momentum ha
# Momentum Curvature - Acceleration versus velocity *Category: Momentum | Difficulty: intermediate | Window: separate window below the chart | Markets: Universal (Forex, indices, commodities, crypto, stocks) | Suggested timeframes: M15, M30, H1, H4, D1* ## Short description > Measures price acceleration, the second derivative of the smoothed series, and compares it with velocity. It detects loss of thrust before direction changes. ### Overview Anyone who drives knows the brake pedal acts o
# Rate Of Change Spectrum - Which horizon is driving *Category: Momentum | Difficulty: advanced | Window: separate window below the chart | Markets: Universal (Forex, indices, commodities, crypto, stocks) | Suggested timeframes: M30, H1, H4, D1* ## Short description > Standardises the rate of change over six horizons and identifies which one is driving the move. It shows the dominant scale score and its rank. ### Overview Knowing the market is rising tells you little. Knowing whether it ri
# Impulse Strength Gauge - Movement weighted by volume *Category: Momentum | Difficulty: intermediate | Window: separate window below the chart | Markets: Universal (Forex, indices, commodities, crypto, stocks) | Suggested timeframes: M5, M15, M30, H1, H4* ## Short description > Weights every bar by combining body size in ATR units with volume relative to its average, then accumulates the contributions. It separates wide but empty bars from genuinely supported impulses. ### Overview A wide
# Dual Horizon Momentum Delta - Short versus long, time corrected *Category: Momentum | Difficulty: advanced | Window: separate window below the chart | Markets: Universal (Forex, indices, commodities, crypto, stocks) | Suggested timeframes: M15, M30, H1, H4, D1* ## Short description > Compares momentum on two horizons after normalising them by the square root of time, a correction without which the long horizon would always look larger by pure construction. ### Overview Directly comparing
# Impulse Retrace Ratio - Impulse size versus retracement size *Category: Momentum | Difficulty: intermediate | Window: separate window below the chart | Markets: Universal (Forex, indices, commodities, crypto, stocks) | Suggested timeframes: M15, M30, H1, H4, D1* ## Short description > Groups consecutive same sign changes into runs and compares the average size of bullish runs with that of bearish ones. It measures whether impulses are larger, not more numerous. ### Overview A healthy upt
# Momentum Thrust Counter - Counting thrusts beyond threshold *Category: Momentum | Difficulty: beginner | Window: separate window below the chart | Markets: Universal (Forex, indices, commodities, crypto, stocks) | Suggested timeframes: M15, M30, H1, H4, D1* ## Short description > Counts bars moving beyond an ATR multiple and reports the net balance. The total line separates calm from battle, both of which show a balance near zero. ### Overview Most bars on a chart carry no information: t
# Momentum Divergence Scanner - Divergences without repaint *Category: Momentum | Difficulty: intermediate | Window: chart window (overlaid on price) | Markets: Universal (Forex, indices, commodities, crypto, stocks) | Suggested timeframes: M15, M30, H1, H4, D1* ## Short description > Flags price to momentum divergences using confirmed swings only. The arrow appears on confirmation and is never withdrawn, unlike almost every other divergence indicator. ### Overview Almost every divergence
# Elastic Momentum Band - Momentum driven asymmetric channel *Category: Momentum | Difficulty: intermediate | Window: chart window (overlaid on price) | Markets: Universal (Forex, indices, commodities, crypto, stocks) | Suggested timeframes: M15, M30, H1, H4* ## Short description > A channel deforming with momentum: the band favouring the move draws closer to the average, the opposite one moves away. It makes breaks in direction easier and counter breaks more selective. ### Overview A symm
# Momentum Entropy Filter - Order versus randomness in thrusts *Category: Momentum | Difficulty: advanced | Window: separate window below the chart | Markets: Universal (Forex, indices, commodities, crypto, stocks) | Suggested timeframes: M30, H1, H4, D1* ## Short description > Computes the Shannon entropy of the recent momentum distribution and converts it into an order score from 0 to 100. It separates markets with recurring structure from those without regularity. ### Overview Shannon e
# Realized Volatility Cone - Historical volatility percentiles *Category: Volatility | Difficulty: intermediate | Window: separate window below the chart | Markets: Universal (Forex, indices, commodities, crypto, stocks) | Suggested timeframes: M30, H1, H4, D1* ## Short description > Draws realized volatility together with the percentiles of its own historical distribution. It tells whether the current level is high or low for that specific instrument. ### Overview Knowing that realized vo
# Volatility Forecast EWMA - Forecasting the next bar *Category: Volatility | Difficulty: advanced | Window: separate window below the chart | Markets: Universal (Forex, indices, commodities, crypto, stocks) | Suggested timeframes: M15, M30, H1, H4, D1* ## Short description > Estimates next bar volatility with an EWMA model on variance, the same scheme used in portfolio risk management, alongside the volatility actually observed. ### Overview Every volatility indicator looks backwards and
# Volatility Regime Classifier - Classification with hysteresis *Category: Volatility | Difficulty: intermediate | Window: separate window below the chart | Markets: Universal (Forex, indices, commodities, crypto, stocks) | Suggested timeframes: M15, M30, H1, H4, D1* ## Short description > Classifies volatility into four regimes using a hysteresis state machine, eliminating the constant flipping typical of fixed thresholds. The active threshold is drawn. ### Overview Classifying volatility
# Garman Klass Volatility - An estimator using the whole OHLC *Category: Volatility | Difficulty: advanced | Window: separate window below the chart | Markets: Universal (Forex, indices, commodities, crypto, stocks) | Suggested timeframes: M15, M30, H1, H4, D1* ## Short description > A volatility estimator using open, high, low and close instead of closes only. Its ratio to the classic estimate separates intra-bar movement from close-to-close movement. ### Overview The standard deviation o
# Overnight Gap Risk - The risk stops cannot cover *Category: Volatility | Difficulty: intermediate | Window: separate window below the chart | Markets: Stocks | Suggested timeframes: H1, H4, D1* ## Short description > Splits each bar change into gap and intra-bar movement, and reports the share of risk attributable to gaps, the part no stop can protect against. ### Overview The risk of a position held past the close is not the same as that of the same position closed intraday, and the dif
# Volatility Breakout Projection - Levels projected from the open *Category: Volatility | Difficulty: beginner | Window: chart window (overlaid on price) | Markets: Universal (Forex, indices, commodities, crypto, stocks) | Suggested timeframes: M5, M15, M30, H1* ## Short description > Anchors a reference to each session open and projects two pairs of levels computed as fractions of the average daily range. Levels stay fixed for the whole session. ### Overview If an instrument covers on ave
# Compression Expansion Detector - Squeeze and release *Category: Volatility | Difficulty: intermediate | Window: separate window below the chart | Markets: Universal (Forex, indices, commodities, crypto, stocks) | Suggested timeframes: M15, M30, H1, H4, D1* ## Short description > Measures how far short term volatility has narrowed relative to the reference, counts how many bars the compression has lasted and highlights the bars following the release. ### Overview Volatility is not stable:
筛选:
无评论
回复评论