Volatility Breakout Projection
- 指标
- 版本: 1.0
- 激活: 5

# Volatility Breakout Projection - Levels projected from the open
*Category: Volatility | Difficulty: beginner | Window: chart window (overlaid on price) | Markets: Universal (Forex, indices, commodities, crypto, stocks) | Suggested timeframes: M5, M15, M30, H1*
## Short description
> Anchors a reference to each session open and projects two pairs of levels computed as fractions of the average daily range. Levels stay fixed for the whole session.
### Overview
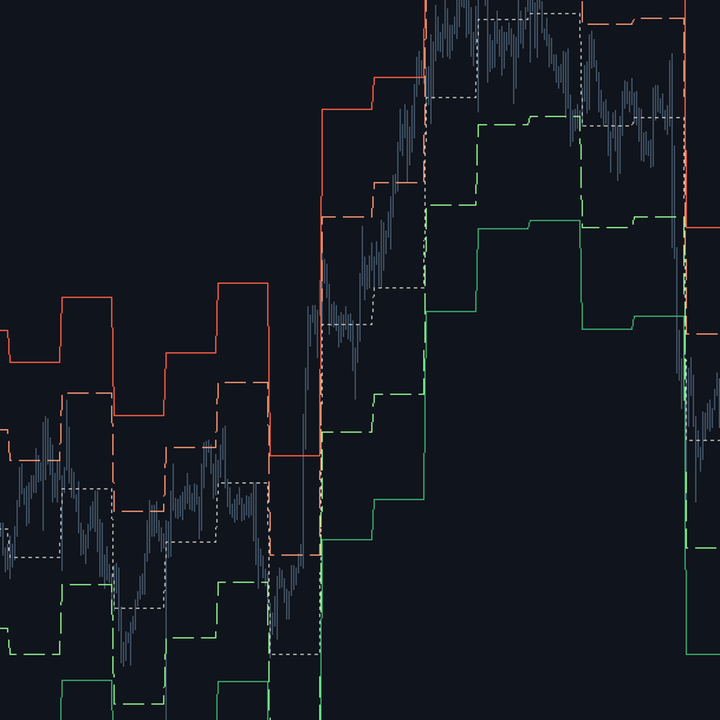
If an instrument covers on average one hundred points a day, a fifty point move from the open has already consumed half the typical day, while a hundred point one is an expansion day. It is a banal observation yet surprisingly useful, because it provides realistic targets and breakout thresholds with no assumption about direction. At the open of each day the indicator anchors a reference level to the opening price and projects two pairs of symmetric levels, computed as fractions of the average range of previous days. The average range is updated only once a day is complete, so the levels stay strictly fixed for the entire session and never move after the fact, a property that makes them usable for pending orders too.
### How the calculation works
1. The day change is recognised by comparing the date of the current bar with that of the previous one.
2. During the session only the observed high and low are updated, without touching the levels already drawn.
3. At the end of the day its range enters an exponential average of previous ranges.
4. The exponential average allows recursive updating without having to store the ranges of every past day.
5. At the new session open the anchor is fixed to the opening price and the four levels are computed once.
6. Until a reliable average range is available the levels are not drawn at all, rather than showing arbitrary values.
### How to use it
- Treat the inner levels as the natural first target of a trade opened near the session open.
- Treat the outer levels as an expansion threshold: reaching them means the day is exceeding its typical range.
- Open counter trend positions at the outer levels only with confirmation: the day may simply be an exceptional one.
- On D1 and higher every bar is treated as a session: the indicator keeps working but its meaning changes.
- The levels stay fixed for the whole session, so they can be used directly to place pending orders at the start of the day.
### Who it is for and on which timeframes
It targets intraday traders, particularly those working the first hours of a session who need realistic rather than arbitrary targets. It works from M5 to H1, the timeframes where one session contains enough bars for the levels to be meaningful. No technical background is required: the idea of an average daily range is familiar to anyone who has watched a chart for a few weeks. It is particularly effective on indices and major currencies, where the daily range is relatively stable.
### Practical example of reading a signal
On US500 M15 the session opens at 5240 and the average range of the last twenty days is 48 points. The levels are set at 5264 and 5288 above, at 5216 and 5192 below. In the first hour price rises to 5262, just below the first level: a trader who entered at the open has a natural target within reach. Price touches it, retraces and resumes up to 5286, close to the second level. At that point the day has already covered nearly the entire typical range: continuing to chase carries an unfavourable risk to reward ratio, and the sensible choice is to close or tighten the stop sharply, not to add.
## Input parameters
| Parameter | Default | Description |
|---|---|---|
| `InpRangeDays` | 20 | Number of sessions the range is averaged over. Low values make the levels responsive to volatility changes, high ones make them stable. |
| `InpMult1` | 0.50 | Fraction of the average range for the first pair of levels. With 0.50 the level is reached on an average day of normal size. |
| `InpMult2` | 1.00 | Fraction for the second pair. With 1.00 the level corresponds to a day that covered the entire typical range in a single direction. |
| `InpShowAnchor` | true | Shows or hides the session open line. Hiding it declutters the chart when another opening indicator is already in use. |
## Advantages / strengths
- The levels are fixed at the open and never move: directly usable for pending orders.
- It provides targets anchored to the instrument real volatility instead of arbitrary or round numbers.
- An elementary concept, applicable with no learning curve.
- Recursive updating of the average range: no meaningful computational cost even on long histories.
## Limitations and warnings
- It assumes the day develops symmetrically around the open, which is false on strongly directional days.
- The average range adapts slowly: after an abrupt volatility change the levels stay calibrated on the previous regime for several sessions.
- The day change depends on the broker server time, which may differ from yours and shift the anchor relative to expectations.
- On timeframes above H1 the session logic progressively loses meaning.
**No repaint:** values printed on a closed bar are never modified afterwards.
**Disclaimer.** This product is a technical analysis tool, not an automated trading system, and it offers no profit guarantee whatsoever. Financial markets carry the risk of total loss of the invested capital. Past performance is not indicative of future results. Every signal must be confirmed with your own analysis, a money management plan and prior testing on a demo account. The author is not responsible for trading decisions taken on the basis of this indicator.
## Suggested tags / keywords for MQL5
`intraday`, `daily range`, `breakout`, `targets`, `session`, `levels`, `no repaint`, `atr`