Compression Expansion Detector
- 指标
- 版本: 1.0
- 激活: 5

# Compression Expansion Detector - Squeeze and release
*Category: Volatility | Difficulty: intermediate | Window: separate window below the chart | Markets: Universal (Forex, indices, commodities, crypto, stocks) | Suggested timeframes: M15, M30, H1, H4, D1*
## Short description
> Measures how far short term volatility has narrowed relative to the reference, counts how many bars the compression has lasted and highlights the bars following the release.
### Overview
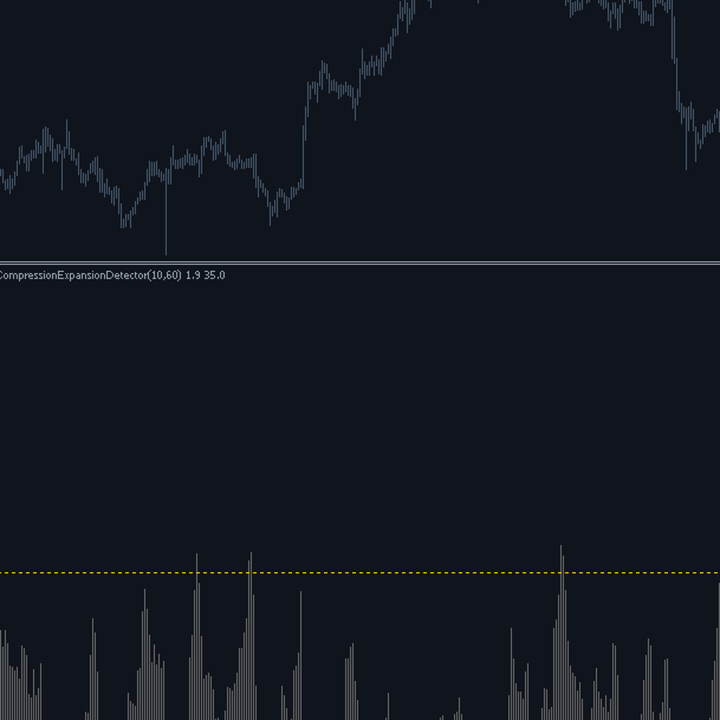
Volatility is not stable: it alternates compression phases, where the range narrows progressively, and expansion phases, where it widens abruptly. The former are dull and unproductive, the latter contain nearly all the exploitable moves. Compression Expansion Detector measures how far short term volatility has narrowed relative to the reference and, something almost no squeeze indicator does, explicitly counts how many bars the compression has lasted. A recognised compression, meaning deep enough and lasting enough, is coloured blue; the moment it breaks, the following bars are highlighted in orange for a configurable number of bars, signalling that expansion has just begun and that this is the moment to act.
### How the calculation works
1. The true range of each bar is computed once and reused by both volatility averages.
2. A short term volatility over InpShortAtr bars and a reference one over InpLongAtr bars are derived.
3. The compression index is one hundred minus one hundred times their ratio: it equals zero when there is no narrowing at all.
4. A state machine counts consecutive bars above the compression threshold.
5. When the index falls below the threshold after at least InpMinSqueeze bars of compression, a countdown of InpReleaseBars bars starts.
6. The countdown bars are coloured orange: they are the expansion window that has just opened.
### How to use it
- Do not trade during the blue phase: compression can last far longer than expected and premature breaks are almost always false.
- Prepare the orders during compression and activate them when the orange bars appear.
- The direction of the break is not provided by the indicator: it must be determined by price or by a separate trend filter.
- Very long compressions tend to produce wider expansions: the duration visible in the blue histogram hints at the expected size.
- Raise InpMinSqueeze to reduce the number of signals and select only genuinely significant compressions.
### Who it is for and on which timeframes
It is the natural tool for breakout traders who need to know when to prepare rather than reacting to a move already made. It works from M15 to D1. It performs best on instruments clearly alternating quiet and active phases, such as major currencies and indices; on constantly volatile instruments, like some cryptocurrencies, compressions are rare and the indicator stays neutral for long stretches. No statistical background is required.
### Practical example of reading a signal
On EURGBP H1 the compression index exceeds the threshold and the bars turn blue. The phase lasts twenty three bars, during which price moves within a twenty pip range and every break attempt fades. The trader prepares two pending orders, one above and one below the range, but does not activate them. On the twenty fourth bar the index collapses below the threshold and the orange bars appear: short term volatility has widened abruptly. The orders are activated. Price breaks upwards and covers, within six bars, more than three times the entire range of the preceding twenty three.
## Input parameters
| Parameter | Default | Description |
|---|---|---|
| `InpShortAtr` | 10 | Period of the short term volatility. It is the measure that narrows during compression. |
| `InpLongAtr` | 60 | Period of the reference volatility representing the instrument normality. Keep it clearly above the previous one. |
| `InpSqueezeLevel` | 35.0 | Compression index beyond which a squeeze is recognised. With 35 short volatility must have fallen to about two thirds of the reference. |
| `InpMinSqueeze` | 5 | Minimum compression bars for the squeeze to be confirmed and its break to generate the orange highlight. |
| `InpReleaseBars` | 6 | Number of bars over which the expansion is highlighted after the release. It is the suggested operational window. |
## Advantages / strengths
- It explicitly separates ongoing compression from a break just occurred, two situations demanding opposite behaviour.
- The duration count adds information that compression depth alone does not provide.
- The highlighted expansion window indicates a concrete operational interval rather than a single instant.
- No repaint and a very light computation, based on a single true range series reused by both averages.
## Limitations and warnings
- It gives no indication of the break direction, which must be determined with another tool.
- A compression can break and immediately fade: the orange window does not guarantee the expansion will continue.
- The squeeze threshold is an empirical value depending on the ratio between the two chosen periods: changing them requires revising it.
- On chronically volatile instruments the index stays low and the indicator almost never produces signals.
**No repaint:** values printed on a closed bar are never modified afterwards.
**Disclaimer.** This product is a technical analysis tool, not an automated trading system, and it offers no profit guarantee whatsoever. Financial markets carry the risk of total loss of the invested capital. Past performance is not indicative of future results. Every signal must be confirmed with your own analysis, a money management plan and prior testing on a demo account. The author is not responsible for trading decisions taken on the basis of this indicator.
## Suggested tags / keywords for MQL5
`squeeze`, `compression`, `breakout`, `volatility`, `expansion`, `atr`, `no repaint`, `timing`