Gap Zone Highlighter
- 指标
- 版本: 1.11
- 更新: 1 九月 2026
- 激活: 5

Gap Zone Highlighter – Identify Important Gap Zones Across Multiple Timeframes
The Gap Zone Highlighter is a MetaTrader 5 indicator designed to automatically detect Buy and Sell Gaps and transform them into clearly visible price zones directly on your chart.
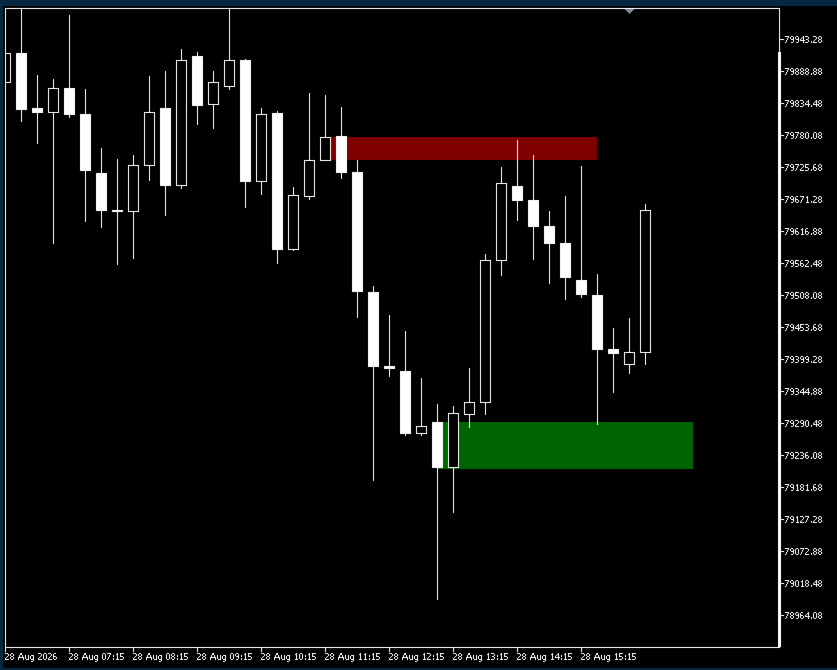
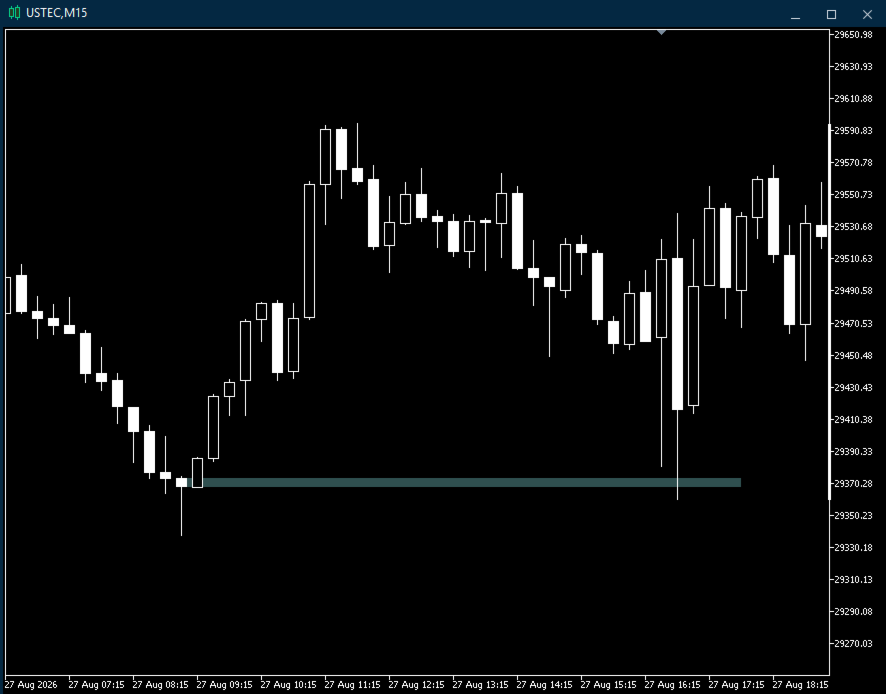
Instead of manually searching for gaps and marking relevant price areas, the indicator handles this process automatically. Detected zones are displayed as colored rectangles, making it easy to see where significant Buy or Sell Gaps have formed and how price reacts when returning to these areas.
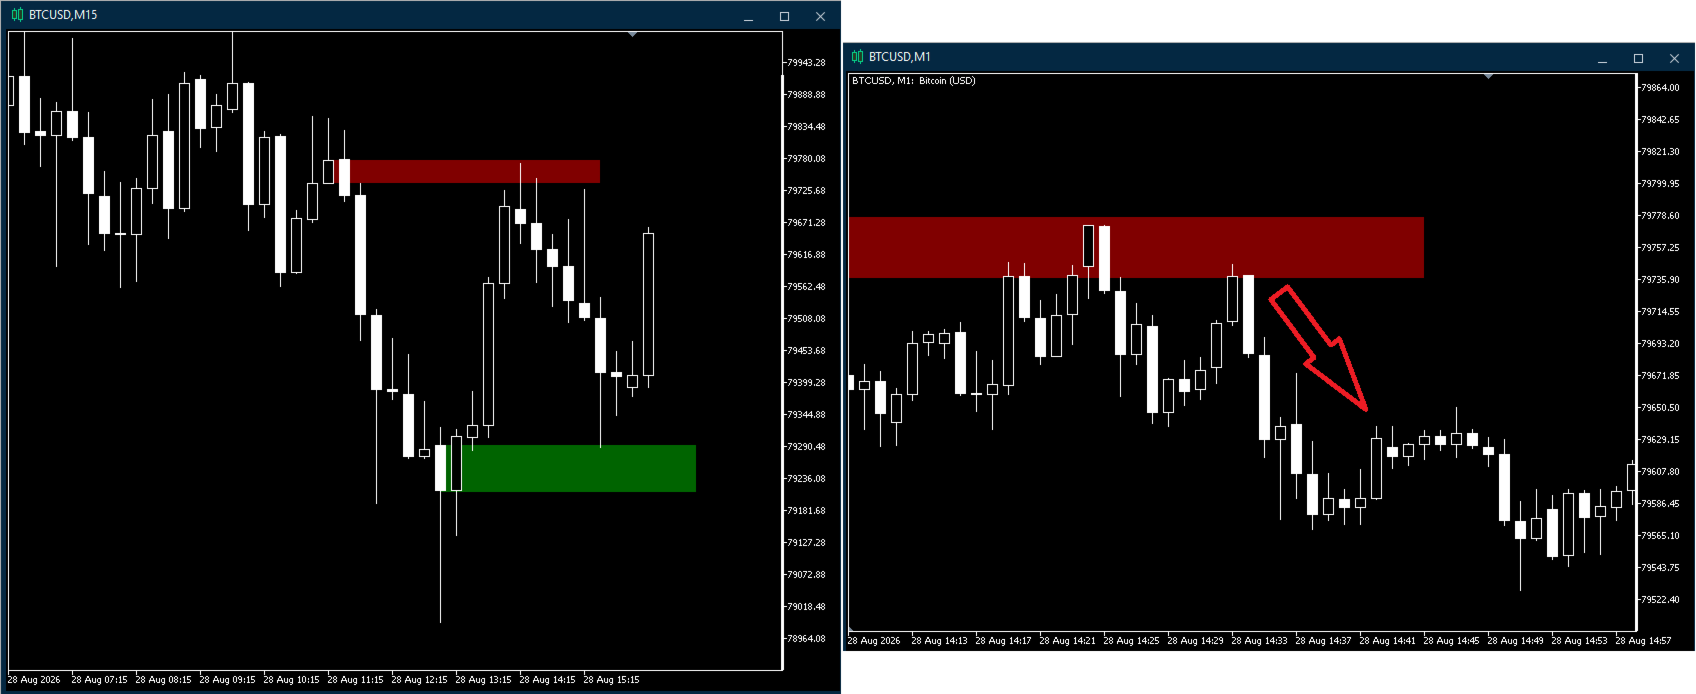
One of the key features of the Gap Zone Highlighter is its multi-timeframe synchronization. Gap zones detected on higher timeframes can automatically be displayed on lower timeframe charts. This allows traders to keep important higher-timeframe price areas visible while performing their analysis or looking for entries on a lower timeframe.
Automatic Buy & Sell Gap Detection
The indicator analyzes closed candles on the selected source timeframe and identifies two different types of gaps:
Buy Gap: A bullish candle following a bearish candle can generate a Buy Gap when its closing price exceeds the opening price of the previous bearish candle.
Sell Gap: A bearish candle following a bullish candle can generate a Sell Gap when its closing price falls below the opening price of the previous bullish candle.
Once detected, the corresponding price range is automatically stored and can be visualized as a colored zone on the chart.
Multi-Timeframe Zone Synchronization
The Gap Zone Highlighter is designed for traders who analyze several timeframes.
A chart can be configured as a source timeframe, where new Gap Zones are detected and stored. Lower timeframe charts can then automatically import and display stored zones from all higher source timeframes.
For example, you can detect and store zones on higher timeframes while using a lower timeframe for detailed chart analysis. This helps keep the chart focused while still providing important higher-timeframe context.
The indicator therefore supports separate configurations for:
- Source charts – detect, store and optionally display newly created Gap Zones.
- Display charts – display synchronized Gap Zones originating from higher timeframes.
- Mixed configurations – combine detection, own-zone visualization and higher-timeframe synchronization according to your workflow.
Automatic Zone Invalidation
Gap Zones do not remain on the chart indefinitely.
The indicator monitors closed candles and automatically removes a zone once its predefined invalidation condition has been met:
Buy Zone: The zone is invalidated when a bearish candle closes below the bottom of the zone.
Sell Zone: The zone is invalidated when a bullish candle closes above the top of the zone.
This keeps outdated zones from unnecessarily cluttering the chart.
Zone Retest Alerts
Optional alerts can notify you when price penetrates a Gap Zone without invalidating it.
For a Buy Zone, a retest is detected when a bearish candle trades below the bottom boundary but closes back above it. For a Sell Zone, the opposite logic applies: a bullish candle trades above the upper boundary but closes back below it.
Alerts can be enabled or disabled, and the sound file used for the notification can be customized.
Clean and Customizable Visualization
Buy and Sell Zones are displayed directly in the main chart as filled rectangles. Their appearance can be adjusted to match your personal chart template.
You can independently select the colors used for Buy and Sell Zones and adjust their transparency. The indicator also includes a master switch that allows all zone visualization to be enabled or disabled.
Main Features
- Automatic detection of Buy and Sell Gaps
- Automatic visualization of detected Gap Zones
- Dynamic detection based on the timeframe of the chart
- Multi-timeframe synchronization from higher to lower timeframes
- Separate Source and Display configurations
- Automatic removal of invalidated zones
- Optional alerts for Gap Zone retests
- Adjustable Buy and Sell Zone colors
- Adjustable zone transparency
- Customizable zone length
- Adjustable number of stored zones per timeframe and direction
- Optional debug output for advanced users
Indicator Settings
The Gap Zone Highlighter provides several settings that allow you to adapt its behavior to your trading setup:
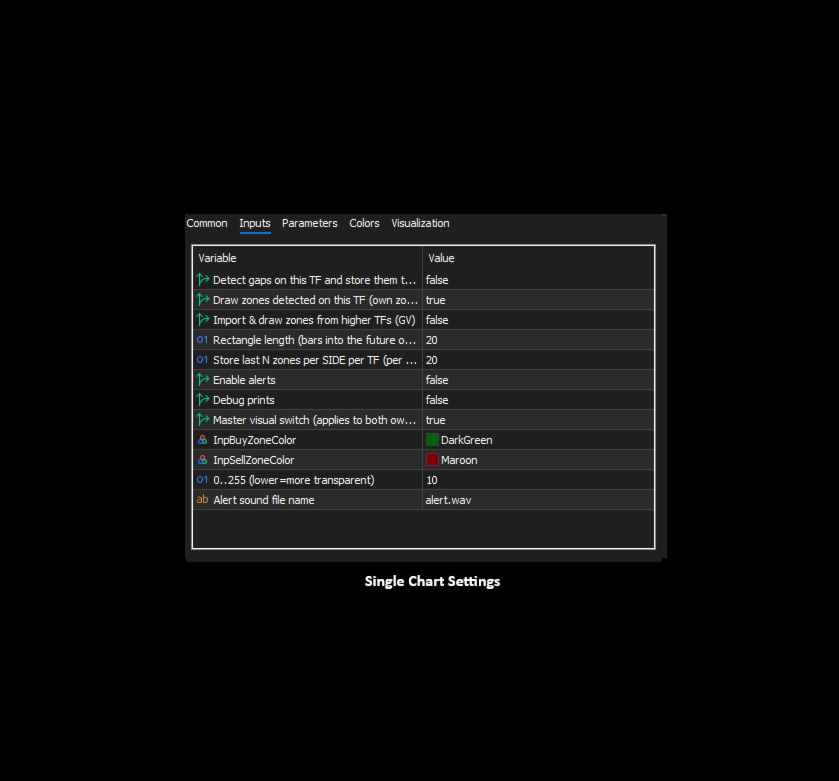
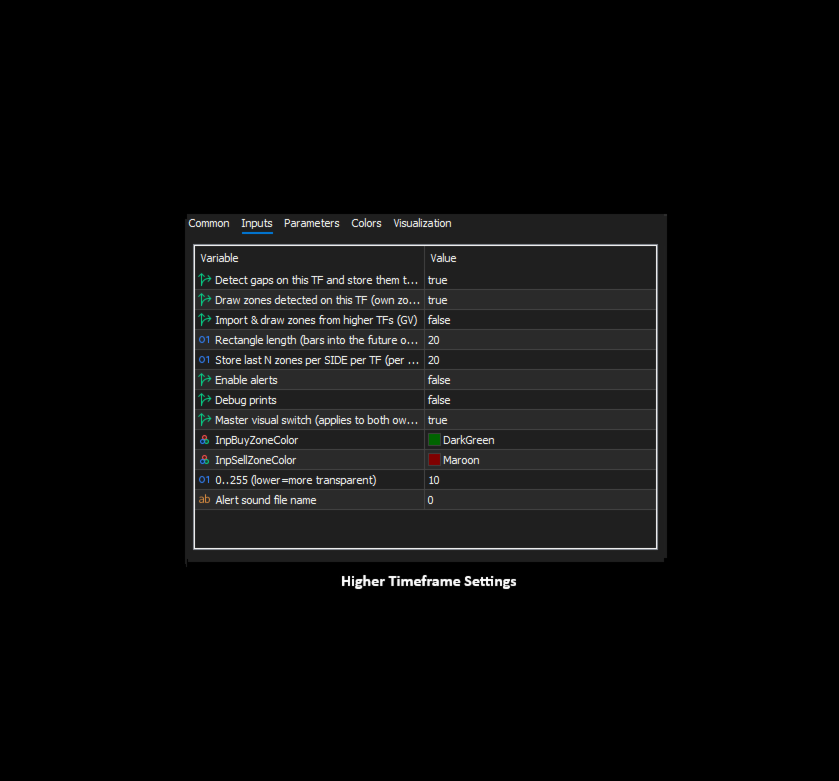
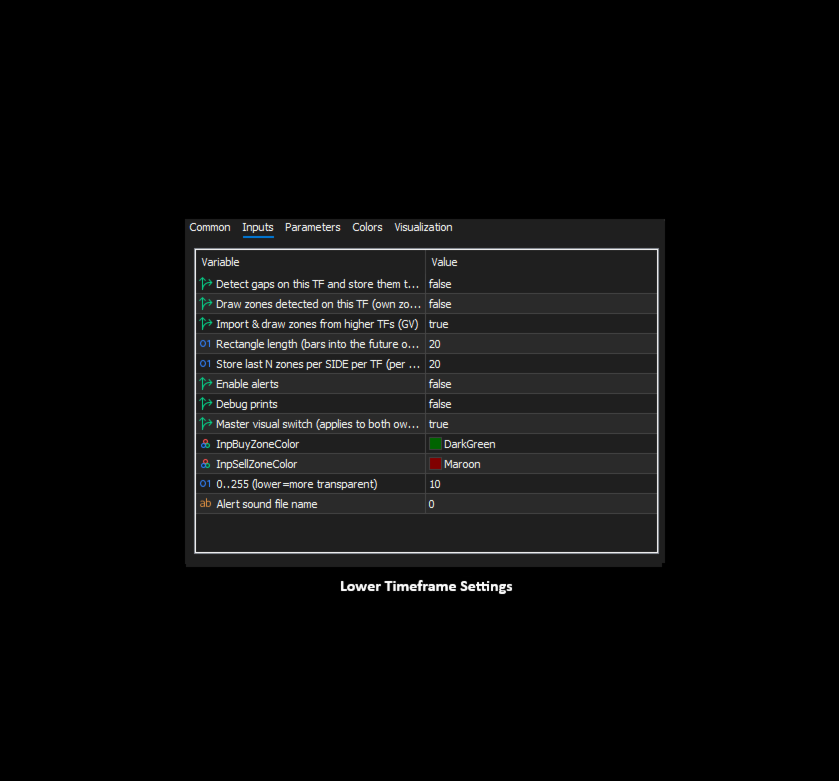
Detect and Store Zones – Enables Gap detection on the current timeframe and stores detected zones for synchronization with lower timeframe charts.
Draw Own Zones – Determines whether zones detected on the current timeframe are also displayed directly on that chart.
Sync Zones – Imports and displays stored Gap Zones from higher timeframes.
Zone Length Bars – Defines how many bars into the future a newly detected zone extends, based on its original source timeframe.
Store Zones Per TF – Defines the maximum number of recent zones stored per direction (Buy/Sell), timeframe and symbol. Older zones are automatically removed when the limit is exceeded.
Enable Alerts – Enables or disables alerts when a valid Gap Zone retest is detected.
Alert Sound – Selects the sound file used for alerts.
Draw Zones – Master switch for displaying Gap Zones.
Buy Zone Color / Sell Zone Color – Defines the individual colors used for Buy and Sell Zones.
Zone Alpha – Adjusts the transparency of the displayed zones.
Debug – Enables additional information in the MetaTrader log for troubleshooting or advanced configuration.
Gap Zone Highlighter helps you keep important Gap Zones visible across multiple timeframes – automatically, clearly and without having to mark every area manually.