VPEO Volume Statistics

  • Indicateurs
  • Paolo Ruffini
    Paolo Ruffini
    Je suis trader avec plus de 15 ans d’expérience opérationnelle sur les marchés Forex et des matières premières, avec un intérêt particulier pour la dynamique de la liquidité, la pression volumétrique et la structure directionnelle des mouvements de prix.
  • Version: 1.20
VPEO Volume Statistics

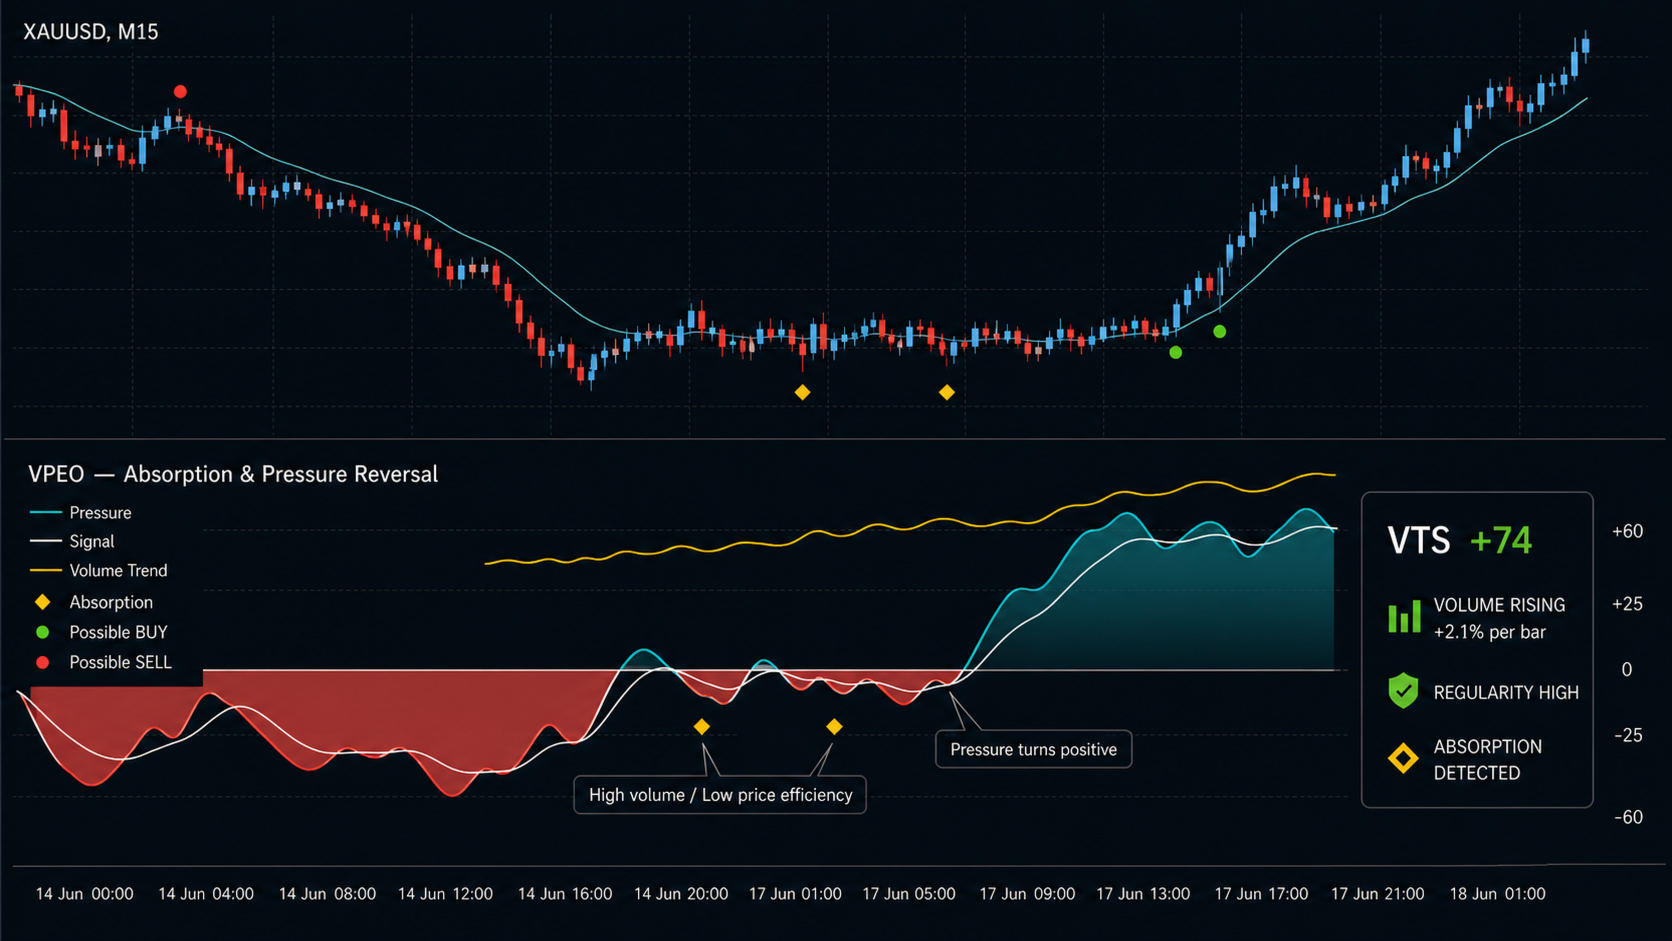
VPEO Volume Statistics is a customizable volume-analysis indicator for MetaTrader 5. VPEO stands for Volume Pressure and Efficiency Oscillator. The indicator combines directional volume pressure, a statistical analysis of rising or falling market participation, volume-efficiency conditions, optional BUY and SELL markers, and a compact dashboard in one interface.

The indicator is designed to answer three separate questions:

  1. Is current volume pressure mainly positive or negative?

  2. Is overall trading activity increasing, decreasing, or remaining stable?

  3. Is high activity producing directional price movement, or is price showing low efficiency relative to volume?

VPEO Volume Statistics is an analytical indicator. It does not open, modify, or close trades. It does not include position sizing, stop-loss, take-profit, or money-management functions. All displayed entry markers are technical conditions intended for chart analysis, testing, and integration into a separate trading process.

VPEO Pressure Wave

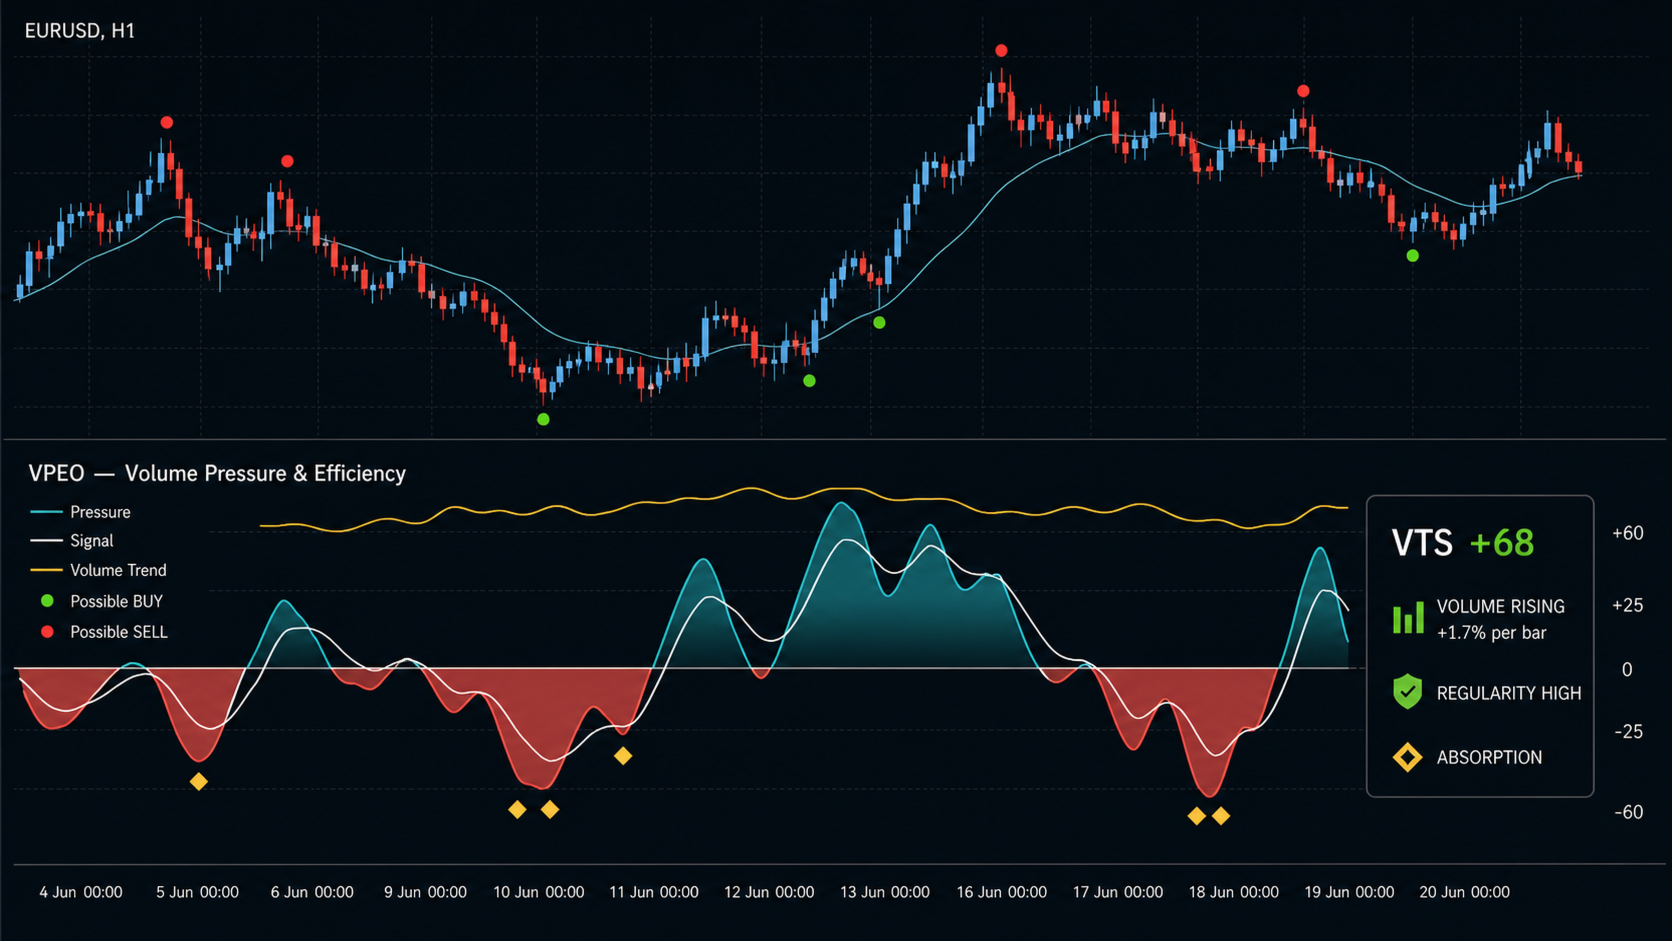
The main VPEO wave measures signed volume pressure on a scale from -100 to +100.

The calculation combines candle-body direction with the location of the close inside the candle range. This helps distinguish a candle that closes with directional conviction from a candle that contains substantial activity but finishes near the middle of its range. Volume is transformed logarithmically to reduce the excessive influence of isolated extreme values.

The resulting directional flow is normalized using the median and median absolute deviation over a configurable historical window. This robust approach is less sensitive to occasional volume spikes than a standard mean and standard-deviation calculation.

General interpretation:

  • Positive VPEO values indicate positive directional volume pressure.

  • Negative VPEO values indicate negative directional volume pressure.

  • Values close to zero indicate limited directional pressure or balanced activity.

  • Increasing absolute values indicate that directional pressure is becoming more unusual relative to recent history.

  • A return toward zero indicates that directional pressure is normalizing or losing intensity.

The default display is a continuous colored wave. Users can switch to a classic color histogram from the Inputs tab. The bullish, bearish, neutral, signal, trend, and absorption colors are individually configurable.

Signal Line

A smoothed signal line is calculated from the VPEO pressure wave. Its period is configurable and defaults to 5 bars.

The signal line helps identify changes in short-term pressure. Crosses between the VPEO wave and its signal line are used as one component of the optional entry-marker logic. A cross alone is not treated as a complete market decision in the default Balanced mode. Additional participation and price-trend conditions are applied before a marker is displayed.

Statistical Volume Trend Score

The Volume Trend Score, or VTS, measures whether volume is statistically rising or falling over the selected analysis period.

The indicator applies linear regression to logarithmic volume. The regression slope is evaluated relative to its estimated variability and transformed into a bounded score between -100 and +100. The VTS line is then smoothed to improve readability.

VTS measures the direction of market participation, not the direction of price:

  • A positive VTS indicates that volume is generally increasing.

  • A negative VTS indicates that volume is generally decreasing.

  • A VTS near zero indicates stable or statistically unclear volume behavior.

  • Values above the moderate or strong positive levels indicate increasingly consistent volume expansion.

  • Values below the corresponding negative levels indicate increasingly consistent volume contraction.

The dashboard also displays the estimated average percentage change in volume per bar. This value is derived from the regression slope and provides a more intuitive description of the current participation trend.

Regression regularity is reported as LOW, MEDIUM, or HIGH. This classification is based on the regression R-squared value. A high value means the recent volume trend is comparatively consistent. A low value means volume is irregular, even if the current slope is positive or negative.

Absorption and Low-Efficiency Activity

The indicator can mark potential absorption conditions.

An absorption marker requires two elements:

  • volume that is unusually high relative to its recent robust distribution;

  • limited candle-body movement relative to the complete high-low range.

This combination means that considerable activity occurred while the candle produced limited directional progress. It may represent absorption, two-sided trading, indecision, or an exhaustion phase. The marker does not determine bullish or bearish direction by itself and should be interpreted together with price structure, VPEO pressure, and the Volume Trend Score.

The absorption lookback, minimum volume z-score, maximum price efficiency, marker color, and marker position are all configurable.

Optional BUY and SELL Markers

BUY markers are displayed as green dots below price bars. SELL markers are displayed as red dots above price bars. Their colors, size, ATR-based distance from price, and historical display range can be changed.

Three signal modes are available.

Cross Only

This is the least restrictive mode. It uses a VPEO signal-line cross or pressure-threshold event together with the minimum pressure requirement. It produces more signals but does not require confirmation from the statistical volume trend or price trend.

Balanced

Balanced is the default mode. It requires:

  • a qualifying VPEO cross or pressure-threshold event;

  • the configured minimum directional-pressure value;

  • a Volume Trend Score above the configured minimum;

  • price alignment with the internal EMA when the price-trend filter is enabled;

  • no absorption condition on the same bar when absorption blocking is enabled;

  • compliance with the minimum number of bars between consecutive signals;

  • compliance with the optional maximum-spread filter.

For a BUY marker, pressure must be positive and price must be above the internal EMA when the trend filter is enabled. For a SELL marker, pressure must be negative and price must be below the EMA. The minimum VTS condition remains positive for both directions because VTS measures expanding participation rather than bullish or bearish direction.

Strict

Strict mode applies all Balanced conditions and adds:

  • a minimum positive volume anomaly;

  • a minimum regression R-squared value.

This mode is intended for users who prefer fewer conditions with stronger volume expansion and more consistent volume-trend statistics.

Closed-Bar Behavior

Closed-bar signal calculation is enabled by default. Entry markers are evaluated after the relevant candle has closed and do not use future price data.

The VPEO wave and dashboard can still update on the active candle when current-bar updating is enabled. The open candle is therefore expected to change as new ticks arrive. Users who require a completely static visual display can disable current-bar updating.

The indicator also includes an optional alert-on-attach setting. It is disabled by default to prevent an alert from being generated immediately for a signal that already existed before the indicator was added to the chart.

Volume Source Selection

Three volume-source modes are available:

  • Auto Volume: uses real trade volume when the feed provides a positive value and otherwise falls back to tick volume.

  • Tick Volume: always uses the number of price updates reported for each bar.

  • Real Volume: uses reported trade volume, with an optional fallback to tick volume when real volume is unavailable.

On decentralized Forex and many CFD symbols, tick volume may be the only available volume source. Exchange-traded instruments may provide real trade volume. Volume data can differ between brokers, servers, and liquidity feeds. Users should therefore validate the indicator with the same data source they intend to use in practice.

The active source is shown in the dashboard as REAL, TICK, or REAL N/A.

Dashboard

The optional dashboard displays a compact statistical summary:

  • current Volume Trend Score;

  • volume state: rising strongly, rising, stable, falling, or falling strongly;

  • estimated percentage change in volume per bar;

  • regression regularity;

  • active volume source.

Dashboard visibility, corner, horizontal and vertical offset, text color, background color, and border color are customizable.

Reference Levels

The oscillator uses five reference levels:

  • strong positive level;

  • moderate positive level;

  • zero line;

  • moderate negative level;

  • strong negative level.

The default moderate level is 25 and the default strong level is 60. These levels help describe pressure and volume-trend intensity. They are analytical references rather than automatic overbought or oversold levels.

Alerts

The indicator supports optional:

  • terminal popup alerts;

  • mobile push notifications;

  • email alerts;

  • sound alerts.

All alert channels are disabled by default. Alerts use the selected signal mode and the same conditions as the chart markers. The sound file can be changed through the Inputs tab.

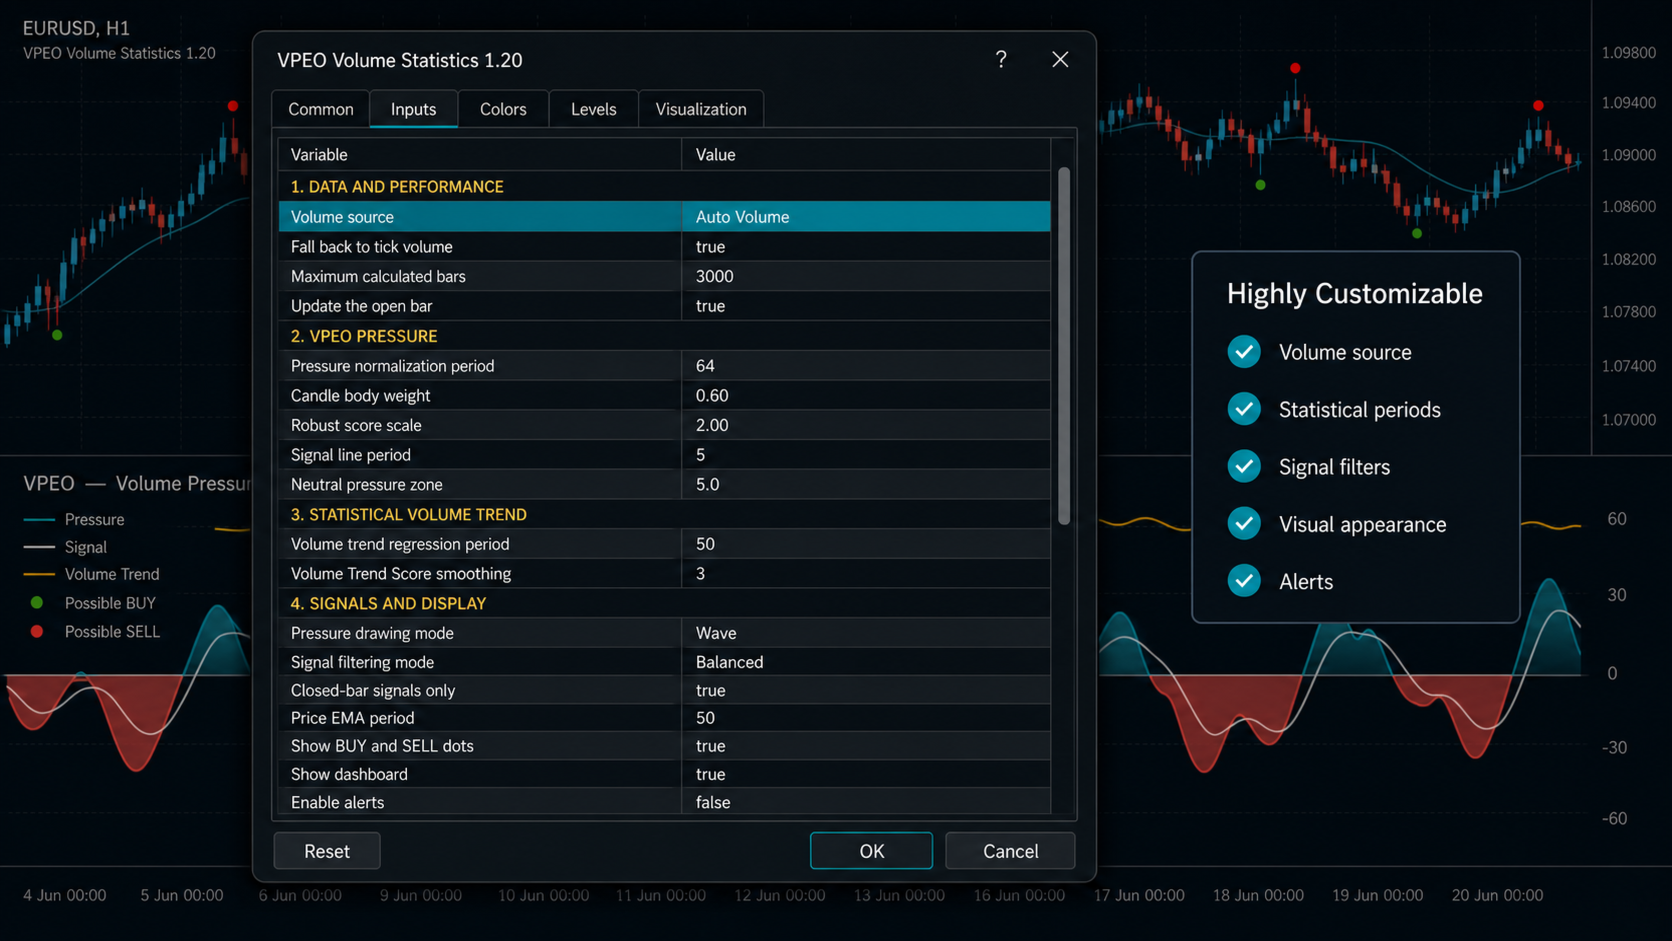
Default Configuration

The default setup is a balanced starting point for liquid symbols, particularly on M15 to H1 charts:

  • Auto volume source with tick-volume fallback;

  • 3,000 calculated bars;

  • 64-bar VPEO normalization period;

  • 0.60 candle-body weight;

  • 2.00 robust pressure scale;

  • 5-bar signal-line period;

  • 5-point neutral zone;

  • 50-bar statistical volume-trend period;

  • 3-bar VTS smoothing;

  • moderate and strong reference levels at 25 and 60;

  • 50-bar absorption analysis period;

  • absorption volume z-score of 2.0;

  • maximum absorption price efficiency of 0.20;

  • Balanced signal mode;

  • minimum entry pressure of 10;

  • minimum Volume Trend Score of 15;

  • EMA 50 price-trend filter;

  • 5-bar minimum distance between signals;

  • ATR 14 entry-dot positioning with a 0.25 ATR offset;

  • closed-bar signals enabled;

  • continuous pressure-wave display;

  • dashboard enabled;

  • alerts disabled.

These parameters are starting values, not universal settings. Lower timeframes may require longer normalization, stronger thresholds, or a longer cooldown to reduce noise. Higher timeframes may use shorter periods when users want a more responsive display. Parameter changes should be evaluated on separate calibration and out-of-sample periods rather than optimized only on one historical interval.

Interpreting Common Conditions

Price rising, positive VPEO, and rising VTS indicate that positive directional pressure is accompanied by expanding participation.

Price rising while VTS falls indicates that the advance is occurring with decreasing participation. This is not an automatic reversal signal, but it describes weaker volume confirmation.

Price falling, negative VPEO, and rising VTS indicate increasing participation in a negative directional move.

Price falling while VTS also falls indicates that the decline is occurring with contracting activity. This can be consistent with a low-participation pullback, but market structure should be considered.

Rising VTS with VPEO near zero indicates increasing activity without clear directional efficiency. When an absorption marker is also present, the market is processing high activity with limited candle-body progress.

A strong VPEO value combined with a weak or negative VTS means that the current directional bar is notable relative to recent flow, but broader participation is not expanding consistently.

Integration with Expert Advisors

The indicator exposes data buffers that can be accessed through iCustom:

  • Buffer 0: VPEO pressure;

  • Buffer 1: VPEO color index;

  • Buffer 2: signal line;

  • Buffer 3: Volume Trend Score;

  • Buffer 4: zero line;

  • Buffer 5: absorption condition;

  • Buffer 6: BUY signal, value 1.0 on a qualifying bar;

  • Buffer 7: SELL signal, value 1.0 on a qualifying bar.

For closed-bar operation, an Expert Advisor should normally read BUY and SELL buffers at shift 1. EMPTY_VALUE indicates that no signal is present on the selected bar.

VPEO Volume Statistics does not include a trading engine. Any Expert Advisor using its buffers must separately implement order validation, position sizing, stop management, spread and slippage controls, account-mode handling, and risk limits.

Suggested Workflow

  1. Select the required volume source or keep Auto Volume enabled.

  2. Start with the default Balanced mode.

  3. Confirm that the dashboard reports the expected volume source.

  4. Observe the relationship between price, VPEO pressure, and the Volume Trend Score.

  5. Review absorption markers in the context of nearby support, resistance, or consolidation.

  6. Adjust normalization and threshold parameters only after collecting enough observations.

  7. Test the selected configuration across different market conditions.

  8. Include spread, commission, slippage, and risk-management rules in any strategy evaluation.

Important Information

VPEO Volume Statistics is intended for technical and statistical market analysis. It does not predict future prices and does not guarantee trading results. BUY and SELL dots are conditional chart markers, not personalized investment advice or complete trading instructions.

Results depend on symbol characteristics, timeframe, market regime, broker data, and the selected volume source. Historical behavior may not continue in future conditions. Users remain responsible for evaluating the indicator, defining risk controls, and deciding whether any displayed condition is suitable for their own trading process.
Produits recommandés
VWAP Simple
Deibson Carvalho
4.24 (29)
The Volume Weighted Average Price is similar to a moving average, except volume is included to weight the average price over a period.    Volume-Weighted Average Price [VWAP] is a dynamic, weighted average designed to more accurately reflect  a security’s true average price over a given period . Mathematically, VWAP is the summation of money (i.e., Volume x Price) transacted divided by the total volume over any time horizon, typically from market open to market close. VWAP reflects the capitali
FREE
SMC Structure Markup
Seyed Mohammad Hosseini Hejazi
4.67 (15)
Overview The Smart Money Structure Markup Indicator for MetaTrader 5 is a powerful tool designed to help traders identify key market structures based on popular Smart Money Concepts (SMC) strategies. This indicator detects micro-market structures, providing insights into price movements and potential trend changes. It highlights important elements such as valid Break of Structure (BOS), Change of Character (CHoCH), and Inducement (IDM), helping traders to make informed decisions. Key Features Ma
FREE
Weis Waves est un indicateur technique développé par David Weis, inspiré des principes de Richard Wyckoff. Contrairement au volume traditionnel, affiché barre par barre, Weis Waves cumule le volume en “vagues” haussières ou baissières, redémarrant le comptage dès que la direction du prix change. Cette approche permet aux traders de visualiser clairement la véritable force des mouvements du marché , car chaque vague reflète l’intensité du volume derrière une série de bougies. Caractéristiques
FREE
KVO Indicator
Saullo De Oliveira Pacheco
Klinger Volume Oscillator (KVO) - A Powerful Trend & Momentum Indicator This is an enhanced version of the Klinger Volume Oscillator (KVO) , a widely used indicator designed to help traders identify momentum shifts, trend direction, and overbought/oversold conditions in the market. How the KVO Indicator Works: Volume-Based Trend Identification – Unlike traditional oscillators that rely solely on price movements, the KVO uses both price and volume to detect market trends and momentum shifts .
FREE
VWAP + Volume Profile Combined Indicator FREE Launch Offer OVERVIEW Professional combination of VWAP (Volume Weighted Average Price)  and Volume Profile in a single MT5 indicator. This powerful tool  combines two of the most respected institutional trading tools  into one seamless display. KEY FEATURES 1. VWAP with 6 calculation modes 2. Volume Profile with Value Area analysis 3. Point of Control identification 4. Standard deviation bands 5. Dynamic color changing 6. Separate buy/sell vol
FREE
Graphic Alignment Context
Ricardo Alexandre Laurentino
The Graphic Alignment Context (GAC) Technical Indicator measures the vertical difference of the simple average price of a financial instrument in the context of three different timeframes determined by a defined number of bars or candles (periods) to determine the strength of the buy or sell trend. sale. Ascending average prices indicate Buying strength (1), Descending average prices indicate Selling strength (-1) and any scenario different from the previous two conditions indicates Neutrality
FREE
XAU Anchored VWAP Pull H4 Expert Advisor for MetaTrader 5 — Gold / XAUUSD focus Version: 1.00 What it is XAU Anchored VWAP Pull H4 is an Expert Advisor for gold on the H4 chart. Anchored VWAP pullback continuation style for gold H4. Built for structured automated participation — not grid , not martingale . Evaluate on your broker and risk profile before any live use. This product is a technical system . Exact thresholds and entry equations remain internal product design and are not published he
FREE
Weis Waves
Flavio Javier Jarabeck
2.83 (18)
The original author is David Weis, an expert in the Wyckoff Method. The Weis Wave is a modern adaptation of the 1930's Wyckoff Method, another expert in Tape Reading techniques and Chart Analysis. Weis Waves takes market volume and stacks it into waves according to price conditions giving the trader valuable insights about the market conditions. If you want to learn more about this subject you can find tons of videos in YouTube. Just look for "The Wickoff Method", "Weis Wave" and "Volume Spread
FREE
White Weis Volume Ticks
Ricardo Almeida Branco
5 (4)
White Weis Volume This indicator shows the sum of the volume in each wave, bulish or bearish, as idealized by David Weis , but it brings an important addition , which is the marking of the bar with the highest volume of the wave (White Bar)! In coding the indicator, it was sought to optimize the code to require minimal processing during use and not to overload mt5. The indicator can be used for pre-trading analysis and study, where the trader analyzes possible points of support and resistance
VWAP Indicator
LUC JACOBUS A VERHEECKE
4.11 (27)
Volume Weighted Average Price (VWAP) The volume weighted average price (VWAP) is a  trading   benchmark  used by traders that gives the average price a security has traded at throughout the day, based on both volume and price. It is important because it provides traders with insight into both the trend and value of a security. This indicator VWAP V2 is free and is the manual version of the extended Easy VWAP indicator (30 Euro), where the date and time properties are automatically entered. With
FREE
Market Momentum
Flavio Javier Jarabeck
4.43 (7)
The Market Momentum indicator is based on the Volume Zone Oscillator (VZO), presented by Waleed Aly Khalil in the 2009 edition of the International Federation of Technical Analysts journal, and presents a fresh view of this market valuable data that is oftenly misunderstood and neglected: VOLUME. With this new approach of "seeing" Volume data, traders can infer more properly market behavior and increase their odds in a winning trade. "The VZO is a leading volume oscillator; its basic usefulness
FREE
Daily VWAP Indicator
Rafael Gazzinelli
5 (7)
Daily VWAP Indicator (Volume Weighted Average Price) Special Deal! Leave a review and get the indicator  Long & Short Cointegration Analyzer for free — just send me a message! Description The Daily VWAP (Volume Weighted Average Price) indicator is an essential tool for traders seeking to identify the true average price of an asset throughout the day, adjusted by traded volume. Primarily used by institutional and professional traders, the daily VWAP serves as a reference point to identify the av
FREE
==================================================================== SMT DIVERGENCE - NASDAQ vs S&P500 (NAS100 / US500) MQL5 Market Product Description ==================================================================== PRODUCT NAME: SMT Divergence Nasdaq vs S&P500 | Smart Money Index Scalper SHORT DESCRIPTION (max 63 chars): Spot Nasdaq reversals using SMT Divergence with S&P500 ---------------------------------------------------------------------- FULL DESCRIPTION ---------------------
FREE
Super Trend eu
Emin Ulucanli
4.83 (6)
SUPERTREND ; C'est un indicateur de suivi de tendance basé sur l'ATR SuperTrend créé par Olivier Seban. Il peut être utilisé pour détecter les changements de direction de la tendance et localiser les arrêts. Lorsque le prix tombe en dessous de la courbe indicatrice, il devient rouge et indique une tendance à la baisse. À l'inverse, lorsque le prix se déplace au-dessus de la courbe, l'indicateur passe au vert, indiquant une tendance haussière. Comme d'autres indicateurs, il fonctionne bien sur Su
FREE
Cloud Trend Martrix
Alvaro Garcia Batelli
Cloud Trend Matrix: The Trend Indicator That Adapts to the Market Tired of indicators that work well in strong trends but generate dozens of false signals in sideways markets? The Cloud Trend Matrix was designed to solve this exact problem. It's not just another trend follower; it's an intelligent system that reads market volatility and adapts its entry triggers to deliver signals with a higher probability of success. ️ The Concept: A Low-Latency Cloud Unlike traditional indicators, the Cloud T
FREE
1. Overview The Scalping PullBack Signal indicator is a powerful technical analysis tool designed to help traders identify scalping opportunities based on potential pullback and reversal signals. This tool is particularly useful on lower timeframes (below 15 minutes) but can also be applied on higher timeframes for longer-term trades. This indicator integrates several key analytical components, providing a comprehensive view of trends and potential entry/exit points, helping you make quick and e
FREE
PivoTrack VP Un indicateur de profil de volume ancré sur les pivots pour MetaTrader 5 qui cartographie la distribution du volume entre des Pivot Hauts et Pivot Bas consécutifs, révélant les zones d'acceptation et de rejet du prix. PivoTrack VP est un indicateur d'analyse de volume pour MetaTrader 5. Il détecte automatiquement les points Pivot Haut et Pivot Bas sur n'importe quel graphique et génère un profil de volume complet pour chaque segment entre ces points. L'indicateur affiche le Point de
FREE
Simple Weis Wave
Jean Jacques Huve Ribeiro
3.67 (3)
One of the best tools for analyzing volume, Weis Wave was idelized by David Weis, to facilitate the reading of directional flow. For the VSA method disciples it is an evolution of the practices created by Richard Wycoff, facilitating a predictive reading of the market, always seeking an accumulation and distribution of the negotiated contracts. Cumulative wave volume  Range of wave ( removed) Average Wave volume Ref "Tim Ord lectures" ( removed)
FREE
Umagads Candle Timer MT5 : Minuteur de précision pour les traders disciplinés Sur les marchés financiers volatils, savoir exactement quand une bougie va se fermer fait toute la différence. Umagads Candle Timer MT5 est un utilitaire haute performance conçu pour les traders exigeant une précision absolue. Que vous fassiez du scalping en M1 ou du swing trading sur graphiques journaliers, cet outil place le compte à rebours exactement là où vous en avez besoin pour garder une longueur d'avance. Cara
FREE
LC Multi Session VWAP
Juergen Jakob Preusse
LC Multi Session VWAP L'activité des marchés évolue en permanence à mesure que les marchés financiers mondiaux passent de la session Asia à London , puis à New York . Chaque session développe son propre comportement des prix, son profil de liquidité et son équilibre de marché. LC Multi Session VWAP a été conçu pour mettre ces différences en évidence. Au lieu d'utiliser un seul VWAP pour l'ensemble de la journée, l'indicateur calcule un Volume Weighted Average Price (VWAP) indépendant pour chacun
FREE
Time Dashboard MT5 is a powerful and user-friendly MetaTrader 5 indicator designed to provide real-time time zone and clock information directly on your trading chart. Ideal for forex traders and global market participants, this tool displays server time, local time, and the time difference between them, enhancing your ability to manage trades across different time zones. Key Features : Real-Time Time Display : Shows current server time, local time, and their respective time zones with precise o
FREE
MIDAS Super VWAP
Flavio Javier Jarabeck
4.27 (11)
Imagine VWAP, MVWAP and MIDAS in one place... Well, you found it! Now you can track the movement of Big Players in various ways, as they in general pursue the benchmarks related to this measuring, gauging if they had good execution or poor execution on their orders. Traders and analysts use the VWAP to eliminate the noise that occurs throughout the day, so they can measure what prices buyers and sellers are really trading. VWAP gives traders insight into how a stock trades for that day and deter
FREE
ADX consolidado
OTAVIO AGUIAR CAMPOS Aguiar
5 (3)
Mostra a média móvel quando ADX > 20 e pinta de verde ou vermelho quando os valores de ADX estão subindo indicando tendência. Quando o ADX é menor que 20 indica movimento lateral consolidado. O indicador não define pontos de entrada, somente mostra a média colorida quando a tendência está se fortalecendo. Faz parte do grupo de indicadores do Indicador Tavim.
FREE
Daily Volatility Tracker   is a practical and lightweight indicator designed to help traders monitor and analyze market volatility based on historical daily price movements. Whether you're a day trader, swing trader, or scalper, understanding how much a market moves per day is critical for: Choosing the right pairs to trade Setting accurate stop-loss and take-profit levels Adapting to changing market conditions MT4 Version -  https://www.mql5.com/en/market/product/134958/ Join To Learn Market De
FREE
Value Chart Candlesticks
Flavio Javier Jarabeck
4.57 (14)
The idea of a Value Chart indicator was presented in the very good book I read back in 2020 , " Dynamic Trading Indicators: Winning with Value Charts and Price Action Profile ", from the authors Mark Helweg and David Stendahl. The idea is simple and the result is pure genius: Present candlestick Price analysis in a detrended way! HOW TO READ THIS INDICATOR Look for Overbought and Oversold levels. Of course, you will need to test the settings a lot to find the "correct" one for your approach. It
FREE
Midas VWAP
Paulo Henrique Faquineli Garcia
4 (2)
Volume Weighted Average Price (VWAP) is a trading benchmark commonly used by Big Players that gives the average price a Symbol has traded throughout the day. It is based on both Volume and price. This indicator contains Daily VWAP and MIDAS' VWAP, which means you are able to anchor the beggining of MIDAS' calculations and, therefore you will be able to use this methodology to study price versus volume moves after anchor point. You will be able to anchor up to 3 HIGH MIDAS VWAP's and 3 LOW. Wish
FREE
GDXM Session Open Line PO3
Gustavo Barros Alexandre D Almeida
5 (1)
This indicator is a specialized utility for traders following the ICT (Inner Circle Trader) methodology, specifically focusing on the Power of Three (PO3) concept: Accumulation, Manipulation, and Distribution. The ICT PO3 Open Line automatically identifies and plots critical opening prices from specific market sessions, allowing you to visualize price action relative to the "True Open" of the day or specific sessions. Key Features 1. Daily PO3 Open Levels The indicator tracks and draws horizonta
FREE
Fixed Volume Profile
Carlos Pascual Perez Maturano
This indicator, titled "Fixed Volume Profile.mq5", is a custom tool for MetaTrader 5 (MQL5) designed to calculate and display a Volume Profile over a user-defined fixed time range. The Volume Profile shows the distribution of trading volume at different price levels during a specific period, helping to identify areas of high activity (such as Points of Control or POCs) and volume-based support/resistance areas. Main Functionality: Interactive Range: The indicator creates two vertical lines on
FREE
Koala Trend Line
Ashkan Hazegh Nikrou
4.33 (6)
Koala Trend Line Upgraded To Version 1.2 Last Upgrade Improvement : New Parameter Added that allow user to connect trend line to 2nd or 3th or Xth highest or lowest point. My Request : **Dear Customers Please Release Your Review On Koala Trend Line, And Let Me Improve By Your Feed Backs. Join Koala Trading Solution Channel in mql5 community to find out the latest news about all koala products, join link is below : https://www.mql5.com/en/channels/koalatradingsolution WHAT ABOUT OTHER FREE
FREE
Stackable VWAP
Flavio Javier Jarabeck
3.5 (4)
Volume Weighted Average Price (VWAP) is a trading benchmark commonly used by Big Players that gives the average price a Symbol has traded throughout the day. It is based on both Volume and price. Additionally we put in this indicator the MVWAP (Moving Volume Weighted Average Price). For those who do not know the usage and the importance od this indicator I recommend a great article about this subject at Investopedia ( https://www.investopedia.com/articles/trading/11/trading-with-vwap-mvwap.asp
FREE
Les acheteurs de ce produit ont également acheté
Ce produit a été mis à jour pour le marché 2026 et optimisé pour les dernières versions de MT5. AVIS DE MISE À JOUR DU PRIX : Smart Trend Trading System est actuellement disponible à $99 . Le prix passera à $199 après les 30 prochains achats . OFFRE SPÉCIALE : Après avoir acheté Smart Trend Trading System, envoyez-moi un message privé pour recevoir Smart Universal EA GRATUITEMENT et transformer vos signaux Smart Trend en trades automatisés. Smart Trend Trading System est un système de trading c
Trend Sniper X
Sarvarbek Abduvoxobov
5 (13)
Trend Sniper X est un indicateur de suivi de tendance multi-unités de temps pour MetaTrader 5 qui aide les traders à identifier la direction de la tendance et les points d'inversion potentiels avec clarté et précision. pour MT4: https://www.mql5.com/en/market/product/193245 Informations sur le prix : Le prix actuel est un prix promotionnel et est sujet à changement à mesure que les futures mises à jour et nouvelles fonctionnalités seront publiées. Chaîne Code2Profit Maîtrisez le marché grâce à l
Neuro Poseidon MT5
Daria Rezueva
4.85 (54)
Neuro Poseidon is a new indicator by Daria Rezueva. It combines precise trading signals with adaptive TP/SL levels - creating best possible trades as a result! Message me and get  Neuro Poseidon Assistant  as a gift to automize your trading process! What makes it stand out? 1. Proven profitability on all assets and timeframes 2. Only confirmed BUY and SELL signals present on the chart 3. Adaptive TP & SL levels generated by the software for each trade 4. Easy to understand - suitable for al
SuperScalp Pro
Van Minh Nguyen
4.63 (32)
SuperScalp Pro –  Système Professionnel de Scalping à Confluence Multicouche SuperScalp Pro est un système professionnel de scalping à confluence multicouche, conçu pour aider les traders à identifier des opportunités à plus forte probabilité grâce à des confirmations d'entrée plus claires, des niveaux de Stop Loss et de Take Profit basés sur l'ATR, ainsi qu'un filtrage flexible des signaux sur le XAUUSD, le BTCUSD et les principales paires de devises du Forex. Suivez la chaîne MQL5 officielle d
Welcome to ENTRY IN THE ZONE AND SMC MULTI TIMEFRAME Entry In The Zone and SMC Multi Timeframe is a real-time market analysis tool based on Smart Money Concepts (SMC), designed to analyze market structure, price direction, and key trading zones. It supports both Single-Timeframe Analysis and Multi-Timeframe Analysis, providing a clearer view of the overall market structure across multiple timeframes, with real-time BUY / SELL signals that do not repaint. It is designed to help filter trading opp
Commençons par être honnêtes. Aucun indicateur ne vous rendra rentable à lui seul. Si quelqu’un vous dit le contraire, il vous vend un rêve. Tout indicateur qui affiche des flèches parfaites d’achat/vente peut être rendu impeccable — il suffit de zoomer sur la bonne partie de l’historique et de capturer uniquement les trades gagnants. Nous ne faisons pas cela.  SMC Intraday Formula est un outil. Il lit la structure du marché pour vous, identifie les zones de prix à la probabilité la plus élevée
GoldenX Entry MT5
Kareem Abbas
5 (16)
GoldenX Entry est un indicateur MT5 doté d’un algorithme adaptatif Smart Entry Trend, d’un système de scoring des signaux, d’un détecteur de régime de marché et d’un filtre de volatilité. Chaque signal inclut un niveau d’entrée calculé, trois niveaux de Take-Profit (TP1, TP2, TP3) ainsi qu’un niveau de Stop-Loss. Il est construit sur plusieurs couches analytiques conçues pour s’adapter à différentes conditions de marché, combinant un système analytique multicouche avec un optimiseur intégré et u
Zoryk Gold
Reda El Koutbane
5 (7)
ZORYK — Système avancé de signaux XAUUSD pour MetaTrader 5 Vous connaissez certainement cette sensation. Vous passez du temps à analyser l’or. Vous attendez le bon point d’entrée. Vous ouvrez enfin la position, puis le prix commence immédiatement à évoluer contre vous. Vous fermez trop tôt, déplacez le Stop Loss ou hésitez pendant quelques secondes. Ensuite, le marché atteint exactement l’objectif que vous aviez initialement prévu, mais sans vous dans la position. Le problème n’était pas toujour
Divergence Bomber
Ihor Otkydach
4.89 (94)
De temps en temps, je trade moi-même selon ce système. Découvrez mon trading manuel « BOMBER » sur un compte réel : LIVE SIGNAL Chaque acheteur de cet indicateur reçoit également gratuitement : L’outil exclusif « Bomber Utility », qui accompagne automatiquement chaque opération de trading, fixe les niveaux de Stop Loss et de Take Profit, et clôture les positions selon les règles de la stratégie Des fichiers de configuration (set files) pour adapter l’indicateur à différents actifs Des set files
Superhero
Ihor Otkydach
5 (2)
L'indicateur SUPERHERO est un système de trading multidevises conçu selon un principe « tout compris ». Cet indicateur analyse le marché de manière autonome et fournit des signaux indiquant quand ouvrir et clôturer des positions. Il utilise des ordres Stop Loss et Take Profit. Le rapport R:R est de 1:1. De temps en temps, je passe moi-même des ordres en me basant sur les signaux de ce système, et voici les résultats que j'obtiens — SIGNAL EN DIRECT Ce système peut envoyer des notifications push
M1 Sniper MT5
Oleg Rodin
5 (6)
M1 SNIPER   est un système d'indicateurs de trading facile à utiliser. Il s'agit d'un indicateur à flèche conçu pour l'unité de temps M1. Cet indicateur peut être utilisé seul pour le scalping sur l'unité de temps M1 ou intégré à votre système de trading existant. Bien que conçu spécifiquement pour le trading sur l'unité de temps M1, ce système peut également être utilisé avec d'autres unités de temps. Initialement, j'avais conçu cette méthode pour le trading du XAUUSD et du BTCUSD. Cependant, j
Gold Entry Sniper
Tahir Mehmood
5 (19)
Gold Entry Sniper – Tableau de Bord ATR Multi-Unités de Temps pour Scalping et Swing Trading sur l'Or Gold Entry Sniper est un indicateur avancé pour MetaTrader 5 qui fournit des signaux d'achat/vente précis sur XAUUSD et autres actifs, basé sur la logique de Trailing Stop ATR et l' analyse multi-unités de temps . Caractéristiques et Avantages Clés Analyse Multi-Unités de Temps – Affiche les tendances en M1, M5, M15 sur un seul tableau. Trailing Stop Basé sur l'ATR – Ajuste automatiquement selon
UNIX Scalper — Gold Scalping Indicator for MetaTrader 5 UNIX Scalper is a focused Gold scalping indicator designed primarily for XAUUSD on M1, M2, M3, M5, M10 and M15. It gives the trader a clear BUY, SELL or WAIT decision together with the complete trade plan: Entry, Stop Loss, TP1 and TP2 . PRICE UPDATE NOTICE: Currently available for $199. The price will   increase to $399   after the next   30 purchases . The concept is simple: wait for the signal, follow the levels, move the Stop Loss to
Gann Made Easy   est un système de trading Forex professionnel et facile à utiliser qui est basé sur les meilleurs principes de trading en utilisant la théorie de mr. WD Gann. L'indicateur fournit des signaux d'ACHAT et de VENTE précis, y compris les niveaux Stop Loss et Take Profit. Vous pouvez échanger même en déplacement en utilisant les notifications PUSH. VEUILLEZ ME CONTACTER APRÈS L'ACHAT POUR RECEVOIR GRATUITEMENT DES INSTRUCTIONS DE TRADING ET D'EXCELLENTS INDICATEURS SUPPLÉMENTAIRES! V
La légende est de retour : Entry Points Pro 10. La relance de l'indicateur légendaire qui s'est maintenu 3 ans dans le Top-3 du MQL5 Market. Des centaines d'avis enthousiastes (589 sur les deux versions), des milliers de traders l'utilisent chaque jour, 31 000+ téléchargements de la démo   MT4+MT5 . J'ai lu chacun de vos avis publiés en cinq ans — et au lieu de promettre, j'ai intégré les réponses directement dans la version 10. Par un auteur présent sur les marchés depuis 1999, qui tient à l'ho
Atomic Analyst MT5
Issam Kassas
4.44 (54)
Ce produit a été mis à jour pour le marché 2026 et optimisé pour les dernières versions de MT5. AVIS DE MISE À JOUR DU PRIX : Atomic Analyst est actuellement disponible à $99 . Le prix passera à $199 après les 30 prochains achats . OFFRE SPÉCIALE : Après avoir acheté Atomic Analyst, envoyez-moi un message privé pour recevoir Smart Universal EA GRATUITEMENT et transformer vos signaux Atomic Analyst en trades automatisés. Atomic Analyst est un indicateur de trading Price Action sans repaint, san
FiboSniper Pro
Van Minh Nguyen
5 (2)
FiboSniper Pro – Système professionnel de trading Fibonacci Grid avec filtres multiples FiboSniper Pro est un système avancé d’indicateurs techniques de trading qui combine les Fibonacci Envelopes avec plusieurs niveaux de confirmation du marché, notamment ADX, EMA, RSI, ATR et des filtres horaires. En combinant l’analyse de la structure des prix, de la tendance, du momentum et de la volatilité, il aide les traders à identifier des opportunités d’entrée plus sélectives et de meilleure qualité, t
L'indicateur UZFX {SSS} Scalping Smart Signals v5.0 MT5 est un indicateur de trading haute performance sans « repaint », conçu pour les scalpers, les day traders et les swing traders qui recherchent des signaux précis et en temps réel sur des marchés très volatils. Développé par (UZFX-LABS), cet indicateur combine l'analyse de l'action des cours, la confirmation des tendances et un filtrage intelligent pour générer des signaux d'achat et de vente à forte probabilité, des signaux d'alerte et des
Axiom Matrix
Issam Kassas
5 (6)
AXIOM MATRIX MT5 PRIX DE LANCEMENT : $99 Axiom Matrix est disponible au prix de lancement de $99. Le prix passera à $199 après les 30 premiers achats. Après votre achat, envoyez-moi un message direct pour recevoir les instructions et réclamer votre bonus cadeau exclusif. Axiom Matrix est un scanner de marché professionnel multi-symboles et multi-timeframes, ainsi qu’un tableau de bord de décision pour MetaTrader 5. Il scanne votre Market Watch, analyse plusieurs timeframes, lit plusieurs moteurs
Advanced Supply Demand MT5
Bernhard Schweigert
4.53 (15)
La meilleure solution pour tout commerçant débutant ou expert ! Cet indicateur est un outil de trading unique, de haute qualité et abordable car nous avons intégré un certain nombre de fonctionnalités propriétaires et une nouvelle formule. Avec cette mise à jour, vous pourrez afficher des zones à double horaire. Vous pourrez non seulement afficher un TF plus élevé, mais afficher les deux, le graphique TF, PLUS le TF supérieur : AFFICHAGE DES ZONES NICHÉES. Tous les traders Supply Demand vont ado
Trend Catcher ind mt5
Ramil Minniakhmetov
5 (18)
INDICATEUR DE DÉTECTEUR DE TENDANCE L'indicateur de détecteur de tendance analyse les mouvements de prix du marché grâce à une combinaison d'indicateurs d'analyse de tendance adaptatifs, propriétaires et personnalisés. Il identifie la véritable direction du marché en filtrant les fluctuations à court terme et en se concentrant sur la force de la dynamique sous-jacente, l'expansion de la volatilité et la structure des prix. Il utilise également une combinaison d'indicateurs personnalisés de lis
Power Candles MT5
Daniel Stein
5 (10)
Power Candles V3 - Indicateur de force à optimisation automatique Power Candles V3 transforme la force des devises et des instruments en un plan de trading exploitable sur chaque graphique auquel il est associé. Au lieu de se contenter de colorer les bougies, il effectue une optimisation automatique en temps réel en arrière-plan et vous fournit les meilleurs niveaux de Stop Loss, Take Profit et seuils de signal pour le symbole que vous avez sous les yeux. Un simple clic suffit pour l'adopter en
Crystal Heikin Ashi Signals
Muhammad Jawad Shabir
5 (4)
Crystal Heikin Ashi Signals - Professional Trend & Signal Detection Indicator Advanced Heikin Ashi Visualization with Intelligent Signal System for Manual & Automated Trading Final Price: $149 ---------> Price goes up $10 after every 10 sales . Limited slots available — act fast . Overview Crystal Heikin Ashi Signals is a professional-grade MetaTrader 5 indicator that combines pure Heikin Ashi candle visualization with an advanced momentum-shift detection system. Designed for both manual traders
Smc Pro ToolKit
Talal N Z Aljarusha
5 (10)
SMC PRO TOOLKIT — SMART MONEY ANALYSIS & STRUCTURED TRADE PLANNING SMC Pro ToolKit is a professional Smart Money Concepts analysis workspace for MetaTrader 5. It combines market structure, multi-timeframe analysis, institutional price zones, setup evaluation, confirmation tools, volume context, alerts, and risk planning inside one organized chart environment. One workspace. Multiple layers of confirmation. One structured trading plan. OPEN COMPLETE USER GUIDE MULTI-CONDITION SETUP ENGINE At
KURAMA GOLD SIGNAL PRO (MT5) — Filtre à 7 couches · TP/SL automatique · Score de qualité · Sauvegarde de l'historique des signaux | Système de trading complet pour le XAUUSD Pas de repeint en temps réel. À l'instant où un signal apparaît, la flèche, l'entrée, le TP et le SL sont verrouillés sur place et ne bougent plus jamais ensuite. Ce que vous tradez, c'est ce signal en temps réel. Et dans la v7.20, chaque signal réellement envoyé est sauvegardé automatiquement et restauré à l'identique aprè
TrendMaestro5
Stefano Frisetti
note: this indicator is for METATRADER4, if you want the version for METATRADER5 this is the link:  https://www.mql5.com/it/market/product/108106 TRENDMAESTRO ver 2.5 TRENDMAESTRO recognizes a new TREND from the start, he never makes mistakes. The certainty of identifying a new TREND is priceless. DESCRIPTION TRENDMAESTRO identifies a new TREND in the bud, this indicator examines the volatility, volumes and momentum to identify the moment in which there is an explosion of one or more of these da
SR Liquidity   est un indicateur de trading conçu pour révéler les zones cachées où se concentre la liquidité du marché et où le prix réagit avec le plus d'intensité. Ces zones de liquidité spécifiques agissent comme de puissants niveaux de support et de résistance, vous offrant une cartographie claire des points où le marché est le plus susceptible de se retourner. Plutôt que de tracer des lignes de support et de résistance classiques, l'indicateur SR Liquidity analyse le comportement réel des
ARICoins
Temirlan Kdyrkhan
ARICoin is a powerful trading companion designed to generate high-probability entry signals with dynamic TP/SL/DP levels based on volatility. Built-in performance tracking shows win/loss stats, PP1/PP2 hits, and success rates all updated live. Key Features: Buy/Sell signals with adaptive volatility bands Real-time TP/SL/DP levels based on ATR Built-in MA Filter with optional ATR/StdDev volatility Performance stats panel (Success, Profit/Loss, PP1/PP2) Alerts via popup, sound, push, or email Cust
Reversion King Indicator
Eugen-alexandru Zibileanu
5 (6)
Un nouveau Roi en ville - Indicateur + Gestion des ordres (TP1 + TP2 + TP3) + Envoi optionnel de signaux Telegram INCLUS (GRATUIT) (SYSTÈME COMPLET DE TRADING et DE SIGNAUX) Notre meilleur EA pour l’Or : Gold Slayer Cet indicateur inclut une stratégie avancée, un système de trading avec gestion des ordres personnalisable ainsi qu’un système de retour à la moyenne combinant des extensions d’enveloppes, soutenu par plusieurs filtres intelligents de confirmation comme le RSI afin de détecter des en
Crystal Quantum Pro
Muhammad Jawad Shabir
5 (3)
CRYSTAL QUANTUM PRO Institutional Signal & Trade Intelligence for MetaTrader 5 Final Price: 199 USD ----> Price goes up 10 USD after every 10 sales. Limited launch slots available, act fast. Most indicators give you an arrow and leave you alone. A naked arrow is a gamble. Winning consistently requires CONFLUENCE , a clear STOP and TARGET , and honest PROOF that the system works. Crystal Quantum Pro delivers all three in one clean, no-repaint package. Crystal Quantum Pro is a complete decision sy
Plus de l'auteur
HA Metals Flow Chart is a visual MetaTrader 5 indicator designed to make the flow of gold and silver easier to read. It replaces the standard chart display with synthetic Heikin Ashi candles and combines flow classification, normalized momentum, confirmed market structure events and a compact dashboard in a single interface. The indicator is intended for discretionary chart analysis. It does not open, modify or close trades. MAIN FEATURES - Synthetic Heikin Ashi chart for a cleaner view of direc
FREE
WAIT Entry Timing WAIT stands for Weighted Analysis of Ideal Timing. WAIT Entry Timing is a decision-support indicator designed to help traders evaluate whether a detected setup may be ready for entry or whether waiting for a pullback, confirmation, or a potentially better price could be more appropriate. The indicator does not execute trades. It analyzes market conditions and presents the result through three normalized values from 0 to 100: Patience Score measures the potential benefit of wait
FREE
Gold MTF
Paolo Ruffini
Gold MTF Market Dashboard Gold MTF Market Dashboard is a multi-timeframe analytical indicator designed primarily for Gold trading on the M5 chart. The indicator compares M5, M15 and M30 market conditions in a single compact dashboard: M30 provides the broader market context. M15 evaluates structure and direction. M5 provides short-term timing information. Main features Multi-timeframe trend analysis M5, M15 and M30 directional scores Bullish HH/HL and bearish LH/LL market structure EMA trend and
FREE
Liquidity Momentum Pulse (LMPX) Description Liquidity Momentum Pulse (LMPX) est un indicateur technique conçu pour mesurer la pression réelle du marché en combinant volume et accélération des prix. L’indicateur calcule : Volume normalisé : Volume / Moyenne mobile du volume Momentum du prix : Rate of Change (ROC) La valeur finale est le produit du volume normalisé et du momentum, permettant : D’identifier les mouvements soutenus par la participation De détecter le régime de marché au-dessus/en d
FREE
Gold Spread Traffic Light Gold Spread Traffic Light is a real-time spread monitoring indicator developed for MetaTrader 5. It provides an immediate visual assessment of the current difference between Bid and Ask prices through a clear four-color panel. The indicator is primarily configured for XAUUSD, where spread conditions can change considerably during news releases, market openings, rollover periods and phases of reduced liquidity. It can also be used with Forex pairs, silver, indices, oil
FREE
Titan Adaptive Gold Grid Titan1000 is a configurable Expert Advisor designed for XAUUSD trading. It combines SuperTrend entries, optional trend filters, dynamic ATR-based grid management, fractal support and resistance levels, basket profit management and execution protections. The default configuration uses a permissive entry profile. Titan1000 can open a new basket according to the current SuperTrend direction without requiring a new trend reversal. Traders can activate additional filters t
EMA256 Fourier Cycle Trader EMA256 Fourier Cycle Trader is an advanced MetaTrader 5 Expert Advisor combining a long-term EMA or TEMA trend model, causal Fourier cycle analysis, configurable averaging and a unified basket take-profit system. The Expert Advisor is designed primarily for CENT accounts and for traders who understand basket recovery strategies, geometric lot progression and the risks associated with trading without a mandatory Stop Loss. RECOMMENDED STARTING CONFIGURATION Recommended
Filtrer:
Aucun avis
Répondre à l'avis