VPEO Volume Statistics
- Göstergeler
-
Paolo Ruffini
 Forex ve emtia piyasalarında 15 yılı aşkın operasyonel deneyime sahip bir trader’ım. Özellikle likidite dinamikleri, hacimsel piyasa baskısı ve fiyatın yönlü hareket yapısı üzerine odaklanıyorum.
 - Sürüm: 1.20
VPEO Volume Statistics is a customizable volume-analysis indicator for MetaTrader 5. VPEO stands for Volume Pressure and Efficiency Oscillator. The indicator combines directional volume pressure, a statistical analysis of rising or falling market participation, volume-efficiency conditions, optional BUY and SELL markers, and a compact dashboard in one interface.
The indicator is designed to answer three separate questions:
-
Is current volume pressure mainly positive or negative?
-
Is overall trading activity increasing, decreasing, or remaining stable?
-
Is high activity producing directional price movement, or is price showing low efficiency relative to volume?
VPEO Volume Statistics is an analytical indicator. It does not open, modify, or close trades. It does not include position sizing, stop-loss, take-profit, or money-management functions. All displayed entry markers are technical conditions intended for chart analysis, testing, and integration into a separate trading process.
VPEO Pressure Wave
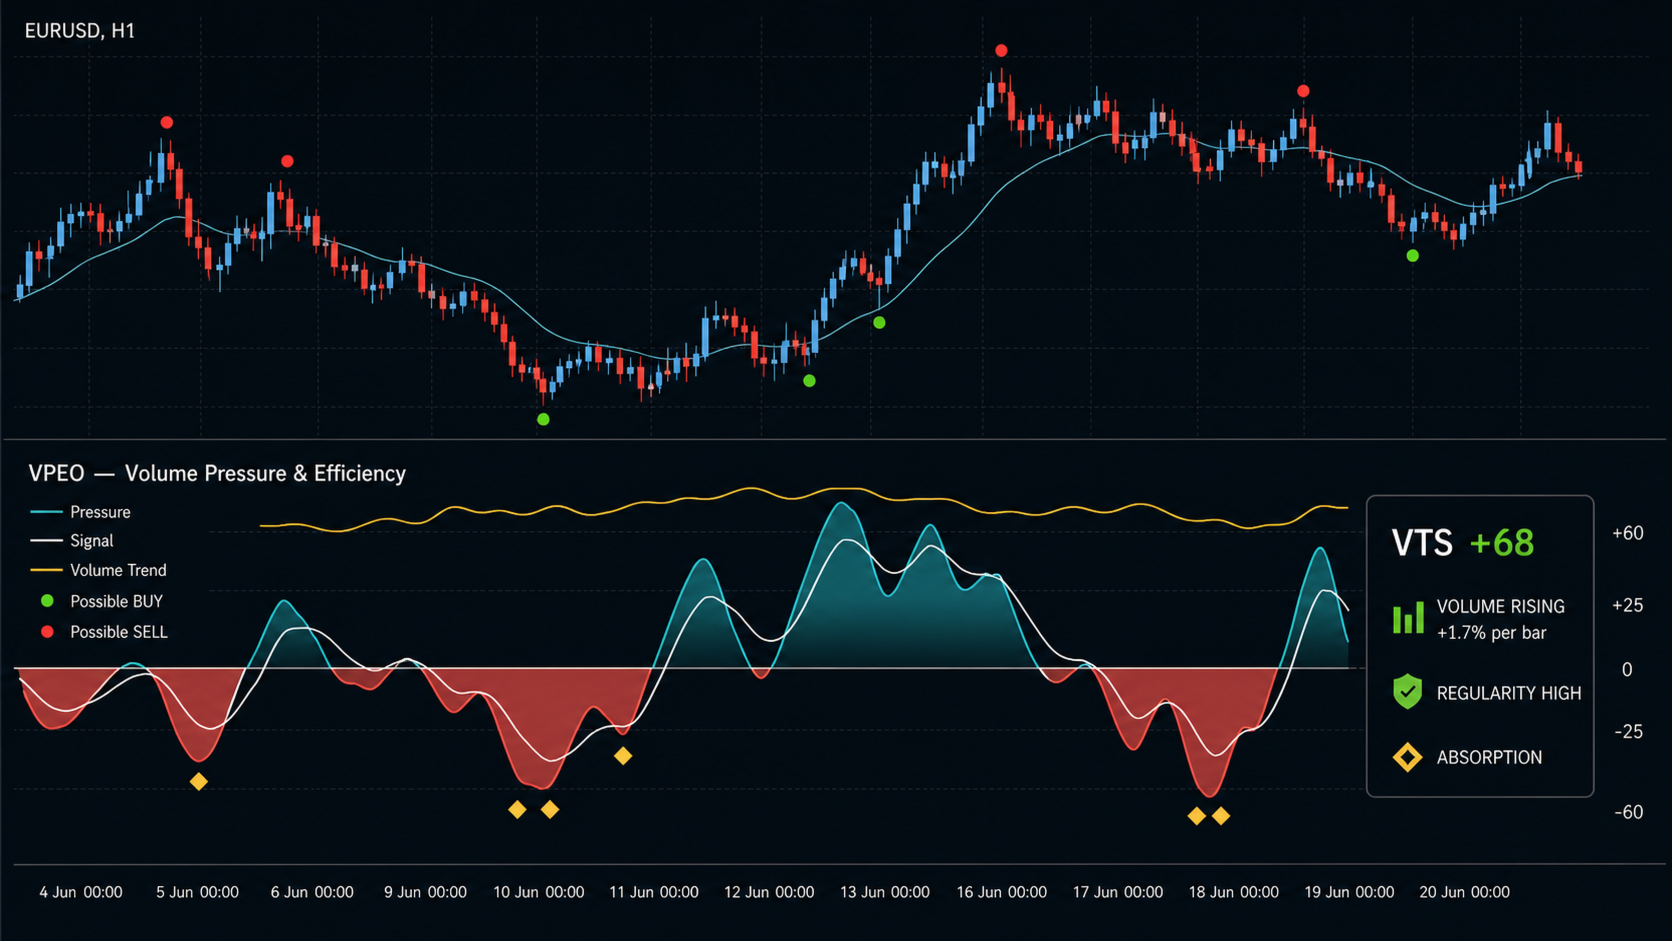
The main VPEO wave measures signed volume pressure on a scale from -100 to +100.
The calculation combines candle-body direction with the location of the close inside the candle range. This helps distinguish a candle that closes with directional conviction from a candle that contains substantial activity but finishes near the middle of its range. Volume is transformed logarithmically to reduce the excessive influence of isolated extreme values.
The resulting directional flow is normalized using the median and median absolute deviation over a configurable historical window. This robust approach is less sensitive to occasional volume spikes than a standard mean and standard-deviation calculation.
General interpretation:
-
Positive VPEO values indicate positive directional volume pressure.
-
Negative VPEO values indicate negative directional volume pressure.
-
Values close to zero indicate limited directional pressure or balanced activity.
-
Increasing absolute values indicate that directional pressure is becoming more unusual relative to recent history.
-
A return toward zero indicates that directional pressure is normalizing or losing intensity.
The default display is a continuous colored wave. Users can switch to a classic color histogram from the Inputs tab. The bullish, bearish, neutral, signal, trend, and absorption colors are individually configurable.
Signal Line
A smoothed signal line is calculated from the VPEO pressure wave. Its period is configurable and defaults to 5 bars.
The signal line helps identify changes in short-term pressure. Crosses between the VPEO wave and its signal line are used as one component of the optional entry-marker logic. A cross alone is not treated as a complete market decision in the default Balanced mode. Additional participation and price-trend conditions are applied before a marker is displayed.
Statistical Volume Trend Score
The Volume Trend Score, or VTS, measures whether volume is statistically rising or falling over the selected analysis period.
The indicator applies linear regression to logarithmic volume. The regression slope is evaluated relative to its estimated variability and transformed into a bounded score between -100 and +100. The VTS line is then smoothed to improve readability.
VTS measures the direction of market participation, not the direction of price:
-
A positive VTS indicates that volume is generally increasing.
-
A negative VTS indicates that volume is generally decreasing.
-
A VTS near zero indicates stable or statistically unclear volume behavior.
-
Values above the moderate or strong positive levels indicate increasingly consistent volume expansion.
-
Values below the corresponding negative levels indicate increasingly consistent volume contraction.
The dashboard also displays the estimated average percentage change in volume per bar. This value is derived from the regression slope and provides a more intuitive description of the current participation trend.
Regression regularity is reported as LOW, MEDIUM, or HIGH. This classification is based on the regression R-squared value. A high value means the recent volume trend is comparatively consistent. A low value means volume is irregular, even if the current slope is positive or negative.
Absorption and Low-Efficiency Activity
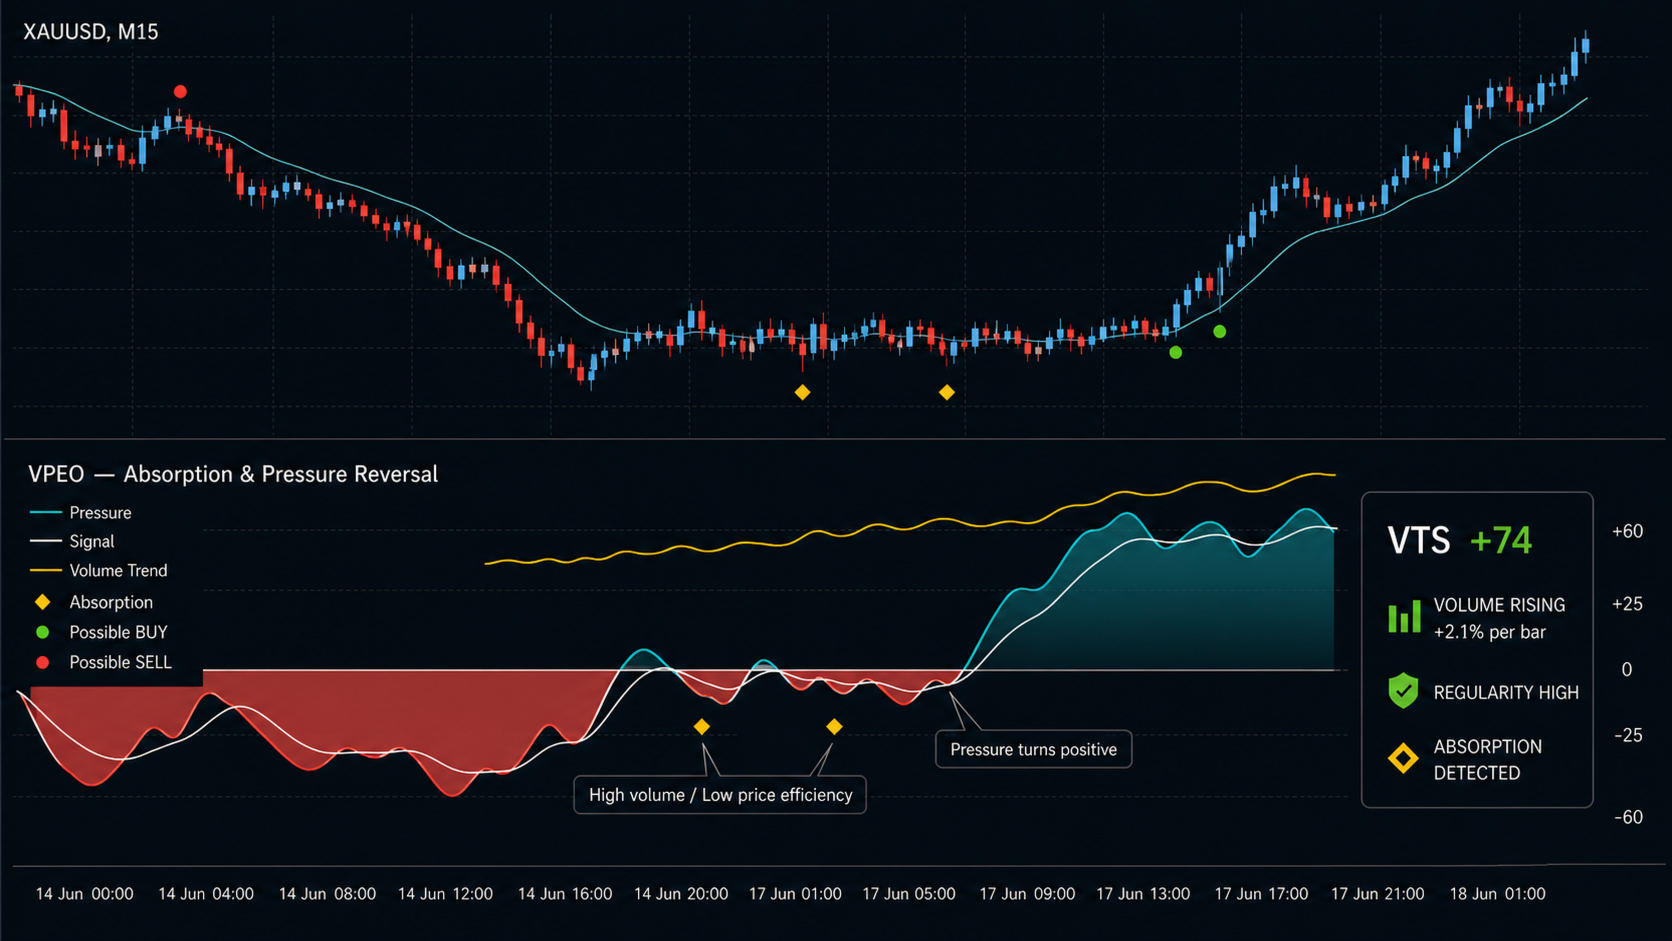
The indicator can mark potential absorption conditions.
An absorption marker requires two elements:
-
volume that is unusually high relative to its recent robust distribution;
-
limited candle-body movement relative to the complete high-low range.
This combination means that considerable activity occurred while the candle produced limited directional progress. It may represent absorption, two-sided trading, indecision, or an exhaustion phase. The marker does not determine bullish or bearish direction by itself and should be interpreted together with price structure, VPEO pressure, and the Volume Trend Score.
The absorption lookback, minimum volume z-score, maximum price efficiency, marker color, and marker position are all configurable.
Optional BUY and SELL Markers
BUY markers are displayed as green dots below price bars. SELL markers are displayed as red dots above price bars. Their colors, size, ATR-based distance from price, and historical display range can be changed.
Three signal modes are available.
Cross Only
This is the least restrictive mode. It uses a VPEO signal-line cross or pressure-threshold event together with the minimum pressure requirement. It produces more signals but does not require confirmation from the statistical volume trend or price trend.
Balanced
Balanced is the default mode. It requires:
-
a qualifying VPEO cross or pressure-threshold event;
-
the configured minimum directional-pressure value;
-
a Volume Trend Score above the configured minimum;
-
price alignment with the internal EMA when the price-trend filter is enabled;
-
no absorption condition on the same bar when absorption blocking is enabled;
-
compliance with the minimum number of bars between consecutive signals;
-
compliance with the optional maximum-spread filter.
For a BUY marker, pressure must be positive and price must be above the internal EMA when the trend filter is enabled. For a SELL marker, pressure must be negative and price must be below the EMA. The minimum VTS condition remains positive for both directions because VTS measures expanding participation rather than bullish or bearish direction.
Strict
Strict mode applies all Balanced conditions and adds:
-
a minimum positive volume anomaly;
-
a minimum regression R-squared value.
This mode is intended for users who prefer fewer conditions with stronger volume expansion and more consistent volume-trend statistics.
Closed-Bar Behavior
Closed-bar signal calculation is enabled by default. Entry markers are evaluated after the relevant candle has closed and do not use future price data.
The VPEO wave and dashboard can still update on the active candle when current-bar updating is enabled. The open candle is therefore expected to change as new ticks arrive. Users who require a completely static visual display can disable current-bar updating.
The indicator also includes an optional alert-on-attach setting. It is disabled by default to prevent an alert from being generated immediately for a signal that already existed before the indicator was added to the chart.
Volume Source Selection
Three volume-source modes are available:
-
Auto Volume: uses real trade volume when the feed provides a positive value and otherwise falls back to tick volume.
-
Tick Volume: always uses the number of price updates reported for each bar.
-
Real Volume: uses reported trade volume, with an optional fallback to tick volume when real volume is unavailable.
On decentralized Forex and many CFD symbols, tick volume may be the only available volume source. Exchange-traded instruments may provide real trade volume. Volume data can differ between brokers, servers, and liquidity feeds. Users should therefore validate the indicator with the same data source they intend to use in practice.
The active source is shown in the dashboard as REAL, TICK, or REAL N/A.
Dashboard
The optional dashboard displays a compact statistical summary:
-
current Volume Trend Score;
-
volume state: rising strongly, rising, stable, falling, or falling strongly;
-
estimated percentage change in volume per bar;
-
regression regularity;
-
active volume source.
Dashboard visibility, corner, horizontal and vertical offset, text color, background color, and border color are customizable.
Reference Levels
The oscillator uses five reference levels:
-
strong positive level;
-
moderate positive level;
-
zero line;
-
moderate negative level;
-
strong negative level.
The default moderate level is 25 and the default strong level is 60. These levels help describe pressure and volume-trend intensity. They are analytical references rather than automatic overbought or oversold levels.
Alerts
The indicator supports optional:
-
terminal popup alerts;
-
mobile push notifications;
-
email alerts;
-
sound alerts.
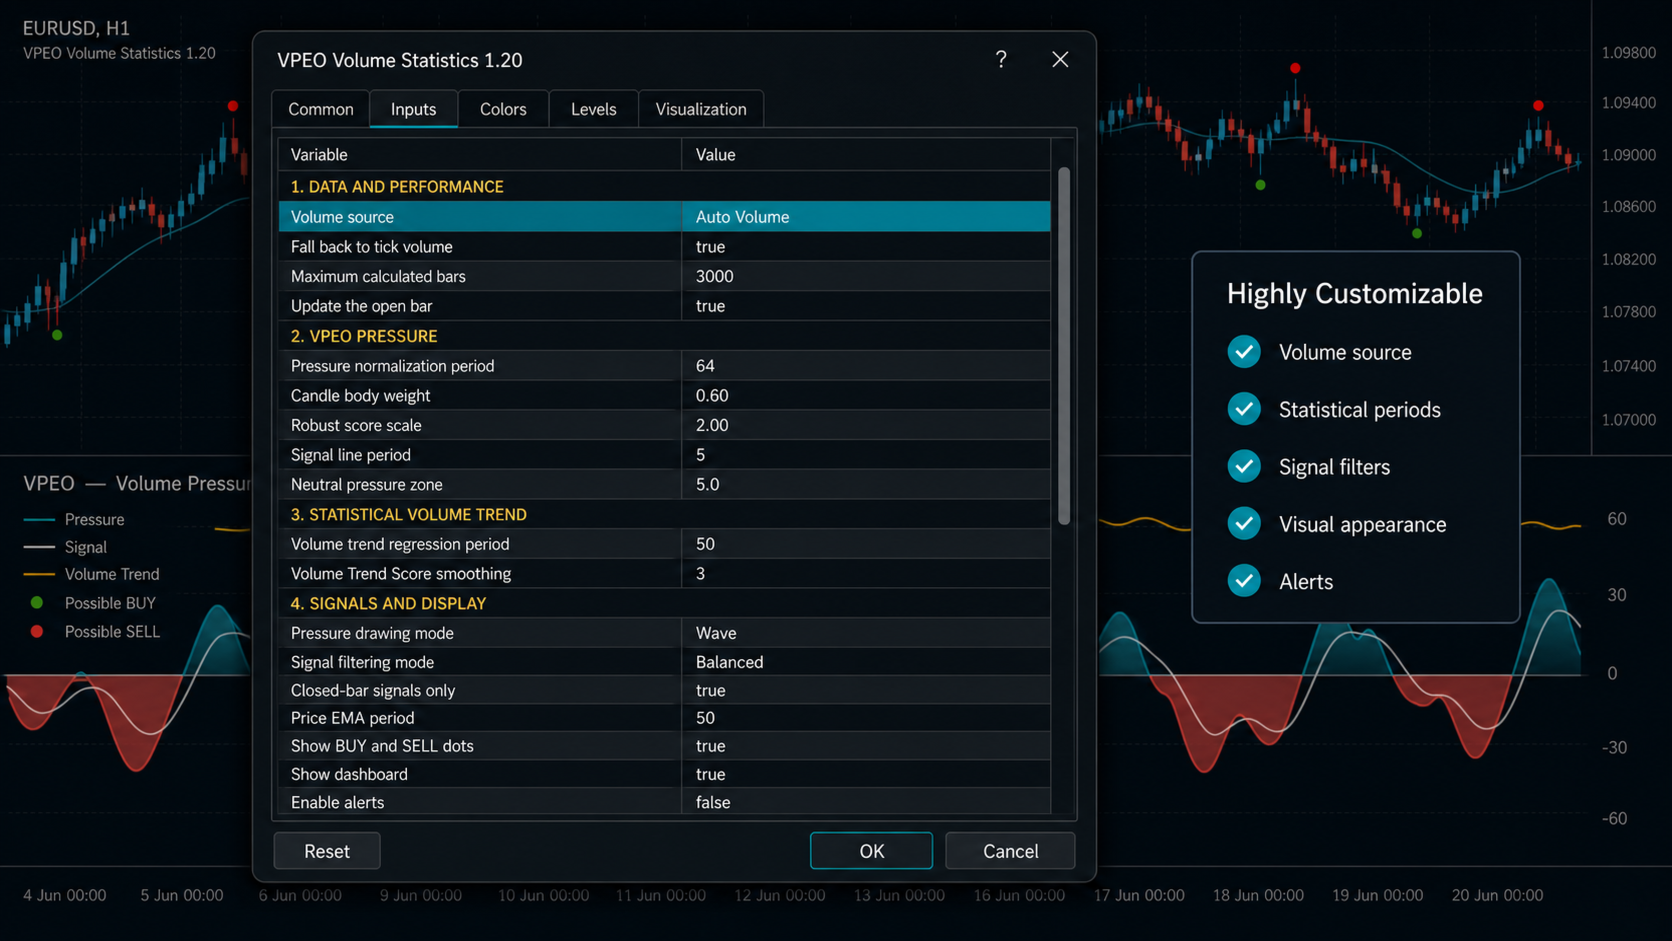
All alert channels are disabled by default. Alerts use the selected signal mode and the same conditions as the chart markers. The sound file can be changed through the Inputs tab.
Default Configuration
The default setup is a balanced starting point for liquid symbols, particularly on M15 to H1 charts:
-
Auto volume source with tick-volume fallback;
-
3,000 calculated bars;
-
64-bar VPEO normalization period;
-
0.60 candle-body weight;
-
2.00 robust pressure scale;
-
5-bar signal-line period;
-
5-point neutral zone;
-
50-bar statistical volume-trend period;
-
3-bar VTS smoothing;
-
moderate and strong reference levels at 25 and 60;
-
50-bar absorption analysis period;
-
absorption volume z-score of 2.0;
-
maximum absorption price efficiency of 0.20;
-
Balanced signal mode;
-
minimum entry pressure of 10;
-
minimum Volume Trend Score of 15;
-
EMA 50 price-trend filter;
-
5-bar minimum distance between signals;
-
ATR 14 entry-dot positioning with a 0.25 ATR offset;
-
closed-bar signals enabled;
-
continuous pressure-wave display;
-
dashboard enabled;
-
alerts disabled.
These parameters are starting values, not universal settings. Lower timeframes may require longer normalization, stronger thresholds, or a longer cooldown to reduce noise. Higher timeframes may use shorter periods when users want a more responsive display. Parameter changes should be evaluated on separate calibration and out-of-sample periods rather than optimized only on one historical interval.
Interpreting Common Conditions
Price rising, positive VPEO, and rising VTS indicate that positive directional pressure is accompanied by expanding participation.
Price rising while VTS falls indicates that the advance is occurring with decreasing participation. This is not an automatic reversal signal, but it describes weaker volume confirmation.
Price falling, negative VPEO, and rising VTS indicate increasing participation in a negative directional move.
Price falling while VTS also falls indicates that the decline is occurring with contracting activity. This can be consistent with a low-participation pullback, but market structure should be considered.
Rising VTS with VPEO near zero indicates increasing activity without clear directional efficiency. When an absorption marker is also present, the market is processing high activity with limited candle-body progress.
A strong VPEO value combined with a weak or negative VTS means that the current directional bar is notable relative to recent flow, but broader participation is not expanding consistently.
Integration with Expert Advisors
The indicator exposes data buffers that can be accessed through iCustom:
-
Buffer 0: VPEO pressure;
-
Buffer 1: VPEO color index;
-
Buffer 2: signal line;
-
Buffer 3: Volume Trend Score;
-
Buffer 4: zero line;
-
Buffer 5: absorption condition;
-
Buffer 6: BUY signal, value 1.0 on a qualifying bar;
-
Buffer 7: SELL signal, value 1.0 on a qualifying bar.
For closed-bar operation, an Expert Advisor should normally read BUY and SELL buffers at shift 1. EMPTY_VALUE indicates that no signal is present on the selected bar.
VPEO Volume Statistics does not include a trading engine. Any Expert Advisor using its buffers must separately implement order validation, position sizing, stop management, spread and slippage controls, account-mode handling, and risk limits.
Suggested Workflow
-
Select the required volume source or keep Auto Volume enabled.
-
Start with the default Balanced mode.
-
Confirm that the dashboard reports the expected volume source.
-
Observe the relationship between price, VPEO pressure, and the Volume Trend Score.
-
Review absorption markers in the context of nearby support, resistance, or consolidation.
-
Adjust normalization and threshold parameters only after collecting enough observations.
-
Test the selected configuration across different market conditions.
-
Include spread, commission, slippage, and risk-management rules in any strategy evaluation.
Important Information
VPEO Volume Statistics is intended for technical and statistical market analysis. It does not predict future prices and does not guarantee trading results. BUY and SELL dots are conditional chart markers, not personalized investment advice or complete trading instructions.
Results depend on symbol characteristics, timeframe, market regime, broker data, and the selected volume source. Historical behavior may not continue in future conditions. Users remain responsible for evaluating the indicator, defining risk controls, and deciding whether any displayed condition is suitable for their own trading process.