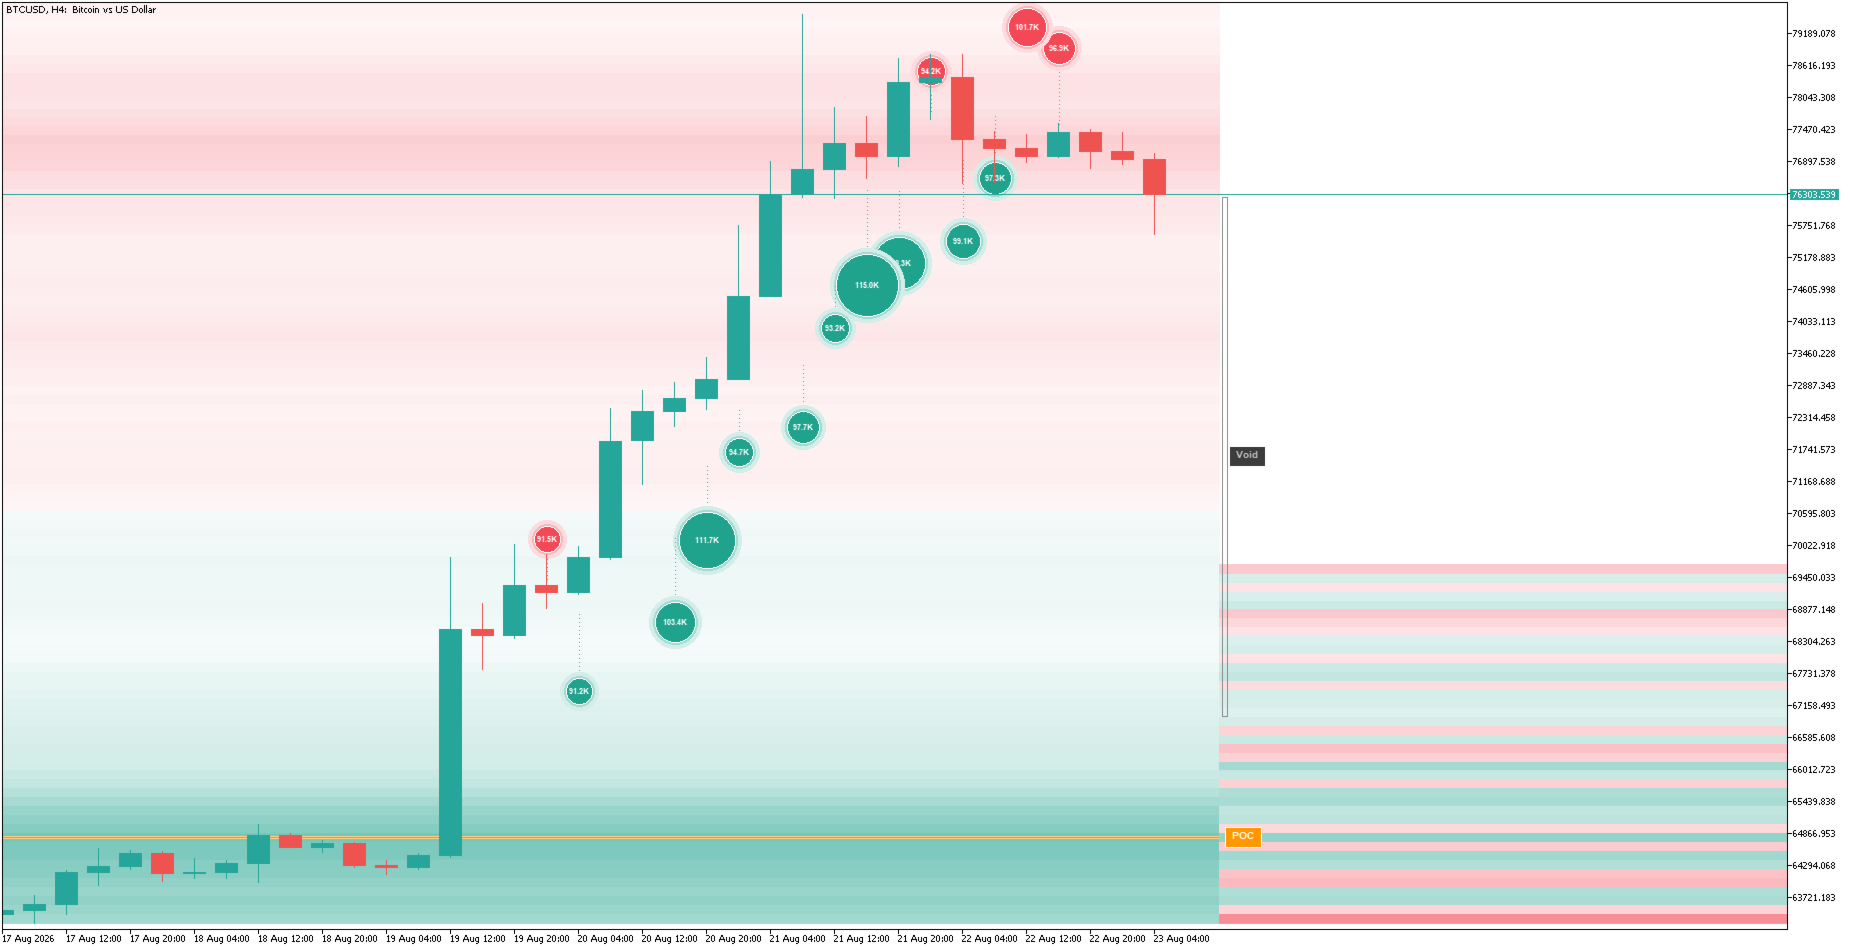
Liquidity Structure Flow Heatmap
- 指标
- 版本: 1.0
- 激活: 5

Liquidity Structure & Flow Mt4 Here
indicator visualizes institutional market depth, volume concentration, and whale order flow directly on your MT5 cumulative volume engine.
Core Components & Meanings
| Visual Element | Meaning |
| Orange Horizontal Line (POC) | Point of Control: The exact price level where the highest volume was traded. Acts as a price magnet and institutional support/resistance. |
| Background Heatmap Glow (Teal / Red) | Liquidity Nodes: Bright areas indicate heavy liquidity/acceptance. Dark bands indicate areas of low volume (market rejects these quickly). |
| Whale Bubbles (Teal / Red) | Institutional Absorption / Trapped Volume: Green bubbles indicate massive buying spikes; Red bubbles indicate massive selling spikes. Bubble radius dynamically scales with volume size. |
| Right Cumulative Curves | Cumulative Order Flow: Shows mass skew. If the Lower Curve (Teal) is larger, buyers hold dominant liquidity; if the Upper Curve (Red) is larger, sellers dominate. |
| Void Zone Box | Liquidity Void / Imbalance: Price moves through these zones rapidly due to a lack of resting limit orders. |
How to Use It for Trading (Buy & Sell Rules)
1. High-Probability BUY Setup (Absorption & Reversal)
-
Context: Price pulls down into the lower Value Area Low (VAL) or a strong Teal Liquidity Node.
-
Trigger: A large Teal Whale Bubble appears under a candle wick (institutions absorbing sell orders).
-
Execution: Enter BUY when the next candle closes bullish.
-
Target / Exit:
-
Take Profit (TP): The orange POC line or the upper Value Area High (VAH).
-
Stop Loss (SL): Just below the low of the whale bubble candle.
-
2. High-Probability SELL Setup (Distribution & Rejection)
-
Context: Price rallies into the upper Value Area High (VAH) or a heavy Red Liquidity Node.
-
Trigger: A large Red Whale Bubble appears above a candle upper wick (aggressive selling/distribution).
-
Execution: Enter SELL on the first bearish close following the bubble.
-
Target / Exit:
-
Take Profit (TP): The orange POC line or lower Teal liquidity shelf.
-
Stop Loss (SL): Just above the high of the whale bubble candle.
-
3. POC Retest & Value Area Breakout Strategy
-
POC Pullback (Trend Continuation):
-
When price trends above POC and pulls back into the Orange POC Line without breaking below it, enter a BUY targeting new highs.
-
When price trends below POC and pulls back into the Orange POC Line without closing above it, enter a SELL targeting new lows.
-
-
Void Fill Acceleration:
-
If price breaks into a Void Box, scalp in the direction of the breakout. Price often sweeps through the entire void quickly to reach the next liquidity cluster.
-