Nova Volume Flow
- 指标
-
Ferry Nijland
 NOVA — Next-generation Optimized Visual Analysis
My name is Ferry Nijland, developer of the NOVA product line for MetaTrader.
NOVA focuses on practical and easy-to-use trading tools with clear market visualization, reliable functionality and a clean chart experience. - 版本: 1.0
- 激活: 5
NOVA Volume Flow
is a professional volume-pressure oscillator for MetaTrader 4. It transforms market volume and candle direction into a clear visual histogram, helping traders evaluate whether price movement is supported by bullish or bearish participation.
Instead of showing volume as a single neutral value, NOVA Volume Flow classifies both the direction and relative strength of the current market pressure. This creates a clean visual overview of changing momentum, weak participation, strong directional pressure and potential reversal conditions.
MAIN FEATURES
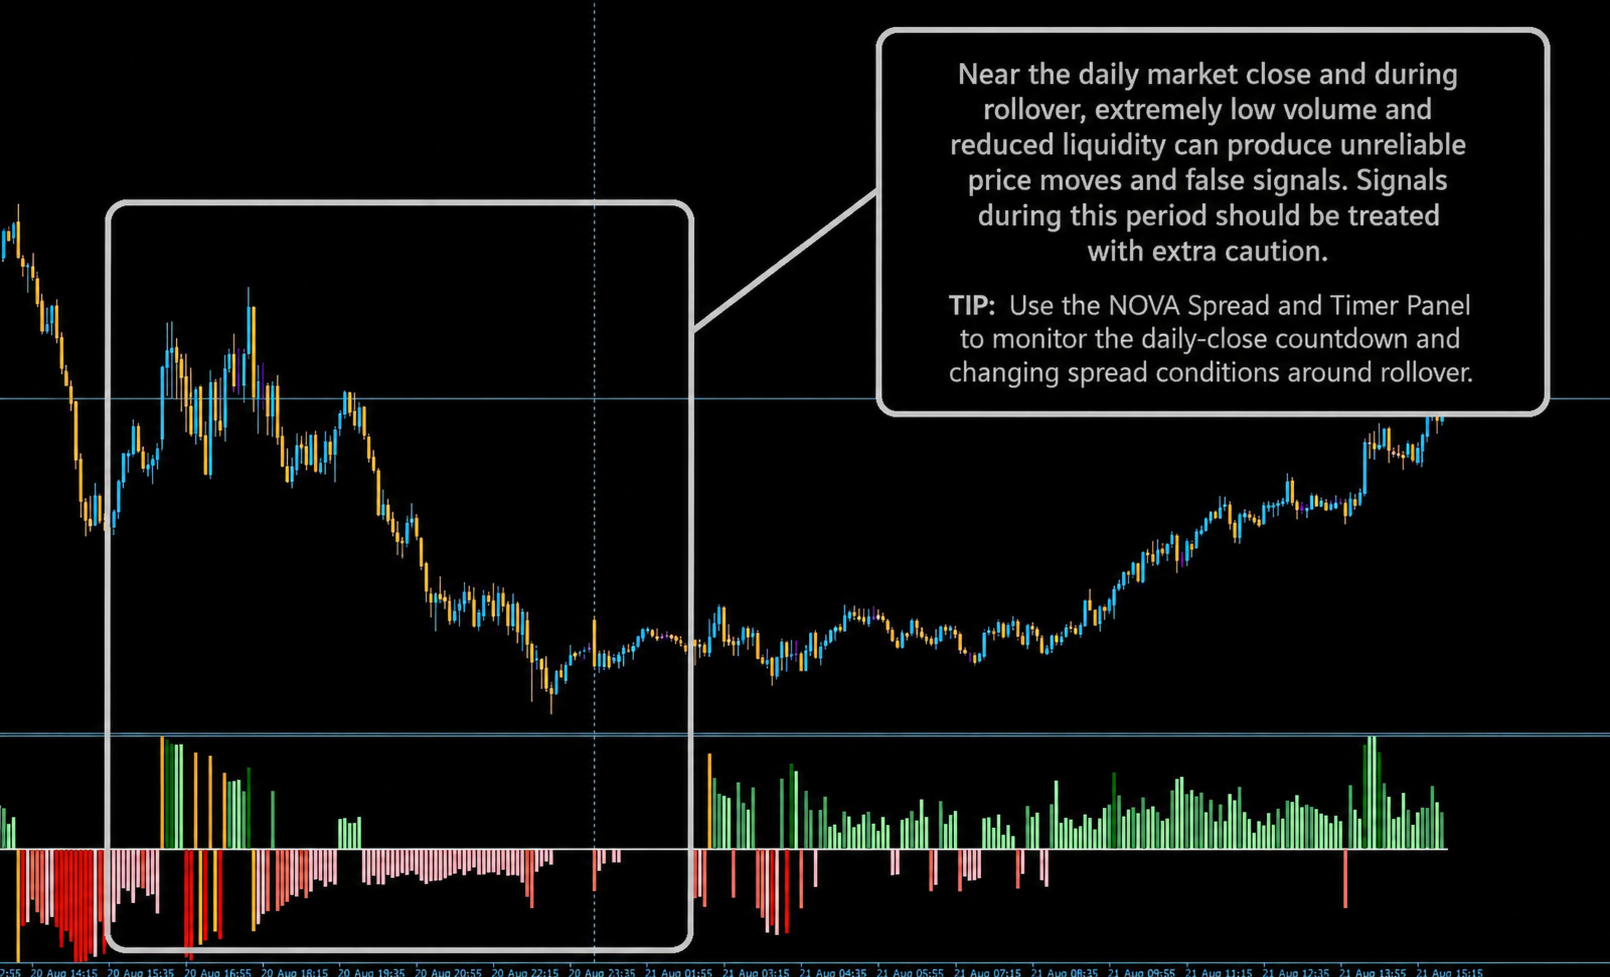
• Bullish volume pressure displayed above the zero line
• Bearish volume pressure displayed below the zero line
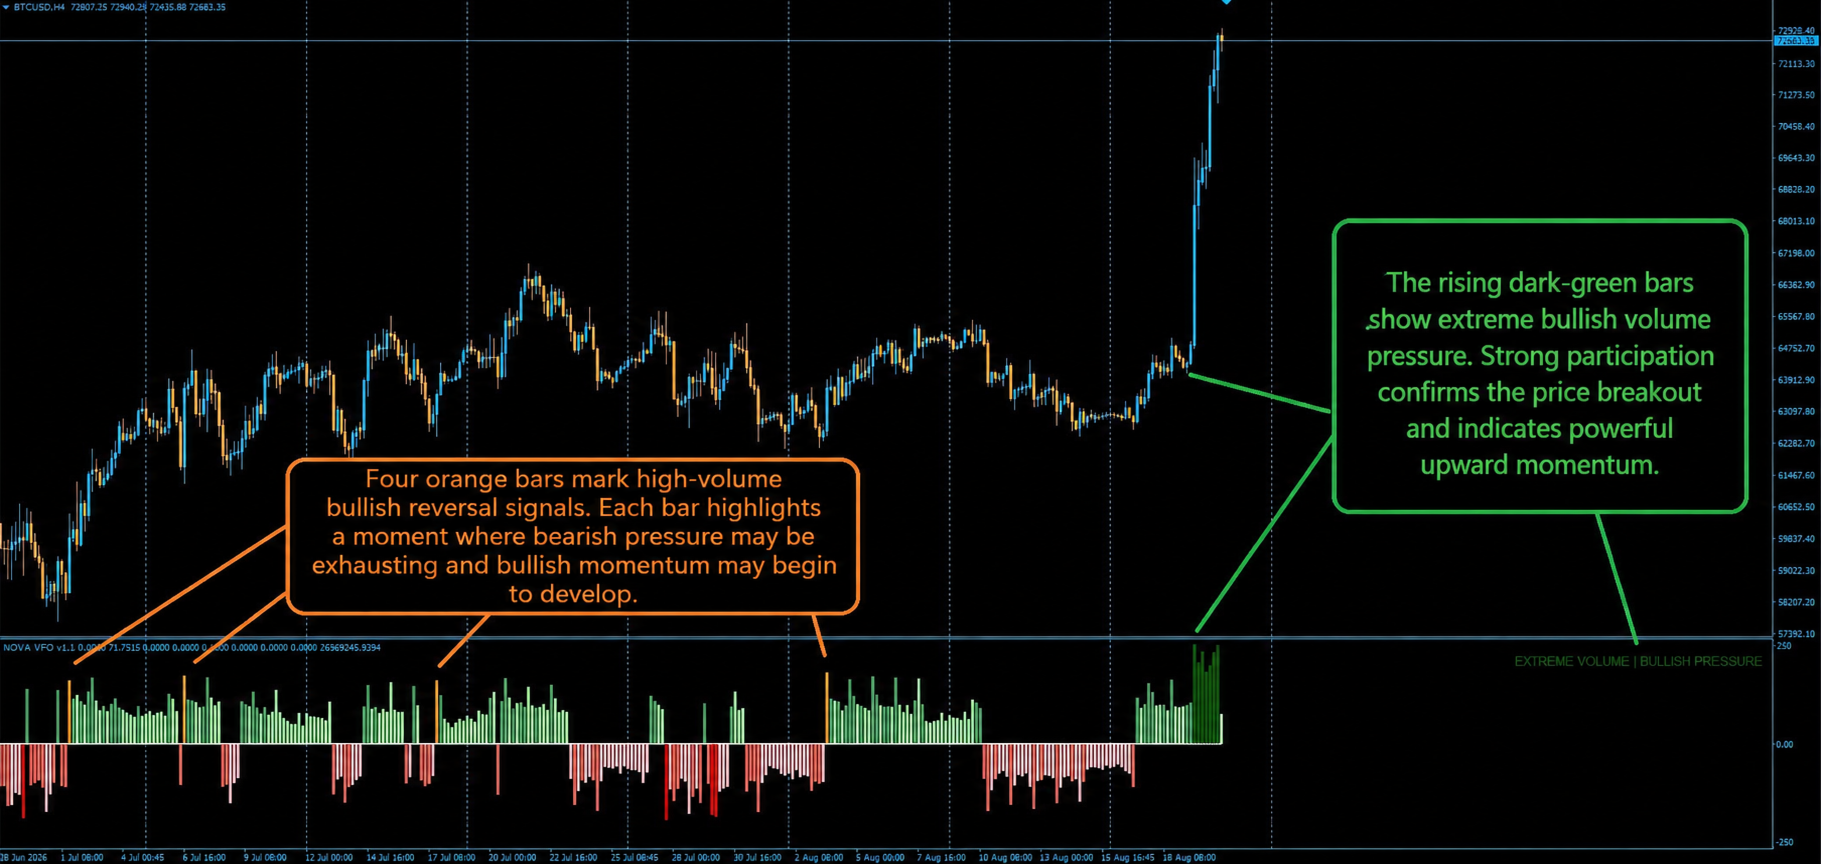
• Multiple color intensities for low, medium, high and extreme volume
• Dynamic comparison with the local average volume
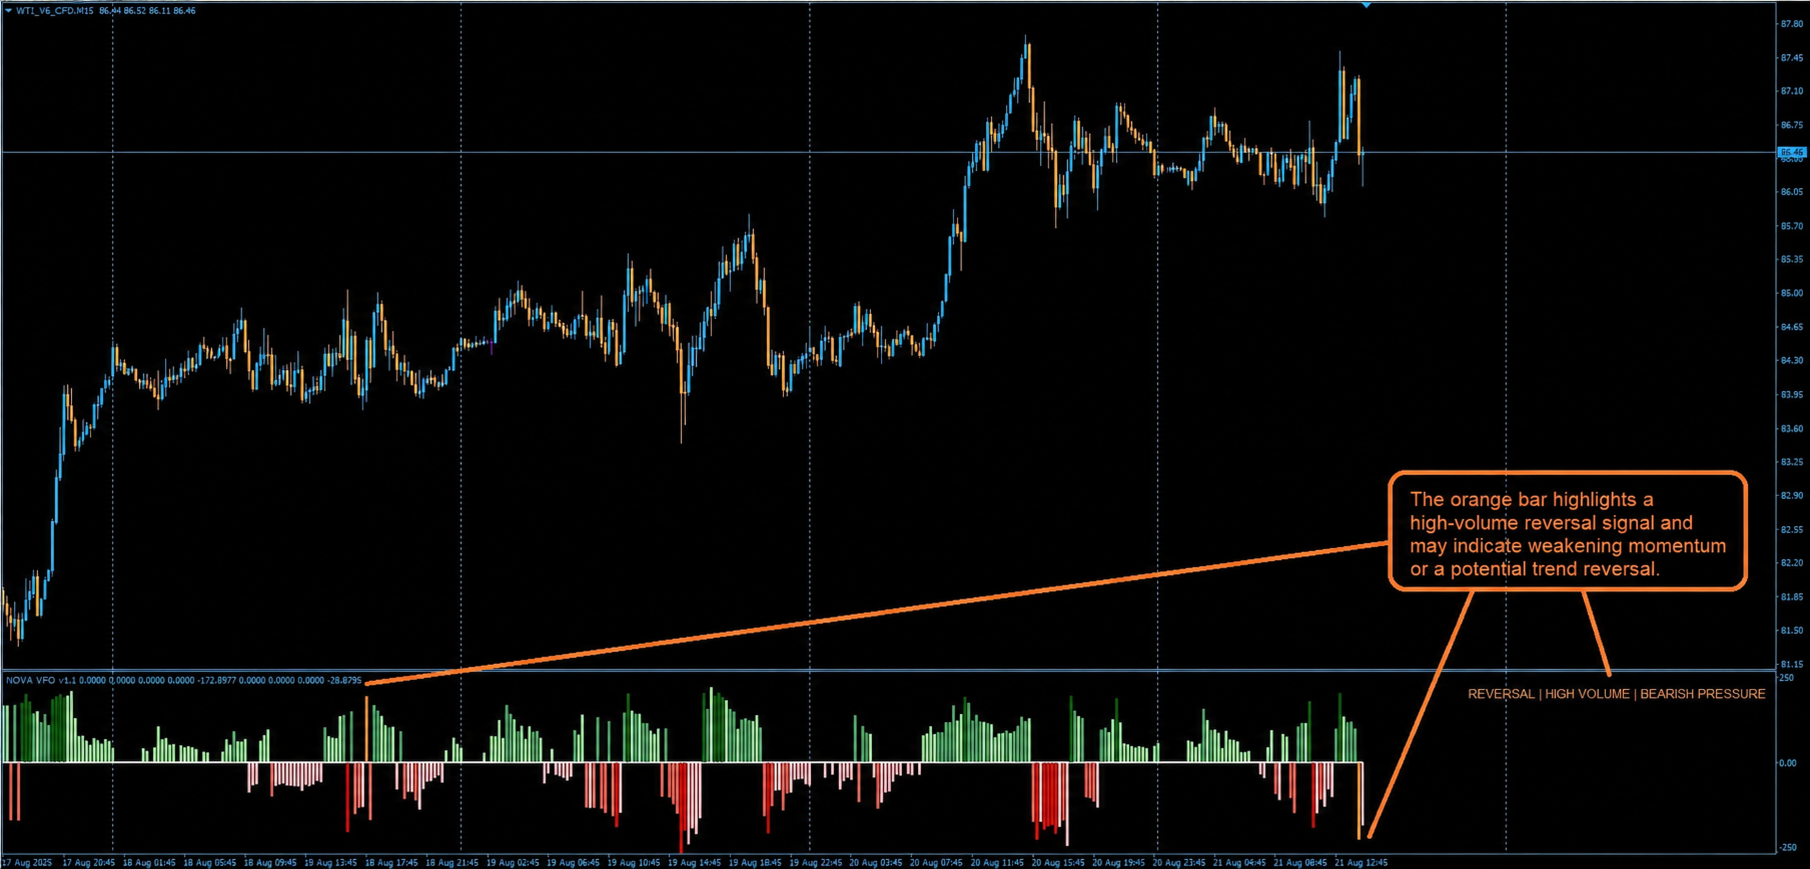
• Orange reversal bars for qualified high-volume direction changes
• Clear status text describing the latest completed candle
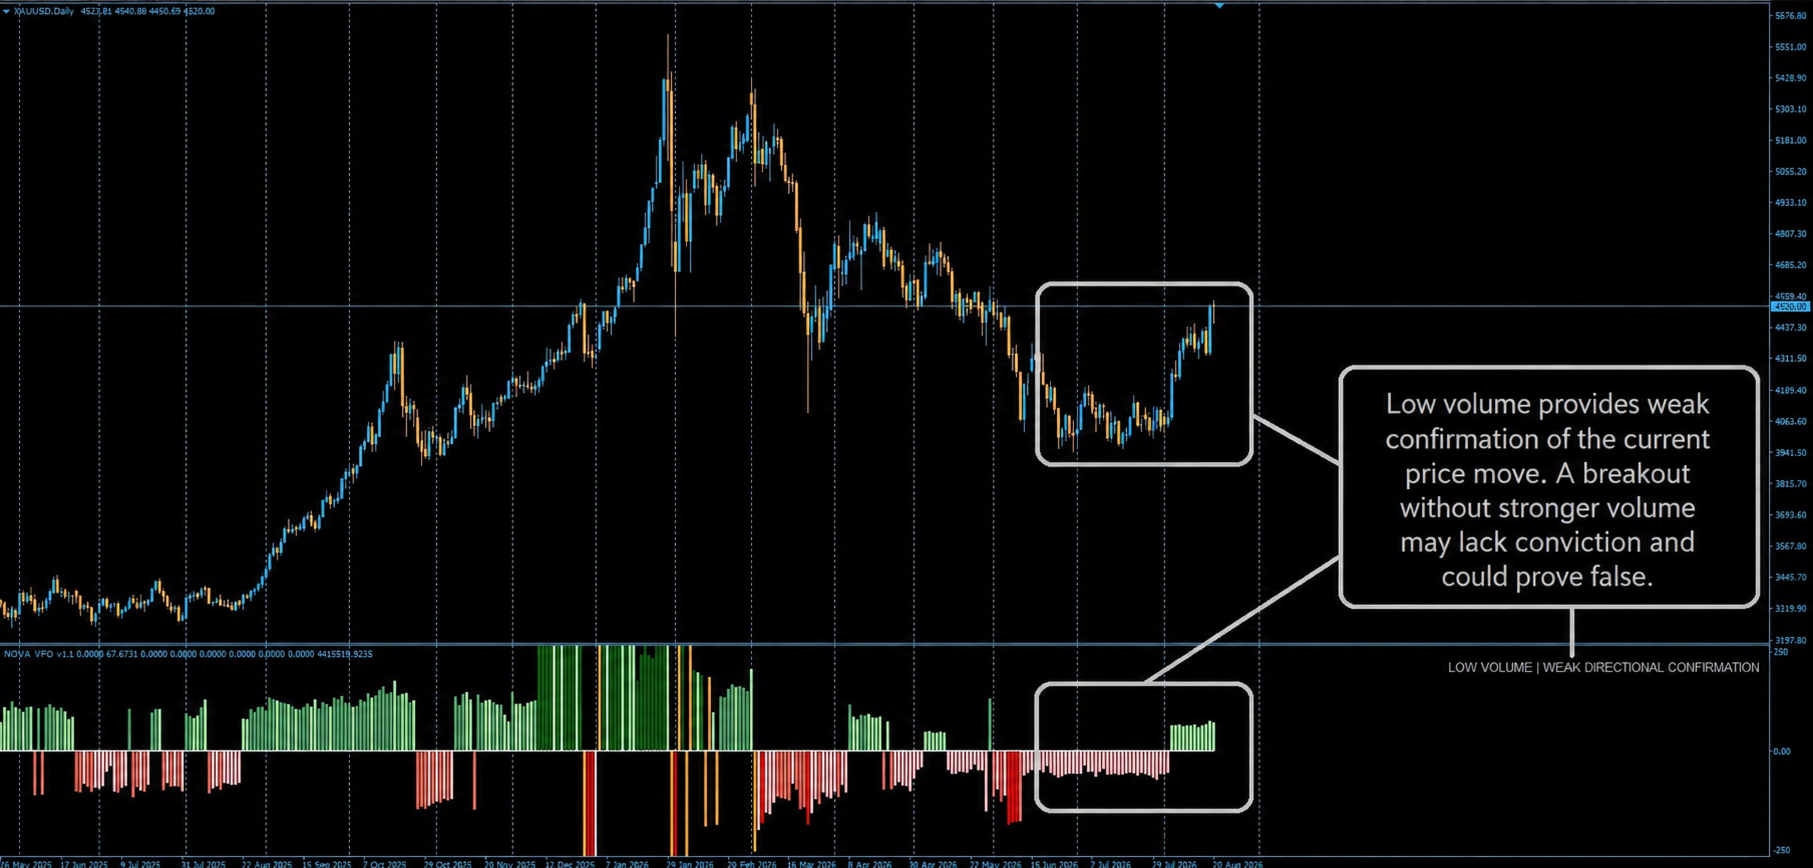
• Low-volume warning when price action has weak directional confirmation
• Optional popup alerts for reversal, high-volume and extreme-volume conditions
• Adjustable lookback, histogram width, scaling and reversal filters
• Suitable for Forex, metals, indices, commodities and cryptocurrencies
• Works on all standard MetaTrader 4 timeframes
VOLUME STRENGTH
The oscillator compares the volume of each candle with the average volume of the preceding candles.
The histogram uses different color intensities to distinguish between:
• Low volume
• Medium volume
• High volume
• Extreme volume
Increasing color intensity indicates stronger relative participation. This helps traders quickly identify whether a market move is supported by meaningful volume or is occurring under weak participation.
BULLISH AND BEARISH PRESSURE
Green histogram bars represent bullish volume pressure and are displayed above the zero line.
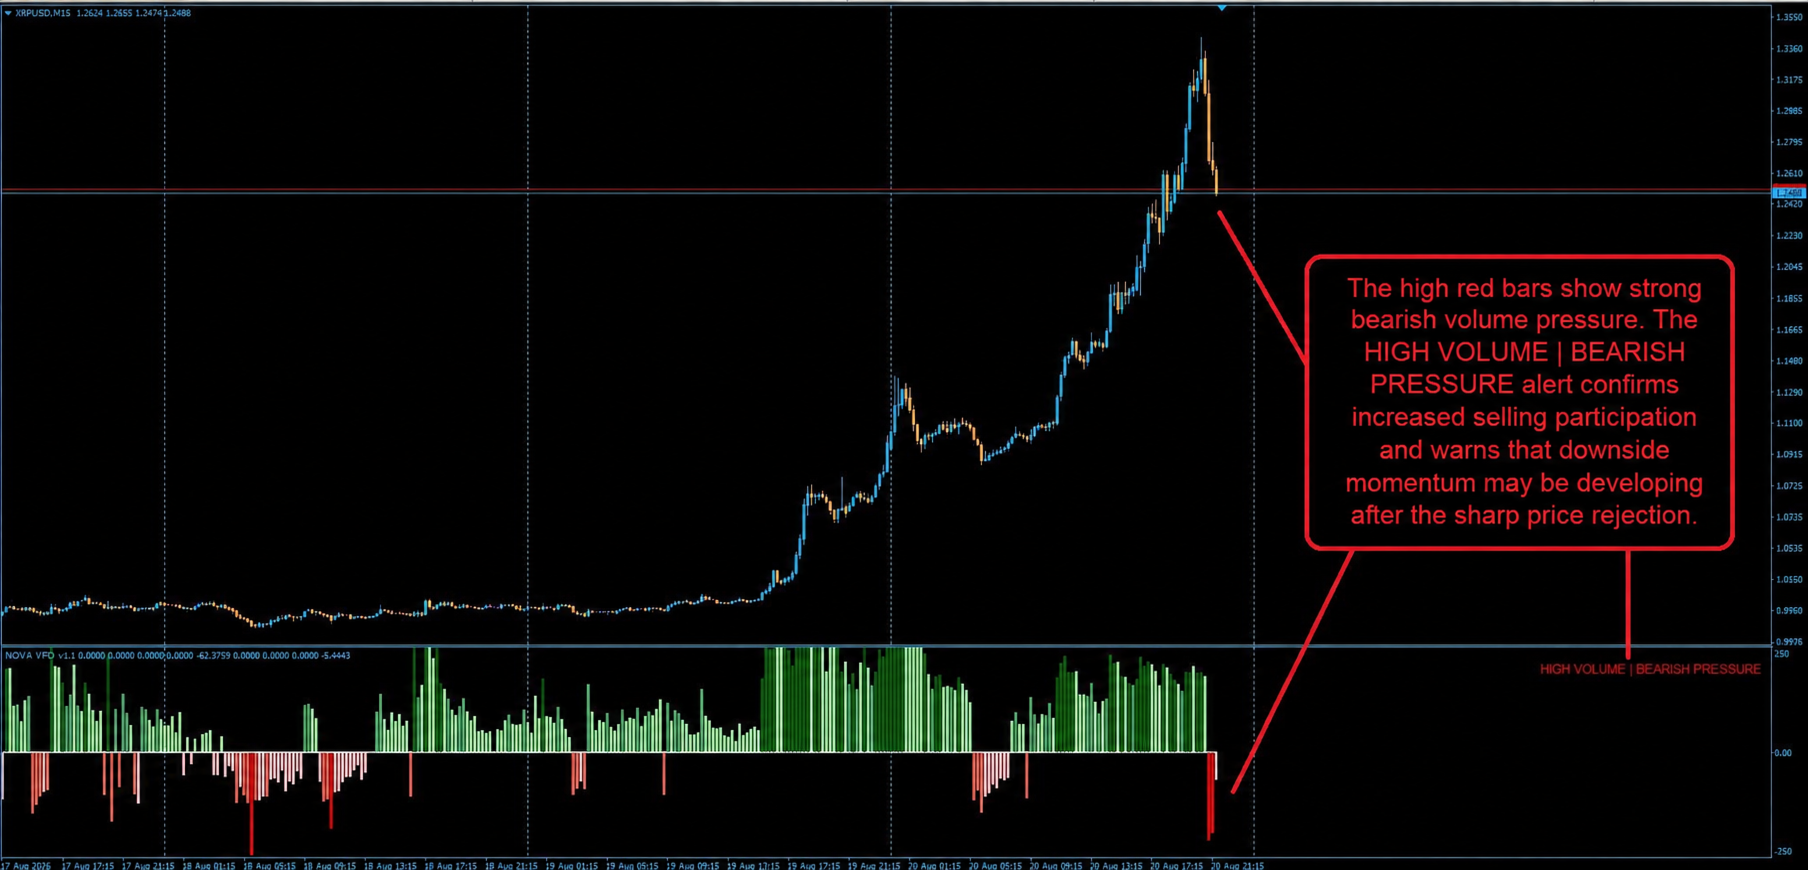
Red histogram bars represent bearish volume pressure and are displayed below the zero line.
The indicator combines candle direction, volume and smoothed volume flow to determine the prevailing pressure. Lighter colors can also highlight situations where price direction and underlying volume flow do not fully agree.
REVERSAL BARS
Orange histogram bars identify strict potential reversal conditions.
A reversal bar is only displayed when several conditions align, including:
• A confirmed change in volume-flow direction
• Volume significantly above its local average
• Sufficient candle-body strength
• Optional confirmation from price direction
An orange bar does not guarantee a market reversal. It highlights a moment where momentum may be weakening or where a potential directional change deserves additional attention.
STATUS INFORMATION
The status label provides a direct interpretation of the latest completed candle, including conditions such as:
• LOW VOLUME | WEAK DIRECTIONAL CONFIRMATION
• MEDIUM VOLUME | BULLISH PRESSURE
• HIGH VOLUME | BEARISH PRESSURE
• EXTREME VOLUME | BULLISH PRESSURE
• REVERSAL | HIGH VOLUME | BEARISH PRESSURE
This allows traders to understand the current volume environment without interpreting every histogram bar manually.
LOW-VOLUME CONDITIONS
Low volume indicates limited market participation and weak directional confirmation.
Price movements and breakouts formed during low-volume periods may be less reliable, especially around rollover, daily market transitions or illiquid trading sessions. NOVA Volume Flow helps make these conditions immediately visible.
ALERTS
Optional popup alerts can be enabled for qualified conditions on completed candles.
Users can select alerts for:
• Strict reversal conditions
• High-volume conditions
• Extreme-volume conditions
Alerts are disabled by default and can be configured through the indicator inputs.
IMPORTANT INFORMATION
NOVA Volume Flow is an analytical tool and does not provide automatic trade entries, exits or guaranteed trading results.
MetaTrader 4 primarily uses broker-provided tick volume. Volume values can therefore differ between brokers and trading symbols. The indicator should be used together with price action, market structure, support and resistance, and appropriate risk management.
Clear volume. Visible pressure. Better market perspective.